trendobjects/iStock via Getty Images
Direxion Daily S&P Biotech Bull 3X Shares ETF (NYSEARCA:LABU) is a leveraged ETF in biotechnology with a factor of 3. It was launched on May 28, 2015. As described by Direxion, it is designed to magnify the daily performance of the S&P Biotechnology Select Industry Index, which is the underlying index of the SPDR S&P Biotech ETF (XBI). The issuer provides a clear warning on LABU and its bear sibling LABD: “The funds should not be expected to provide three times or negative three times the return of the benchmark’s cumulative return for periods greater than a day.” Indeed their daily leverage factor is a source of drift, which may be positive or negative. This article explains what “drift” means, quantifies it in 22 leveraged ETFs and shows historical data on LABU.
Why do leveraged ETFs drift?
Leveraged ETFs often underperform their underlying index leveraged by the same factor. ETF decay may have four reasons: beta-slippage, roll yield, tracking errors, management costs. Beta-slippage is the main reason in equity leveraged ETFs. To understand it, imagine a very volatile asset that goes up 25% one day and down 20% the day after. A perfect 2x leveraged ETF goes up 50% the first day and down 40% the second day. On the close of the second day, the underlying asset is back to its initial price:
(1 + 0.25) x (1 – 0.2) = 1
In the same time, the perfect leveraged ETF has lost 10%:
(1 + 0.5) x (1 – 0.4) = 0.9
It is the normal effect of leveraging and rebalancing. In a trending market, beta-slippage can be positive. If the underlying index goes up 10% two days in a row, on the second day, it is up 21%:
(1 + 0.1) x (1 + 0.1) = 1.21
The perfect 2x leveraged ETFs is up 44%:
(1 + 0.2) x (1 + 0.2) = 1.44
Beta-slippage is path-dependent. If the underlying index gains 50% on day 1 and loses 33.33% on day 2, it is back to its initial value, like in the first example. However, the 2x ETF loses one third of its value, instead of 10% in the first case:
(1 + 1) x (1 – 0.6667) = 0.6667
Without a demonstration, it shows that the higher the volatility, the higher the decay.
Monthly and yearly drift watchlist
There is no standard or universally recognized definition for the drift of a leveraged ETF. Mine is simple and based on the difference between the leveraged ETF performance and Ñ times the performance of the underlying index on a given time interval, if Ñ is the leveraging factor. Most of the time, this factor defines a daily objective relative to an underlying index. However, some dividend-oriented leveraged products have been defined with a monthly objective (mostly defunct ETNs sponsored by Credit Suisse and UBS: CEFL, BDCL, SDYL, MLPQ, MORL…).
First, let’s start by defining “Return”: it is the return of a leveraged ETF in a given time interval, including dividends. “Index Return” is the return of a non-leveraged ETF on the same underlying asset in the same time interval, including dividends. “Abs” is the absolute value operator. “Drift” is the drift of a leveraged ETF normalized to the underlying index exposure in a time interval, calculated as follows:
Drift = (Return – (IndexReturn x Ñ))/ Abs(Ñ)
“Decay” means negative drift.
|
Index |
Ñ |
Ticker |
1-month Return |
1-month Drift |
1-year Return |
1-year Drift |
|
S&P 500 |
1 |
3.50% |
0.00% |
30.17% |
0.00% |
|
|
2 |
6.34% |
-0.33% |
55.99% |
-2.18% |
||
|
-2 |
-5.90% |
0.55% |
-35.06% |
12.64% |
||
|
3 |
9.09% |
-0.47% |
85.45% |
-1.69% |
||
|
-3 |
-9.11% |
0.46% |
-49.95% |
13.52% |
||
|
ICE US20+ Tbond |
1 |
-1.29% |
0.00% |
-4.13% |
0.00% |
|
|
3 |
-5.66% |
-0.60% |
-29.46% |
-5.69% |
||
|
-3 |
4.40% |
0.18% |
13.30% |
0.30% |
||
|
NASDAQ 100 |
1 |
3.22% |
0.00% |
50.58% |
0.00% |
|
|
3 |
7.92% |
-0.58% |
177.39% |
8.55% |
||
|
-3 |
-8.95% |
0.24% |
-70.23% |
27.17% |
||
|
DJ 30 |
1 |
1.58% |
0.00% |
21.75% |
0.00% |
|
|
3 |
3.24% |
-0.50% |
53.33% |
-3.97% |
||
|
-3 |
-3.31% |
0.48% |
-37.36% |
9.30% |
||
|
Russell 2000 |
1 |
3.04% |
0.00% |
9.88% |
0.00% |
|
|
3 |
6.24% |
-0.96% |
3.65% |
-8.66% |
||
|
-3 |
-9.81% |
-0.23% |
-29.57% |
0.02% |
||
|
MSCI Emerging |
1 |
3.60% |
0.00% |
7.42% |
0.00% |
|
|
3 |
9.07% |
-0.58% |
1.65% |
-6.87% |
||
|
-3 |
-8.95% |
0.62% |
-14.14% |
2.71% |
||
|
Gold spot |
1 |
0.38% |
0.00% |
11.50% |
0.00% |
|
|
2 |
-0.02% |
-0.39% |
12.79% |
-5.11% |
||
|
-2 |
0.37% |
0.57% |
-12.25% |
5.38% |
||
|
Silver spot |
1 |
-2.17% |
0.00% |
7.86% |
0.00% |
|
|
2 |
-5.49% |
-0.58% |
1.39% |
-7.17% |
||
|
-2 |
4.50% |
0.08% |
-20.67% |
-2.48% |
||
|
S&P Biotech Select |
1 |
10.87% |
0.00% |
18.82% |
0.00% |
|
|
3 |
30.24% |
-0.79% |
15.77% |
-13.56% |
||
|
-3 |
-30.39% |
0.74% |
-58.48% |
-0.67% |
||
|
PHLX Semicond. |
1 |
9.66% |
0.00% |
60.61% |
0.00% |
|
|
3 |
27.77% |
-0.40% |
194.46% |
4.21% |
||
|
-3 |
-25.78% |
1.07% |
-81.84% |
33.33% |
LABU has the worst 1-year decay of this list with a drift of -13.56%. Over the last 12 months, the return of LABU (15.77%) is inferior to the return of the non-leveraged biotech index (18.82%). The highest positive drift in the same period belongs to Direxion Daily Semiconductor 3x Bear Shares ETF (SOXS), with +33.3% (in a large loss).
In a monthly time frame, the leveraged bull real estate ETF (TNA) has the worst decay (-0.96%), and SOXS has the highest drift again (+1.07%).
Positive drift follows a steady trend in the underlying asset, whatever the trend direction and the ETF direction. It means positive drift may come with a gain or a loss for the ETF. Negative drift comes with daily return volatility. For example, in one year:
- both bull and bear Nasdaq 100 ETFs have positive drifts thanks to a strong uptrend.
- bull and bear silver ETFs have negative drifts due to continued whipsaw.
LABU drift history
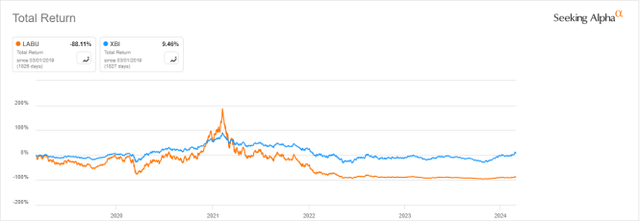
LABU aims at a daily return of 3 times the daily performance of the underlying index of XBI. Since inception, LABU has lost 95.4% of its value while XBI has gained 25.5%. People who say that a leveraged ETF “will always recover one day” don’t understand slippage. In the case of LABU, I take little risk if I say it will never happen. As plotted on the next chart, LABU has lost 88% in 5 years and XBI gained about 9%. This chart shows how a leveraged ETF can spike in a strong rally (here in 2021), collapse in a correction, then slowly decay in a sideways market.

LABU and XBI, 5-year return (Seeking Alpha)
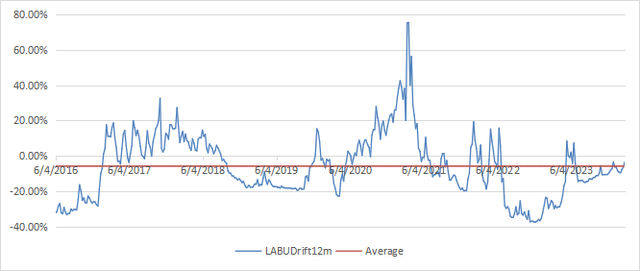
The next chart plots the 12-month drift of LABU starting in June 2016, one year after inception. A 12-month delay is necessary for the drift calculation.

12-month drift of LABU since 6/1/2016 (Chart: author, data: Portfolio123)
The 12-month drift has been negative 63.6% of the time since June 2016. The time-weighted average is -5.88%. This is the average annual decay normalized to the underlying index exposure. As the leverage factor is 3, the average annual decay of LABU itself is close to -18%.
The drift was far in negative territory at the beginning because the whole healthcare sector has been very volatile between August 2015 and January 2016. It jumped back in positive territory in Q1 2017, when this bad period went out of the look-back interval. Then, the 12-month drift has alternated positive and negative periods. Biotechnology is a very volatile industry with powerful rallies and deep corrections. The drift was at its worst level in December 2022.
As a conclusion, LABU is a short-term trading instrument for seasoned traders who execute a strategy with planned entry and exit signals, and who understand the fund’s behavior behind the leverage factor. For a very large majority of investors, the best strategy with LABU is described in two words: stay away.


