champc
Janus Henderson Group (NYSE:JHG) is a cheap stock by most conventional metrics including valuation relative to peers.
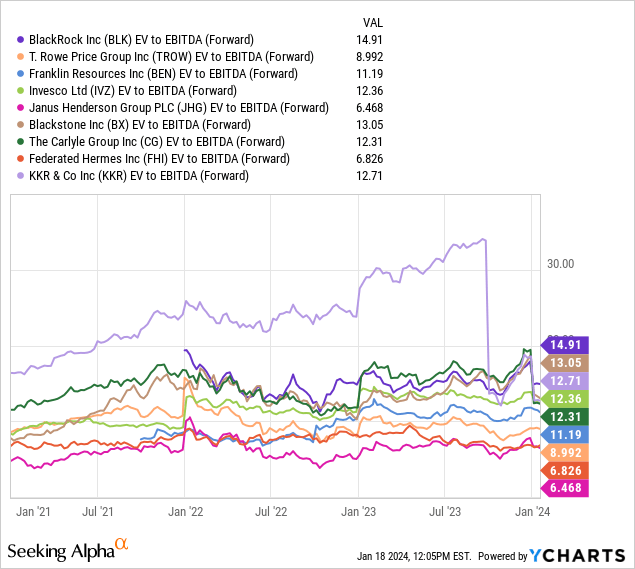
JHG trades at a forward EV/EBITDA multiple of just ~6.5x. Comparably, industry leader BlackRock (BLK) trades a forward EV/EBITDA multiple of 14.9x. Large asset management peers Invesco (IVZ), Franklin Resources (BEN), T. Rowe Price (TROW), and Federated Hermes (FHI) trade at forward EV/EBITDA multiples of 12.4x, 11.2x, 9x, and 6.8x respectively.
In order to determine if this valuation discount is warranted, investors must carefully consider key differences between JHG and its larger peers.
JHG stands out due to its smaller scale, less significant alternatives exposure, and higher exposure to equities relative to peers. On the whole, I view these factors as negatives which make the valuation discount to larger peers appropriate. For this reason, I do not currently view JHG as attractive vs. peers, and I am initiating JHG with a hold rating.
Smaller Scale Than Peers Has Pros and Cons
As of Q3 2023, JHG had total AUM of $308.2 billion. Comparably, BLK has ~$10 trillion of AUM while IVZ, BEN, TROW, and FHI have ~$1.59 trillion, ~$1.46 trillion, ~$1.45 trillion, and $715 billion of AUM respectively.
One key negative of lower AUM is that it makes it more challenging to achieve economies of scale. Asset managers tend to charge fees as a % of assets. The result of this is that a fund with $1 billion in assets will bring in ~10x the revenues of a fund with $100 million in assets. However, the costs to run a $1 billion fund are generally not much higher than the cost to run a $100 million fund as the asset manager does not need 10x the investment staff.
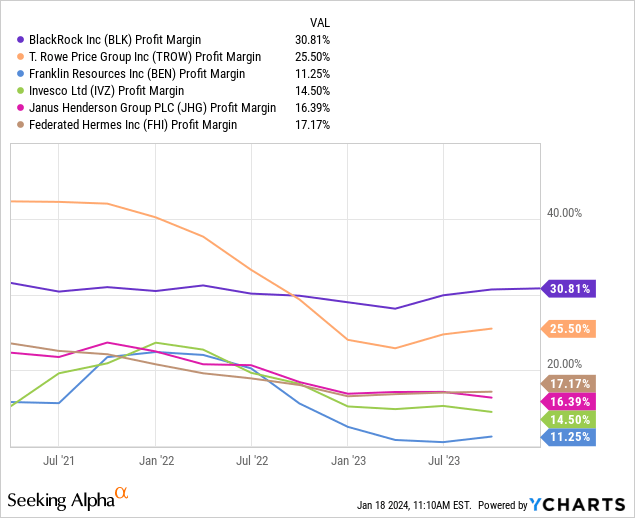
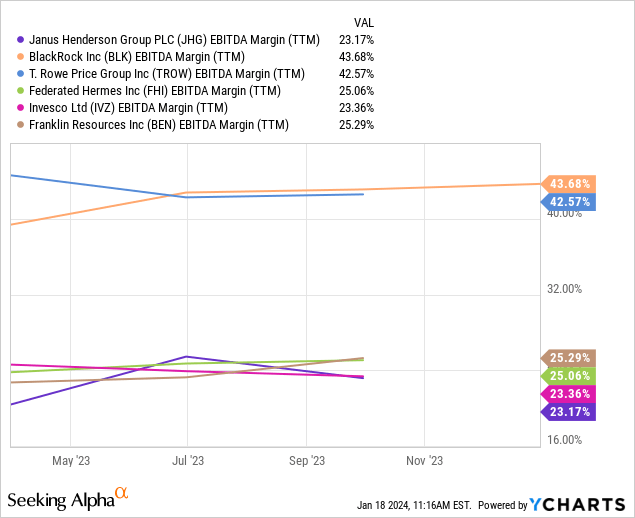
Despite having much smaller scale relative to peers, JHG has recently been able to generate profit margins and EBITDA margins which have been in line with larger peers BEN, IVZ, and FHI. That said, JHG’s margins are still well below BLK and TROW. Over the long term, due to rising investment personnel costs and technology costs, I believe it may be difficult for JHG to maintain margins in line with larger peers unless it meaningfully increases its scale.
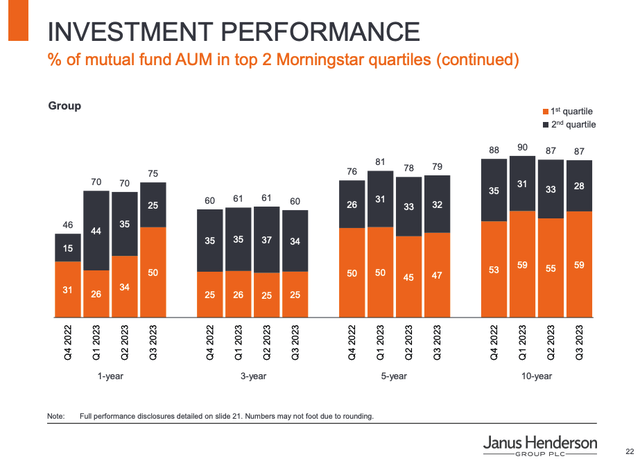
While JHG’s smaller scale is a headwind in terms of achieving economies of scale, there are two key positives that offset this negative. Firstly, as a smaller organization, JHG may be able to be more nimble and better able to generate stronger investment performance. Evidence for this can be seen in JHG’s strong long-term performance. Over the past 10 years, 59% of JHG’s mutual funds have delivered top quartile performance while 28% have delivered 2nd quartile performance. Secondly, given its smaller size JHG is a potential acquisition target for larger players. Previously, JHG activist shareholder Nelson Peltz has pushed JHG to consider a merger with IVZ. While that deal has not played out, I do believe that JHG’s relatively small scale makes it a potential acquisition target for larger players. While IVZ could come back into the fold, I believe other players such as BEN, TROW, or the captive asset management arms of Morgan Stanley (MS) or Goldman Sachs (GS) may find JHG an appealing acquisition target to create further scale.
In order to get a sense of the impact of JHG’s smaller scale on valuation, I believe it is relevant to consider the fact that FHI, which has ~$715 billion in AUM trades at a forward EV/EBITDA multiple of 6.8x. Comparably, IVZ, BEN, and TROW have an average combined AUM of $1.5 trillion and trade at an average forward EV/EBITDA multiple of 10.9x. BLK, which has ~$10 trillion in AUM, trades at an industry-high forward EV/EBITDA multiple of 14.9x.
While the relationship is not necessarily linear between AUM and valuation multiples, I believe there is a strong case to be made that on balance larger firms should trade at a premium valuation vs. smaller firms due to benefits of scale.
Less Alternatives Exposure Than Some Peers
Currently, JHG has just $9.4 billion of alternatives AUM which accounts for ~3% of total AUM. Additionally, JHG’s alternatives AUM is largely focused in the liquid markets space with Absolute Return Equity and Global Commodities Enhanced Index products accounting for $3.4 billion and $2.8 billion of AUM respectively. JHG lacks significant exposure to higher fees and more profitable alternatives segments such as private credit and private equity.
Among JHG’s peers, BEN stands out due to its high alternatives exposure with ~18% of its AUM coming from alternatives. IVZ is not far behind with ~11% of its AUM coming for alternatives. While BLK has just ~3% of AUM in alternatives, it has significant exposure to high fee areas such as private equity and private credit. Alternatives currently account for ~12% of BLK’s base fees. BLK also just announced a major deal to acquire Global Infrastructure Partners, which will add another $100 billion in alternatives AUM for BLK.
TROW stands out as being most similar to JHG in that just ~3.3% of total AUM is made up of alternatives.
As shown by the chart, high quality alternatives managers such as Blackstone (BX), KKR (KKR), and Carlyle Group (CG) tend to trade at a premium to traditional asset managers. This makes sense as the alternative asset management business is faster growing than the traditional asset management business and faces a lower threat from passive low fee products.
Currently, BX, KKR, and CG trade at an average forward EV/EBITDA of ~12.7x. Comparably, TROW, which does not have a substantial alternatives business trades at a forward EV/ EBITDA multiple of 9x. IVZ and BLK receive premium valuations due in part to their large passive and ETF businesses which have benefited from the shift towards passive low fee products. Passive products account for ~39% of IVZ’s AUM while ETFs make up 40% of BLK’s base fees.
BEN represents an interesting comp as it is a mix of an alternative and traditional asset manager. BEN currently trades at a forward EV/EBITDA multiple of 11.2x. Assuming a weight of 30% to alternatives peers (~12.7x multiple), the implied valuation of BEN’s traditional asset management business is ~10.5x. Note that I have applied a 30% weight to the alternatives business even though it only makes up 18% of AUM as alternatives products tend to have higher fees and thus account for a greater percentage of EBITDA than AUM. While BEN does not break out revenue from alternatives, TROW does. Alternatives account for ~3% of TROW’s AUM but account for ~5% of total revenue. Thus, I have used this ratio in terms of estimating how to weigh the contribution of BEN’s alternatives business.
I also view FHI, which trades at a forward EV/EBITDA multiple of 6.8x, as a reasonable comp for traditional asset manager valuation purposes. While money market products account for ~73% of the firm’s AUM, they account for just ~37% of total revenue with remaining revenue coming from fixed income, equity, multi-asset, and alternatives.
Thus, based on this analysis, I believe a reasonable peer-based forward EV/EBITDA multiple for a primarily traditional asset management business is ~8.8x (average of 6.8x, 9x, and 10.5x.)
Higher Exposure To Equities Has Pros and Cons
~61% of JHG’s total AUM comes from equities while ~21% comes from fixed income and ~15% comes from multi-asset products. The remaining ~3% of AUM comes from alternatives. Comparably, ~52% of BLK’s AUM comes from equities, ~52% of IVZ’s AUM comes from equities, and ~34% of BEN’s AUM comes from equities.
TROW, which I view as JHG’s closest peer given the lack of alternatives and passive exposure, derives ~54% of total AUM from equities. Thus, JHG stands out due to its relatively high percentage of AUM coming from equity-based strategies.
The key positive related to a larger share of equities AUM is that equities tend to appreciate in value more over time compared to fixed-income or multi-asset products. The result is that holding all else equal, equity AUM benefits from a long-term tailwind due to asset appreciation.
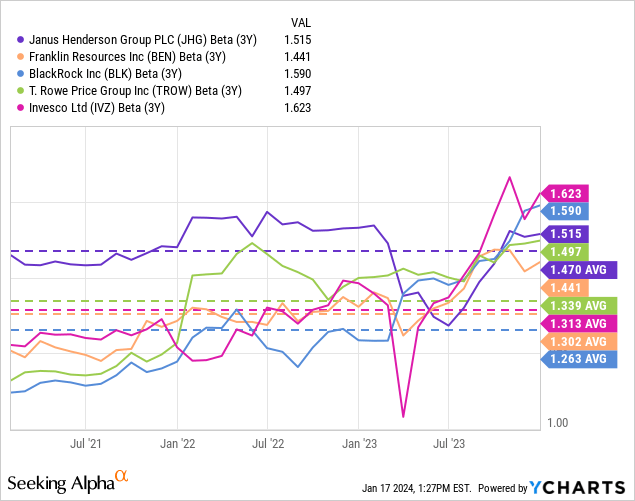
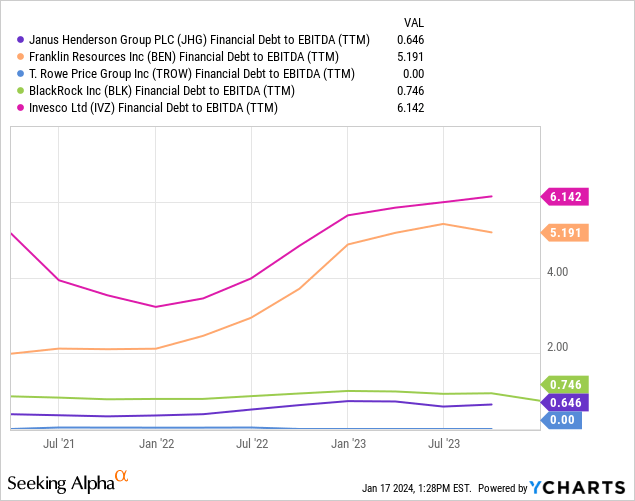
One negative related to a higher share of equities AUM is that AUM will be more volatile as equity products tend to exhibit higher volatility than fixed-income or multi-asset products. The result of this is that a higher percentage of equity AUM is likely to lead to more earnings volatility as short-term earnings movements are highly dependent on market moves as fees are typically based on a percentage of assets. The higher volatility nature of JHG’s business can be seen in the fact that it has experienced an average 3-year trailing levered beta of 1.47 over the past 3 years. This is the highest among JHG’s peer group despite the fact that JHG has among the best balance sheets with much less leverage than peers such as BEN and IVZ.
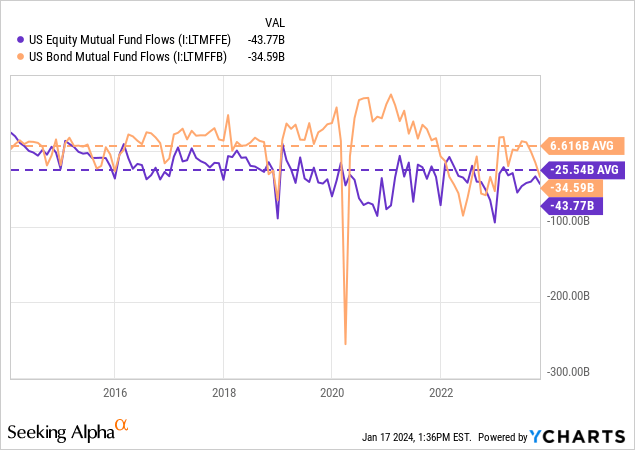
Another key negative related to a high equity exposure as a part of AUM is that active equity fund flows have exhibited more pressure due to the secular shift towards passive and ETFs relative to other asset classes. As shown by the chart below, over the past 10 years, bond mutual funds have received average quarterly inflows of $6.6 billion while equity mutual funds have received average quarterly outflows of $25.5 billion.
Finally, another key negative related to a high degree of equity exposure is that equity markets tend to be more efficient and thus it is more difficult for active managers to add value vs. fixed income. For example, according to Morningstar, the percentage of active U.S. Blend funds that have beat their benchmark over the past 10 years is just 13.1%. Comparably, 35.8% of core bond funds have outperformed their benchmarks over the same period of time.
My view of these factors is that the cons modestly outweigh the pros but the impact is hard to quantify. This is especially true given the fact the JHG equity funds have delivered solid performance with 88% of the firm’s equity mutual funds exhibiting top-two quartile performance over the past 10 years.
Given the fact that JHG has strong historical equity performance, I believe only a modest valuation discount of 0.25x is appropriate due to this factor.
Growth Estimates vs. Peers
Consensus estimates call for JHG to grow FY 2024 EPS by ~5% and FY 2025 EPS by ~9%. As shown by the table below, this level of growth is roughly in line with peer EPS growth estimates. I believe this is reasonable as the challenges related to smaller scale and an increased focus on traditional equities are likely to be longer-term earnings headwinds as opposed to short-term earnings headwinds.
Author (Seeking Alpha data)
Recently Initiated Share Repurchase Program
As part of its Q3 2023 earnings release, JHG announced that its board had approved a new $150 million share repurchase authorization through April 2024. While JHG has previously repurchased shares, it has not repurchased any shares since Q2 2022.
Based on current market prices, the $150 million repurchase authorization represents ~3% of JHG’s outstanding shares. While this repurchase program is relatively small in size, I believe JHG could decide to further increase the repurchase program in the future as the company has net cash of $810.4 million which represents ~17% of the current market cap.
I view the recently announced share repurchase program as only a modest positive given its small size. Comparably, BEN has a repurchase authorization representing ~8% of shares outstanding.
Takeaways and Fair Value Estimate
JHG’s smaller scale vs. peers has both pros and cons. JHG’s smaller scale is a negative in that it may be hard to match the efficiency of much larger peers. However, JHG has recently delivered profit margins that are in line with much larger peers such as IVZ, BEN, and FHI. The key positive to JHG’s smaller size is that it is an attractive acquisition target for larger players. However, there is no reason to believe the company is currently exploring a sale process despite previous efforts by activist shareholder Nelson Peltz to pursue a merger.
While it is difficult to quantify the impact of JHG’s smaller scale given these factors, I believe a reasonable estimate is that JHG should trade at a discount of ~2x EV/EBITDA due to this factor. I arrive at this discount by comparing FHI’s EV/EBITDA multiple of ~6.8x to the blended forward EV/EBITDA of TROW and BEN (traditional business) of ~9.8x.
JHG’s low degree of alternatives exposure relative to peers is easier to quantify than the scale difference in terms of a valuation discount. The three closest comps to JHG are TROW, FHI, and BEN (after adjusting for alternatives exposure). Based on these valuations, I believe a forward EV/EBITDA multiple of ~8.8x is reasonable for a traditional asset management business with scale.
JHG has more exposure to equities than peers, which I view as a moderate negative given the more efficient nature of equity markets and challenging active flows environment. Thus, I believe a discount of ~0.25x EV/EBITDA is reasonable for JHG compared to more diversified peers due to JHG’s larger exposure to equities.
Thus, taken together I believe a fair value for JHG based on peers is a forward EV/EBITDA multiple of ~6.55x which is fairly close to the current multiple of ~6.47x. For this reason, I find that JHG is reasonably valued vs peers based on current prices.
I would consider upgrading JHG if the company gets more aggressive in terms of its repurchase program or the company decides to put itself up for sale. I would also consider upgrading the stock if the valuation becomes more attractive vs. peers. Additionally, I would consider it a positive development if the company is able to successfully execute M&A opportunities in the alternatives space.
