
BlackJack3D
Investment Thesis
The technology sector outperformed the S&P 500 in 2023 by a large margin. Although in the first quarter of 2024 the technology sector has performed on par with the S&P 500, I believe that Technology will outperform the S&P 500 index over the whole year.
iShares U.S. Technology ETF (NYSEARCA:IYW) is one of the best positioned technology ETF, and as such it will, likely, produce excellent results. Over the most recent 12-month period, IYW returned 50%, while S&P 500 returned 32%. That is a solid performance that I believe it will continue for the remaining of this year.
IYW Fund Profile
iShares Trust – iShares U.S. Technology ETF is an exchange traded fund launched by BlackRock, Inc. It is managed by BlackRock Fund Advisors. It invests in public equity markets of the United States. It invests in stocks of companies operating across information technology sectors. The fund invests in growth and value stocks of companies across diversified market capitalization. It seeks to track the performance of the Russell 1000 Technology RIC 22.5/45 Capped Index, by using representative sampling technique. The index’s unique regulatory framework requires that all stock components that constitute the Russell 1000 Technology index are capped quarterly so that no single constituent holds more than 22.5% weight in the index. Further, the sum of the weights of all constituents that represent more than 4.5% of the index will not exceed 45% of the total index weight.
Fund Details
Fund Type Sector Equity
Issuer iShares
Inception 05/15/2000
Expense Ratio 0.40%
AUM $16.45B
Dividend Yield 0.23%
Currently, as of 3/30/2024, the fund has 136 stock holdings. The sector breakdown is as follows: 89.84% in Technology, 9.76% in Communications and 0.37% in Industrials.
Microsoft Corp (MSFT) 18.26%
Apple Inc. (AAPL) 14.81%
NVIDIA Corp (NVDA) 12.63%
Meta Platforms, Inc. (META) 3.87%
Broadcom Inc. (AVGO) 3.01%
Alphabet Inc. Class A (GOOGL) 2.75%
Salesforce, Inc. (CRM) 2.55%
Alphabet Inc. Class C (GOOG) 2.34%
Advanced Micro Devices (AMD) 2.30%
Adobe Inc. (ADBE) 2.06%
Total 64.58%
# of Holdings 136
*Holdings as of 2024-03-27
We see that the maximum holding is under 22.50%, and that the sum of the three holdings, Microsoft, Apple and Nvidia, is only a fraction greater that 45%. The remaining 133 stocks represent about 54%, and none of those exceeds 4%. The allocation of the capital realizes a broad diversification while it allows a large allocation to stocks with exceptional performance.
In order of gaining some insight into the effect of capital allocation, I show the top 10 holdings of IYW, together with that of another two technology ETFs, the Invesco QQQ Trust ETF and the Invesco S&P 500 Equal Weight Technology RSPT.
|
IYW |
QQQ |
RSPT |
|||
|
MSFT |
18.26% |
MSFT |
8.74% |
MU |
1.85% |
|
AAPL |
14.81% |
AAPL |
7.40% |
ORCL |
1.72% |
|
NVDA |
12.63% |
NVDA |
6.31% |
WDC |
1.66% |
|
META |
3.87% |
AMZN |
5.24% |
ZBRA |
1.64% |
|
AVGO |
3.01% |
META |
4.75% |
TER |
1.63% |
|
GOOGL |
2.75% |
AVGO |
4.43% |
ANET |
1.63% |
|
CRM |
2.55% |
GOOGL |
2.49% |
MSI |
1.63% |
|
GOOGL |
2.34% |
GOOGL |
2.41% |
FSLR |
1.61% |
|
AMD |
2.30% |
TSLA |
2.37% |
APH |
1.60% |
|
ADBE |
2.06% |
COST |
2.35% |
ANSS |
1.59% |
|
64.58% |
46.49% |
16.57% |
Historical Performance of the technology ETFs
The next four charts show the total returns of the following four ETFs: IYW, QQQ, RSPT and SPY.
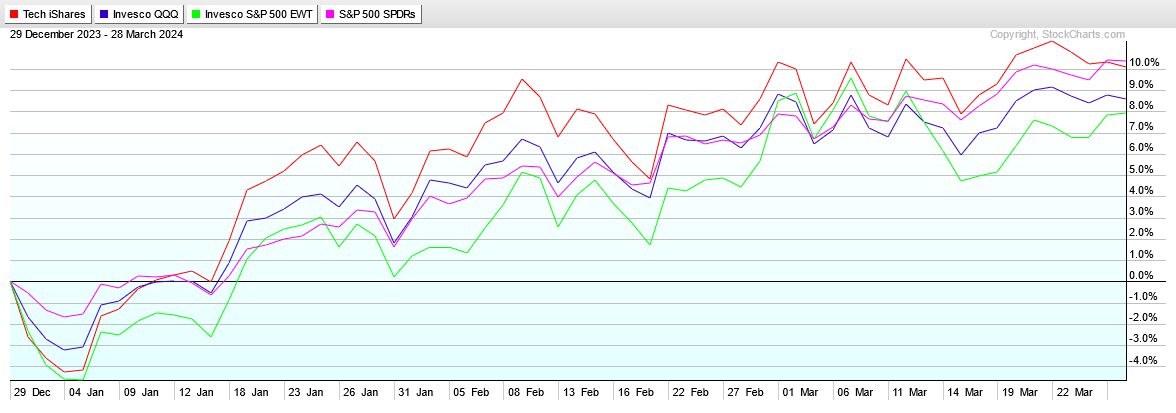
stockcharts.com
The chart above shows the total returns over the first quarter of 2024. The returns are SPY (10.39%), IYW (10.09%), QQQ (8.57%), RSPT (7.95%).
The next three charts show the total returns over 1, 5 and 10 years.
One-year returns: IYW (52.88%), QQQ (45.54%), RSPT (34.80%), SPY (34.14%).
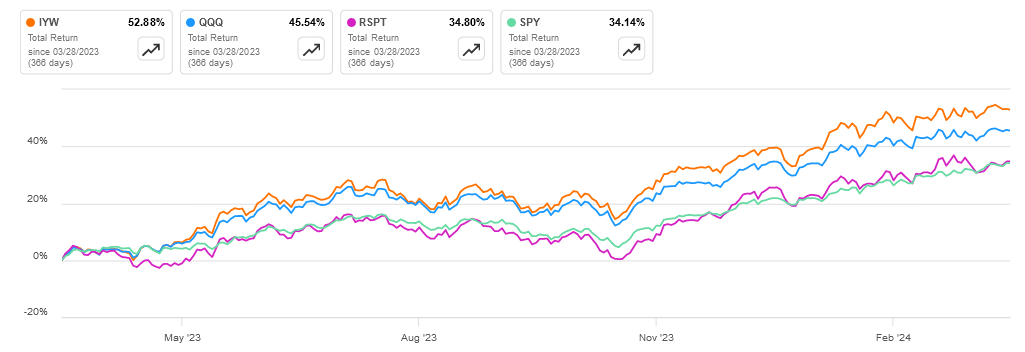
SA
Five-year returns: IYW (193.86%), QQQ (157.59%), RSPT (119.02%), SPY (101.94%).
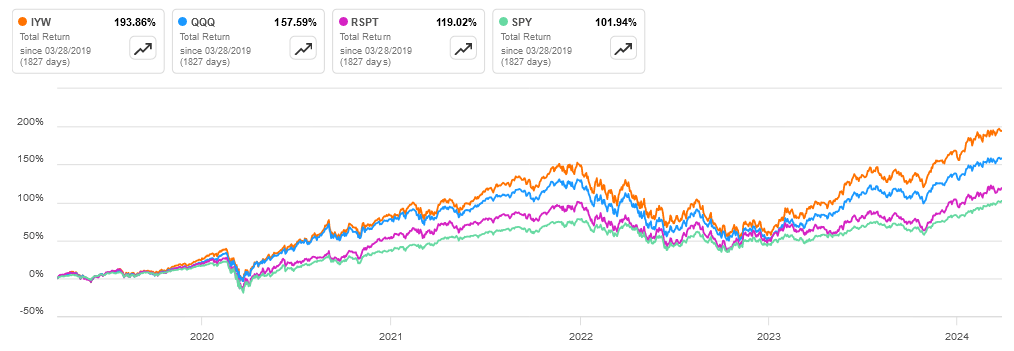
SA
Ten-year returns: IYW (551.37%), QQQ (460.07%), RSPT (384.60%), SPY (235.85%).
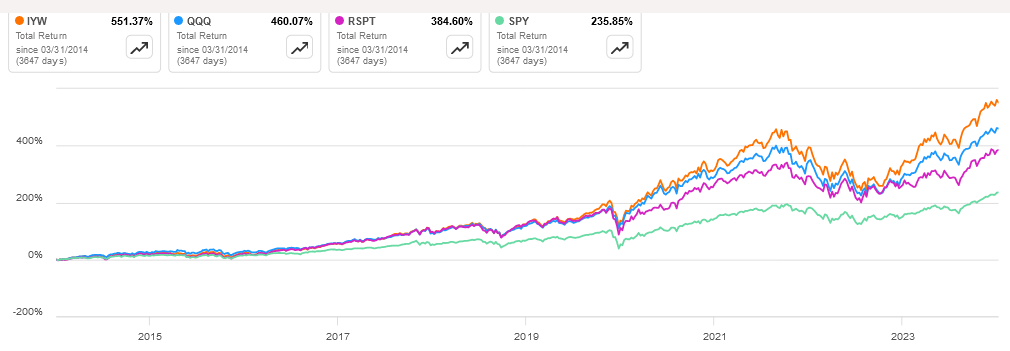
SA
Analysis
The historical performance charts show that IYW has outperformed the S&P 500 by a large margin over all time frames. Additionally, IYW is consistently, the best among the technology funds.
The three technology funds considered in this article, IYW, QQQ and RSPT are very similar and all perform better than the broad market. They differ among themselves mostly in their capital allocation strategy. The first observation is that the equal weight allocation in RSPT leads to lower returns. QQQ with market cap allocation does better at all time frames.
We can infer that by making much higher allocations to the three top performing stocks, IYW achieves a substantial advantage over QQQ with allocations proportional to the stocks market cap. The managers of IYW have demonstrated that they can capitalize on this advantage.
As a specific example, look at the allocations in NVIDIA: IYW allocates 12.63%, while QQQ allocates only 6.31%. Nvidia returned 82% in the first quarter of 2024.
The markets have been in a strong uptrend since October 27, 2023, to the end of March 2024. Over this period, there have not been any corrections, in fact, the maximum drawdown was a mere -1.93% on January 4, 2024. Although the market started the second quarter with two consecutive daily declines, I believe that the rally will continue. The consensus expectation is for strong earnings in the second quarter.
The Seeking Alpha Quant rates IYF as a “buy”. It ranks as 5th out of 84 technology funds.
Risks to the thesis
Although the Fed has indicated that it is done raising interest rates and that it expects start cutting rates in the second half of the year, it is still possible, although unlikely, that the Fed will change course and raise again the rates if the inflation returns. In fact, the current market sell-off is the result of new worries related to inflation. The inflation worries are feeding on strong economic data, tight job market, higher crude oil and energy prices, increase in labor costs, etc.
Conclusion
In conclusion, I rate IYW as a “BUY”.

 Q2 2024 Earnings Call Transcript")

