Smith Collection/Gado/Archive Photos via Getty Images
In our previous analysis of Intuit (NASDAQ:INTU), we highlighted the company’s adept navigation of digitalization trends, successfully transitioning from a desktop model to an Online Ecosystem. We anticipated a 4-year forward average revenue growth of 25.7% for its Small Business & Self-Employed segment. In this current analysis, we sought to identify the primary drivers propelling Intuit’s success, examining whether it is predominantly driven by Application Software or Fintech, specifically payment processing. Our initial step involved contrasting fintech and software companies, elucidating the distinctions in their growth drivers. Additionally, we conducted an in-depth analysis of Intuit’s growth drivers, updating our outlook on its future growth trajectory. Lastly, we examined the company’s profitability and benchmarked it against the software industry.
Driven by Software Rather than Fintech
Previously, we had classified Intuit as a fintech company which we believed the company displayed characteristics of both software and use in finance. Following the revision of GICS in March 2023, the fintech subindustry has been defined with greater clarity with the creation of the new Transaction & Payment Processing Services subindustry. However, Intuit remained classified under the Application Software subindustry.
We examine the difference between fintech, and software companies based on the business activities of these companies. In the Fintech subindustry, companies play a role as intermediaries for the facilitation of funds through virtual online networks. Its customers may include business merchants where the company would act as a payment processor for when merchants’ customers make payments. According to TechBullion, fintech companies may also offer “a range of financial services such as online payments, investment management crowdfunding, loans and credit scoring among others”.
On the other hand, application software companies produce software and digital tools with comprehensive features or use cases that assist the user in getting something done more efficiently and accurately. Their customers may include businesses or individuals. Businesses ranging from small to large enterprises may use software solutions to assist them in their daily management and streamlining of operations and business processes due to the benefits such as accuracy, greater efficiency and lower cost. Individuals may use these software solutions for similar benefits in the management of their own personal activities. For example, ERP software saves time for users with digitalized solutions compared to manual processes, making workflows more efficient.
Intuit’s products include its QuickBooks, TurboTax and Credit Karma products. QuickBooks is the company accounting software suite that has various comprehensive features to help business customers in their management of the company’s accounting and finance operations such as simplifying invoicing by enabling businesses to create, send, and track invoices accurately. Also, the platform also facilitates expense and time tracking for employees or subcontractors. QuickBooks supports payment management, allowing businesses to handle bills, payments, and track cash flows. It also efficiently manages payroll processes. Overall, QuickBooks is a comprehensive financial management tool that streamlines various aspects of business operations and may lead to cost savings compared to hiring external accountants.
Furthermore, TurboTax guides individuals through the digitalized process of filing tax returns, streamlining their tax preparation process and also provides an accuracy guarantee, allowing users to prepare their tax returns more efficiently through digital tax filings. TurboTax also features various comprehensive features such as identifying potential deductions and credits as well as providing live support. Furthermore, compared to hiring an accountant, TurboTax provides cost savings.
Finally, Credit Karma “provides users with their credit scores” from TransUnion and Equifax as well other personal financial services such as credit reports and personalized recommendations for loans.
Therefore, we believe that Intuit’s QuickBooks and Turbo Tax align with the criteria of software rather than fintech.
Instead of observing market trends such as transaction growth and payment volume growth which are useful for fintech companies, we believe Intuit’s outlook is better explained by the growth drivers of digitalization and technological innovation. We see digitalization spurring increased demand for digitalized solutions and software products, leading to higher user growth. According to Gartner, 91% of businesses have a digitalization initiative in place. Furthermore, “more than half of accounting and finance processes still being fulfilled manually with high dependence on traditional Excel spreadsheets” according to Croner, indicating a large portion of the market has yet to adopt an automated specialized software solution such as Quickbooks.
Additionally, another driver is technological innovation through the introduction of new products and features which could drive Average Revenue Per User (‘ARPU’) growth. By constantly introducing new functionalities or premium services, companies can entice existing users to upgrade their subscriptions or purchase additional features, thus increasing their ARPU.
Intuit Growth Drivers
Based on the growth drivers identified in the first point, we focused this point on the company’s growth outlook.
|
Intuit SBO Segment |
2018 |
2019 |
2020 |
2021 |
2022 |
2023 |
Average |
|
Online Ecosystem Revenue ($ mln) |
1,206 |
1,663 |
2,182 |
2,750 |
4,438 |
5,759 |
|
|
Growth % |
37.9% |
31.2% |
26.0% |
61.4% |
29.8% |
37.3% |
|
|
Online Customers (‘mln’) |
3.5 |
4.5 |
5.0 |
5.7 |
7.0 |
7.8 |
|
|
Growth % |
28.6% |
11.1% |
14.0% |
22.8% |
11.4% |
17.6% |
|
|
Online Paying ARPU |
345 |
370 |
436 |
482 |
634 |
738 |
|
|
Growth % |
7.3% |
18.1% |
10.6% |
31.4% |
16.5% |
13.1% |
|
|
Desktop Ecosystem Revenue ($ mln) |
1,855 |
1,870 |
1,868 |
1,938 |
2,022 |
2,279 |
|
|
Growth % |
0.8% |
-0.1% |
3.7% |
4.3% |
12.7% |
4.3% |
|
|
Desktop Customers (‘mln’) |
1.1 |
1.2 |
1.1 |
1.0 |
1.0 |
1.0 |
|
|
Growth % |
9.1% |
-8.3% |
-9.1% |
0.0% |
0.0% |
-1.7% |
|
|
Desktop Paying ARPU |
1,686 |
1,558 |
1,698 |
1,938 |
2,022 |
2,279 |
|
|
Growth % |
-7.6% |
9.0% |
14.1% |
4.3% |
12.7% |
6.5% |
|
|
Total ARPU ($) |
665 |
620 |
664 |
700 |
808 |
913 |
|
|
Growth % |
-6.9% |
7.1% |
5.4% |
15.4% |
13.1% |
6.8% |
|
|
Total Users (‘mln’) |
4.6 |
5.7 |
6.1 |
6.7 |
8.0 |
8.8 |
|
|
Growth % |
23.9% |
7.0% |
9.8% |
19.4% |
10.0% |
14.0% |
|
|
Total Revenue ($ mln) |
3,061 |
3,533 |
4,050 |
4,688 |
6,460 |
8,038 |
|
|
Growth % |
15.4% |
14.6% |
15.8% |
37.8% |
24.4% |
21.6% |
Source: Company Data, Khaveen Investments
The table above analyses the company’s revenue dynamics in both its online and desktop ecosystems. Beginning with the online ecosystem, it is clear that the company has seen significant revenue growth with an average of 37%. This upward revenue growth trend is mainly driven by the steady increase in the online ecosystem’s average revenue per user (ARPU), reflecting its continuous innovation of new features for QuickBooks, which are over 10 added features in 2023, including flexible account mapping released or employee document management. The consistent growth of its customer base suggests it has benefited from the digitalization growth driver. In contrast, the desktop ecosystem’s revenue has fluctuated, with a slight decrease in 2020 and a notable increase of 12.7% in 2023, the number of desktop customers has remained relatively flattish as customers switch to the online ecosystem.
Overall, the total revenue growth for Quickbooks has been strong with an average of 21.6% with a growth of 24.4% in 2023. This expansion is supported by a consistent increase in Total Customers, which rises by 14.0% per year on average, reaching 8.8 mln users, indicating Intuit is capitalizing on the digitalization growth driver. Meanwhile, the Total ARPU has increased significantly, rising by 15.4% in 2022 and 13.1% in 2023 as the company introduced new products and services, highlighting it is capitalizing on the innovation driver.
|
Intuit Consumer Segment |
2019 |
2020 |
2021 |
2022 |
2023 |
Average (4-Year) |
|
Total Processed Electronic Return (‘mln’) |
32.3 |
35.8 |
37.7 |
37.9 |
36 |
|
|
Returns Filed Growth (%) |
10.8% |
5.3% |
0.5% |
-5.0% |
2.9% |
|
|
Total ARPU |
62 |
63 |
68 |
79 |
89 |
|
|
Total ARPU Growth (%) |
6.9% |
1.6% |
7.9% |
16.2% |
12.7% |
9.6% |
|
Intuit Tax Revenue ($ mln) |
2,775 |
3,136 |
3,563 |
3,915 |
4,135 |
|
|
Growth % |
10.6% |
13.0% |
13.6% |
9.9% |
5.6% |
10.5% |
Source: Company Data, IRS, Khaveen Investments
Besides that, Intuit’s TurboTax revenue had also been positive in the past 5 years with an average of 10.5%. As seen, TurboTax revenue growth had been driven mainly by ARPU growth compared to the number of processed returns growth, highlighting it has been capitalizing on the innovation drivers such as TurboTax Live and TurboTax Online. However, its total processed return growth was negative in 2023 as the total market electronic returns declined by 2.3%. That said, its number of processed returns has a positive average of 2.9%, we believe the company could continue capitalizing on the increasing digitalization and new regulations to promote the adoption of electronic tax returns in the US.
|
Intuit Segment Revenues Projections ($ mln) |
2023 |
2024F |
2025F |
2026F |
|
Small Business & Self-Employed |
8,038 |
9,526 |
11,204 |
13,067 |
|
Growth % |
24.4% |
18.5% |
17.6% |
16.6% |
|
Consumer |
4,135 |
4,664 |
5,162 |
5,713 |
|
Growth % |
5.6% |
12.8% |
10.7% |
10.7% |
|
ProConnect |
561 |
576 |
586 |
591 |
|
Growth % |
2.7% |
2.7% |
1.7% |
0.7% |
|
Credit Karma |
1,634 |
1,552 |
1,902 |
2,329 |
|
Growth % |
-9.47% |
-5.00% |
22.50% |
22.50% |
|
Total |
14,368 |
16,318 |
18,853 |
21,700 |
|
Growth % |
12.9% |
13.6% |
15.5% |
15.1% |
Source: Company Data, Khaveen Investments
Based on our analysis, we updated our revenue projections as shown in the table above. For the Small Business and Self-Employed (SBO) segment, we made separate projections for the Online Ecosystem and Desktop Ecosystem segments. Firstly, for the Online Ecosystem segment, we looked at historical trends in the number of online customers and the growth of online paying ARPU. We then forecasted revenue for this segment using a four-year average customer and ARPU growth rate, excluding 2022 as an outlier due to Intuit’s acquisition of Mailchimp, and conservatively tapered our forecast by 1% beginning in 2025. Similarly for the Desktop Ecosystem segment, our projections are based on a 5-year average growth rate of desktop customers and their paying ARPU, as it is declining year-over-year due to customers moving to the online ecosystem.
In summary, we expect the SBO segment to grow by 18.5% in 2024 driven by digitalization through customer growth as well as innovation of new features including AI supporting its ARPU growth. We believe its customer growth is supported by its branding and top reviews. Regarding technology innovation, Intuit has integrated Mailchimp into QuickBooks, creating upselling opportunities for existing QuickBooks customers as it is sold separately. Moreover, the company also mentioned in the Q1 FY2024 earnings briefings that the company is “building an AI native CRM within the QuickBooks platform”. Thus, we believe these ongoing improvements could support Intuit increase its ARPU.
In the Consumer segment, our revenue projection for 2024 is based on a 5-year average growth of total Electronic Returns and total ARPU, tapered down by 1% as a conservative estimate per year. We see its customer growth supported by its branding and top reviews, while ARPU growth is driven by the innovation of new features such as TurboTax Live Full Service and Intuit Assist.
Additionally, Intuit’s implementation of a new, higher pricing plan has the potential to increase TurboTax’s ARPU. However, such price increases could result in customer dissatisfaction and loss of loyalty if the services become more expensive. Nonetheless, Intuit maintains its dominance in the tax preparation market, with over 70% market share in 2021 and reaching 36 million tax filings in 2023, compared to its closest competitor’s 20 mln filings (HR Block). Given TurboTax’s long-standing reputation and market position, we believe the price increase may have little impact on its branding while increasing ARPU and revenue significantly.
Because the ProConnect segment is a smaller segment within the company, we based projections on revenue growth in 2023, with a similar conservative adjustment in 2025 and 2026. For Credit Karma, our revenue forecast is based on its growth of -5% in Q1 2024 and an improvement of a midpoint of guidance of 22.5% thereafter. Overall, our projected revenue growth for 2024 is 13.6%, which is slightly higher than management’s guidance of between 11 to 12% growth in the same period.
Above Industry Average Profitability Supported by Accounting Software Dominance
|
Company (5-Year Average) |
Gross Profit Margin |
Net Income Margin |
FCF Margin |
|
SAP (SAP) |
71.26% |
15.18% |
23.11% |
|
Salesforce (CRM) |
74.13% |
7.03% |
32.06% |
|
Adobe (ADBE) |
86.94% |
30.53% |
33.73% |
|
Intuit (INTU) |
82.10% |
20.25% |
25.74% |
|
NCR Voyix (VYX) |
26.66% |
1.83% |
9.04% |
|
Workday (WDAY) |
72.01% |
-6.88% |
27.58% |
|
Dassault Systèmes (OTCPK:DASTY) |
83.87% |
14.97% |
26.08% |
|
Roper Technologies (ROP) |
65.58% |
33.72% |
29.19% |
|
Synopsys (SNPS) |
80.02% |
18.39% |
23.03% |
|
Autodesk (ADSK) |
91.32% |
14.04% |
28.90% |
|
Open Text (OTEX) |
74.94% |
8.58% |
30.05% |
|
Zoom Video Communications (ZM) |
75.46% |
14.35% |
34.65% |
|
Splunk (SPLK) |
77.37% |
-25.76% |
20.16% |
|
Cadence Design Systems (CDNS) |
88.91% |
26.78% |
25.99% |
|
Atlassian (TEAM) |
83.10% |
-27.27% |
38.06% |
|
Average |
75.58% |
9.72% |
27.16% |
Source: Seeking Alpha, Khaveen Investments
In comparison to the industry average over the past five years, Intuit has performed exceptionally well in terms of profit margin, net income margin, and FCF margin. The company’s gross profit margin of 82.10% exceeds the industry average by 6.52%. Regarding net income margin, the company outperforms the industry’s average by 10.53%, indicating an efficient business model that leads to strong profitability. Additionally, considering Intuit’s market share and branding, Intuit QuickBooks is a leader in the global accounting software market, with a significant 24.5% market share globally and 80% market share in the US, based on our previous analysis. In the tax preparation market as well, Intuit maintains its dominance, with a market share of more than 70% in 2021. The company’s FCF margin (25.74%) is slightly below the industry’s average of 27.16% but still reflects the company’s capability to generate strong FCFs.
Company Data, Khaveen Investments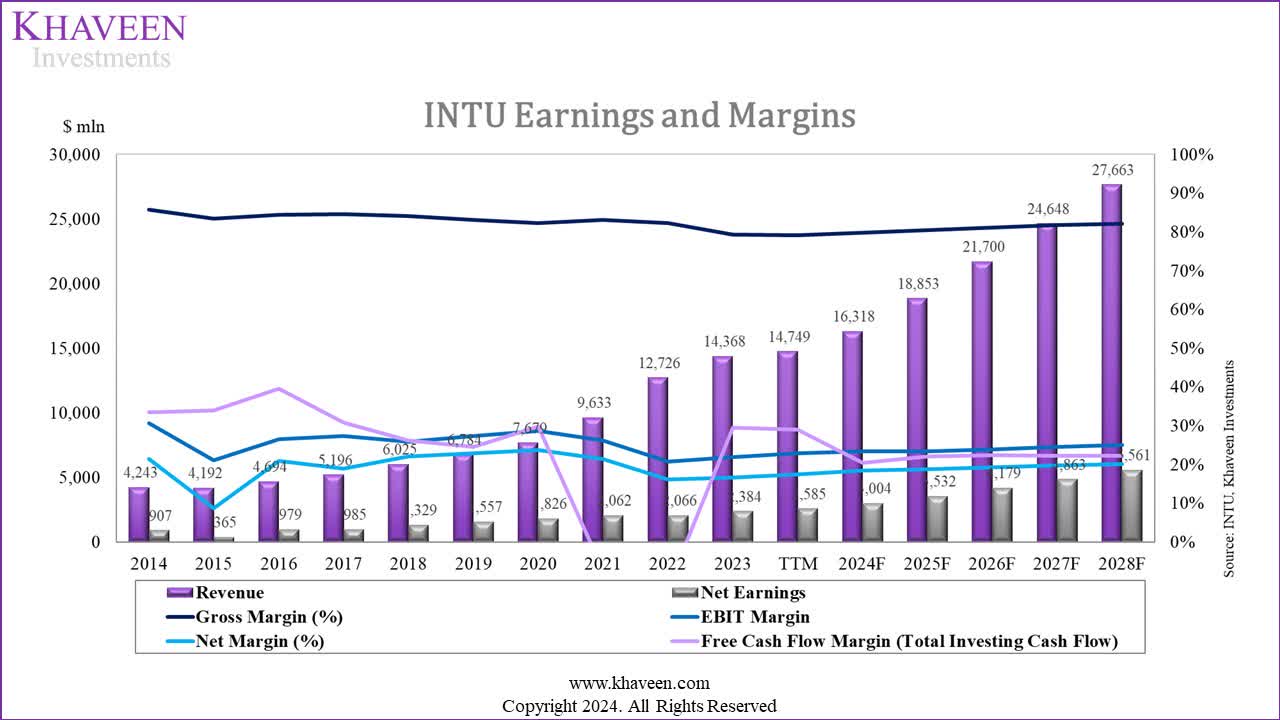
We believe the company will continue to maintain its superior profit margins compared to the overall industry due to its long-standing dominance in the accounting and tax software market as it has a global market share of 24.5% (accounting software) and over 70% (tax software), which we believe could be sustained through the highlighted continuous improvement in its product offerings through innovation of new features such as TurboTax Live and Intuit Assist, and AI-powered assistant as mentioned in the points before.
Looking at Intuit’s Earnings and Margins, its Net Margin and Gross Margin have been stable over the past ten years, with a slight improvement in net margin in TTM. Regarding SG&A and other expenses, there was a significant increase in 2021 and 2022 due to costs related to its acquisitions of Mailchimp and Credit Karma, leading to a lower net margin and FCF margin. However, with a strong dominance in both the accounting software and tax preparation markets, we believe that Intuit’s earnings and margins are to remain stable moving forward, as also reflected in our forecast.
Risk: FTC Restricts Intuit’s ‘Free’ Service Advertising
On Jan 22, 2024, the US Federal Trade Commission (FTC) ordered Intuit to stop advertising its TurboTax services as “free” without clear qualification. The FTC accused TurboTax of being free for a selected group of users, while the remaining two-thirds of its users were deceived and charged for using the service. Thus, we believe the ongoing issues could affect its brand perception.
Verdict
Khaveen Investments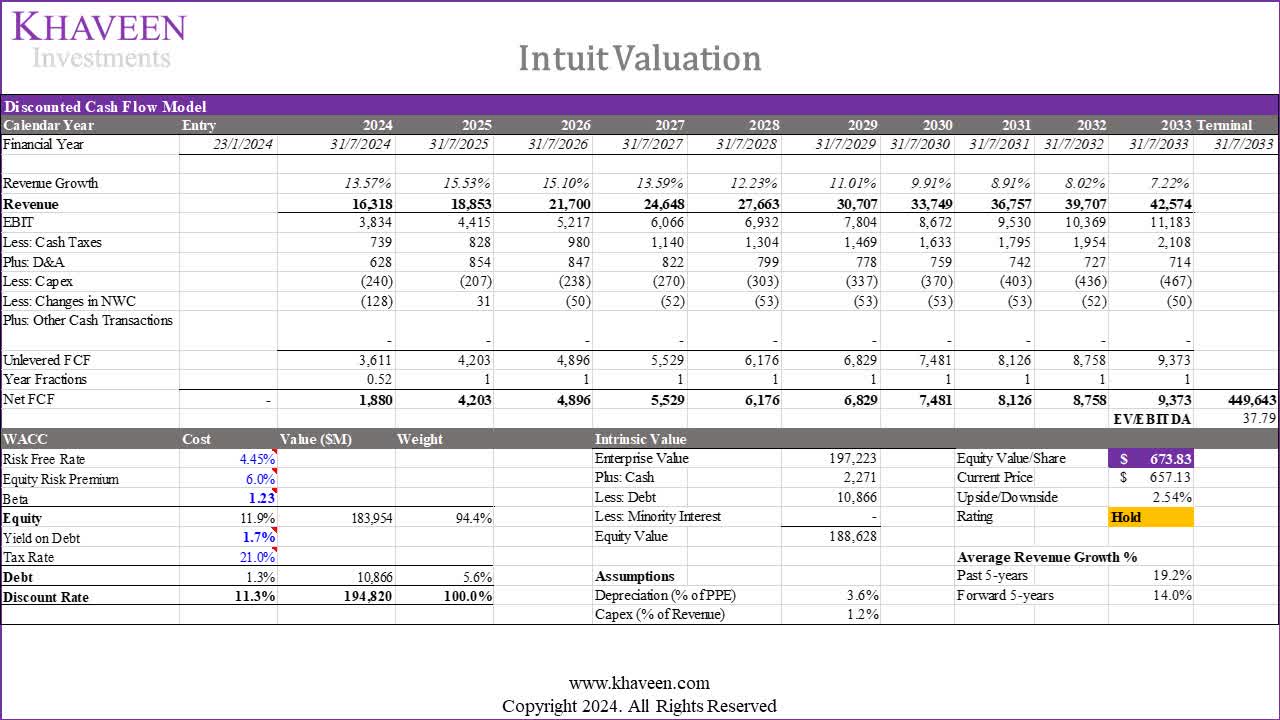
In conclusion, our analysis affirms Intuit’s classification as a software company rather than a fintech company. We delved into the factors steering Intuit’s growth in accounting and tax software, emphasizing digitalization and innovation. Our projections suggest robust growth in the Small Business & Self-Employed (SBO) segment, anticipating a 2024F revenue surge of 18.5%, while consumer tax revenue is forecasted to grow by 12.8%. We anticipate Intuit’s continued expansion through the attraction of new customers and the introduction of innovative product features across both segments. With a history of impressive profitability, Intuit has consistently outperformed the market in gross and net margins. We foresee the company’s margins remaining stable in the future, underscoring its enduring dominance in the accounting and tax software markets.
As Intuit reports its earnings on 22 February, we believe the performance Small Business & Self-Employed as its key segment (56% of revenue) should be focused on in terms of revenue growth YoY in particular and whether it is in line with our forecasted segment growth of 18.5% for 2024 as we see its highest growth segment and an important contributor to the company’s overall revenue growth. We also expect Investors to be interested in management commentary for the Small Business & Self-Employed segment performance and look for indications for higher ARPU growth with its introduction of new AI features.
Based on a discount rate of 11.3% (company’s WACC) and terminal value based on an EV/EBITDA of the company’s 5-year average (37.8x), our model shows its shares are fairly valued. Overall, we downgrade the company to a Hold, despite a 10% higher price target of $673.83 vs $610.69 previously, as the company’s stock price has risen by 60% since our last coverage.

 Q2 2024 Earnings Call Transcript")

