Klaus Vedfelt
“If you put the federal government in charge of the Sahara Desert, in 5 years there’d be a shortage of sand.” – Milton Friedman
My View Of Wall Street
As goes the consumer, so goes the US economy. As Wall Street knows, the importance of the consumer cannot be overstated. That’s because consumer spending is the main engine of growth, representing ~70% of US economic activity-nearly 10% more of the economy than it did in the early 1980s. That is why there is so much focus on what the consumer will do next. Thus far, the consumer has been resilient-supported by a strong job market, excess pandemic savings, and solid wage gains.
However, as reported earlier, some cracks have started to surface. Today, we’ll discuss many factors impacting the consumer and highlight the more challenging areas.
The Negatives
Consumer Confidence Is Awful
Consumer confidence has been highlighted here for quite some time-economists who expected confidence to pick up after COVID have been disappointed. Any flicker of a pickup has been celebrated by those trying to spin the situation, but the numbers do not lie. The onset of higher energy costs and goods inflation in the last two years has doused any hope of a pickup in sentiment. The reports show that confidence isn’t anywhere near pre-pandemic levels. Instead, it’s at historic lows.
The unexpected 10-point plunge in the latest University of Michigan’s consumer sentiment survey-its most significant monthly drop since August 2021-confirms that optimism is actually deteriorating. While spending has been resilient despite subdued confidence up to this point, further weakness will likely cause consumers to pull back spending.
Rising Delinquencies Pose A Risk
Financially strapped consumers are starting to fall behind on their payments. A recent NY Fed article cited that nearly 1 in 5 borrowers are now “maxed out” on credit cards. The percentage of balances transitioning into serious delinquency (i.e., 90 days late) has climbed to the highest level since 2011. While this is typically a worrisome sign for an economy powered by consumer spending, the total outstanding debt at some stage of delinquency (~3.3%) is still quite low.
Consumers Are Becoming More Cautious
While one of the key themes we heard through the 1Q24 earnings season was that consumer spending, in the aggregate, remains healthy, there were plenty of warnings that consumers (particularly those on the lower end of the income scale) are starting to pull back on spending. Not only was this confirmed in the recent softer-than-expected retail sales report, but it was also on full display in this quarter’s company earnings reports.
For example, Amazon and Pepsi reported that consumers are beginning to trade down to cheaper options. With restaurant activity declining for four consecutive months, select restaurants like McDonald’s and Jack in the Box have had to roll out more value offerings to lure back customers. This dynamic is expected to persist and lead to further moderation in spending in the months ahead.
These statistics tell us that today’s economy comprises two sets of consumers. Inflation pressure and higher rates affect some, while others are much less affected. That makes it difficult to forecast how much of an economic impact we can expect.
The Positives
Some Good news – Consumer Balance Sheets Are In Good Shape
Household balance sheets are in good shape thanks to the surging stock market, rising home values, and higher interest rates on savings accounts. In fact, at the end of 4Q23, household net worth (i.e., assets minus liabilities) climbed to a record $156.2T-an increase of 8% from 2022 and a 33% increase since 2019. This wealth effect has been a powerful driver of consumer spending in recent years and a key factor behind the economy’s resilience. And with the S&P 500 hitting 23 new record highs this year, the upper-end consumer will likely benefit and continue to spend, cushioning any weakness from lower-end consumers.
Remember, the top 20% of earners drive 40% of total spending.
Record Levels Of Debt, But Still Manageable Servicing Costs
Household debt climbed to a record high of $17.7T in 1Q24. Soaring borrowing costs on everything from mortgage rates to credit cards and auto loans have raised concerns that debt servicing costs could explode. But while debt servicing costs have risen, they remain manageable.
Case in point: the household debt servicing ratio, a measure of debt-servicing payments as a percentage of disposable income (9.8%), remains well below its long-term average of 11.1%.
Household Debt service (www.federalreserve.gov/releases/housedebt/default.htm)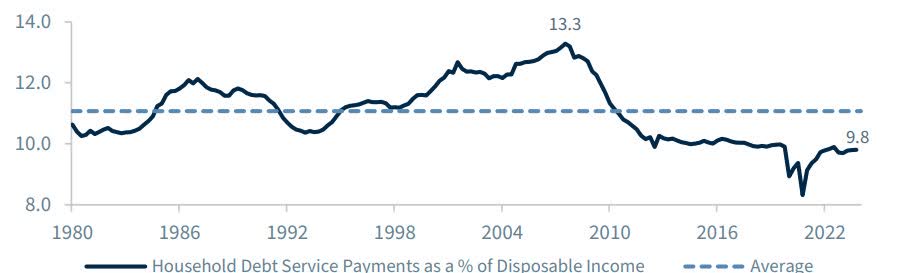
Consumers have been less interest rate sensitive because 60% do not hold any credit card debt, 75% of homeowners have a 4% or lower mortgage rate (well below the current ~7% rate), and 40% own their home outright.
A Question Mark – Rising Real Income Should Support Spending
Real wage gains have been another positive trend supporting consumption and propelling the economy forward over the last year. Strong labor markets and a powerful disinflationary trend have driven higher real incomes over the last twelve months. Some are concerned that this favorable trend may stall as the labor market cools and inflation remains sticky.
However, the soft landing crowd anticipates disinflation to resume and the labor market to ease but remain solid, with minimal job losses relative to past downturns. So, this remains unresolved.
The Bottom Line
Although pockets of concern have emerged, most economists expect only a modest pullback in consumer spending in the months ahead. The slowdown will most likely be driven by the lower-end consumer, who is more acutely feeling the pain of the Fed’s restrictive policy and lingering impacts from inflation. However, modest job growth, rising real wages, and record net worth should keep upper-income consumers spending, cushioning any weakness from financially strapped consumers.
This is a key reason why 2024 consensus estimates for growth have climbed from 1.2% at the start of the year to 2.2% today. The flip side of that argument is simple, and the answer to this next question holds the key.
Can inflation break before the economy breaks?
The BEARS can make a solid case that the economy will falter before the 2% inflation target is met. The BULLS say not so fast; there is plenty of evidence that the many inflation issues are ready to slow.
I’m in the show-me camp on the latter because no one can answer the embedded part of inflation that still impacts the scene. The poor consumer sentiment surveys add confidence to my view.
Week On Wall Street
In an unusual surge, the S&P rallied 0.90% in the final half-hour of trading to close the prior week’s Friday session (index re-balancing?). The S&P saw some buying follow-through as trading opened this week, but all of the gains evaporated by mid-morning. The index erased intraday losses late in the session to finish up 5 points. The Nasdaq also increased, while the Dow and small-cap Russell 2,000 dropped 0.3% and 0.5%, respectively.
Stocks were trading lower for most of the session on Tuesday, but the S&P 500 rallied throughout the afternoon to close up by 0.15%. The Nasdaq was up similarly, while the Russell 2,000 massively underperformed, falling 1.25%. Breadth was mixed. With 10-year yields dropping 4.33% (lowest since April 4th), Real Estate (XLRE) posted a solid 1.2% gain. A “money-rotating mixed session” saw select healthcare stocks also rally. Seven of the eleven sectors finished in the green, with Energy (XLE) again being the weakest link, losing another 1.1%. With the chase to own NVDA before the split this week, NVDA set another new high, but interestingly, the semiconductor index fell 0.78%. Crosscurrents creating indecision continue.
The S&P was searching for direction for about a week, and that quest ended on Wednesday with another thrust higher, sending the index to its 26th new closing high at 5354. Small caps bounced back with a 1.46% gain in the Russell 2,000, and the Nasdaq jumped close to 2% on Tech strength. Given this, the sector that performed the most was tech, with a 2.68% increase, while Communication services (XLC) and Industrials (XLI) also gained over 1%. It was risk-on as defensives took a hit with Utilities (XLU), Consumer Staples (XLP), and Real Estate (XLRE) all falling. Besides the AI catalyst, The 10-year yield broke support and dipped to 4.28%.
After the run to new highs, the indices took a breather on Thursday. The S&P 500 changed slightly on the day, down 1 point at the close. Under the surface, there was a greater variety of moves. The Consumer Discretionary sector was the top performer, gaining under 1%. Meanwhile, Utilities fell 1%. The Russell 2,000 underperformed with a 0.7% decline. Silver posted a solid gain of 4.4% in commodity markets, while copper was solidly at 1.42%. Those calling for the demise of Crude oil will have to wait a little longer as WTI rebounded, climbing 2% to settle at $75.59. Like the S&P, Treasury yields were flat during the session.
The week ended with the S&P 500 trading in a narrow 44-point trading range. The index closed just below the last new high, posting its 6th weekly gain in the last seven weeks. The DJIA and NASDAQ Composite also posted a weekly gain, while the divergence seen in the small caps (IWM) remained, with that index posting a loss for the week.
The Economy
Labor Market
JOLTS: job openings slumped another 296k in April to 8,059k, following the 458k plunge to 8,355k in March. This is the lightest level since February 2021. There are about 1.2 jobs available per unemployed job seeker, down slightly from the 1.4 that generally prevailed in 2023.
The important quit rate was steady at 2.2% for six months. However, it has been the lowest since September 2020 and is off of the 3.0% all-time high from November 2021. The hire rate remained at 3.6% (March was 3.5%). This report suggests further cooling in the job market.
Nonfarm payroll growth bounced back strongly in May, rising 272K relative to the 165K pace registered in April. Job growth over the past year has been concentrated in industries that are less cyclically sensitive, and this was once again true in May, with employment growth led by health care (+84K), government (+43K), and leisure and hospitality (+42K). Average hourly earnings also topped expectations, rising 0.4% in the month and 4.1% over the past year, suggesting wage inflation is still on the scene.
However, the separate household survey was more underwhelming. A 408K decline in employment as measured by the household survey, when paired with a 250K drop in the labor force, pushed the unemployment rate up to 4.0%, its highest reading since January 2022.
It’s no wonder there is so much debate over the state of the economy. This job report is filled with contradictions that leave the average investor wondering what is real and what is made up. The Household Survey is aligned more with the other reported economic data and filled with red flags. That leaves economists questioning what is considered the official payroll growth information.
Manufacturing
The S&P Global US Manufacturing Purchasing Managers’ Index rose to 51.3 in May, following the 50.0 no-change mark in April. The reading signaled a modest improvement in the health of the manufacturing sector, the fourth in the past five months.
US Manufacturing PMI (www.pmi.spglobal.com/Public/Release/PressReleases?language=en)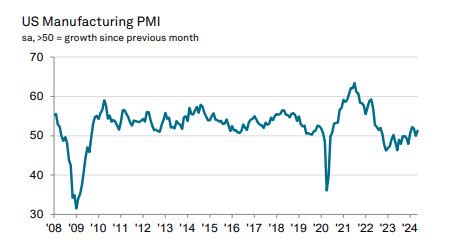
However, the ISM manufacturing survey paints a different picture of contracting for the second consecutive month and the 18th in the last 19 months. The Manufacturing PMI registered 48.7 percent in May, down 0.5 percentage point from the 49.2 percent recorded in April.
ISM Manufacturing (www.ismworld.org/)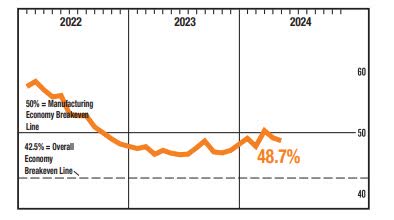
The U.S. construction spending report beat estimates via big upward revisions, though analysts saw a -0.1% drop in April. The upward revisions followed two months of rare downward bumps. Analysts saw big Q1 boosts for nonresidential construction and smaller Q1 hikes for public construction, new residential construction, and home improvement.
Services
The seasonally adjusted S&P Global US Services PMI Business Activity Index rose to a one-year high of 54.8 in May, up sharply from 51.3 in April. The index pointed to a marked expansion of services activity during the month. Output has now increased in each of the past 16 months.
US Services PMI (www.pmi.spglobal.com/Public/Release/PressReleases?language=en)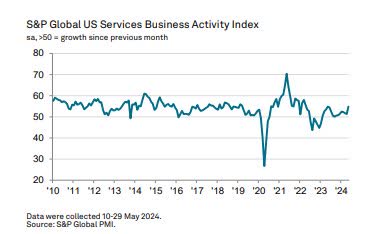
Global Economy
The ECB announced that it would reduce its key interest rate to 3.75% from 4%, its first rate cut in almost five years. The bank said that future interest-rate decisions will be based on incoming economic data.
“The Governing Council is not pre-committing to a particular rate path.”
This is the third major central bank to cut rates, following Switzerland and Canada. Reviewing the other remarks from the press release, we can see that there doesn’t seem to be a lot of conviction behind this move.
“Domestic price pressures remain strong as wage growth is elevated, and inflation is likely to stay above target well into next year.”
“The Governing Council is determined to ensure that inflation returns to its 2% medium-term target in a timely manner. It will keep policy rates sufficiently restrictive for as long as necessary to achieve this aim.”
This is the most “hawkish” rate cut in history, and regarding inflation, it has all of the earmarks of a mistake.
Global Manufacturing Data
Global activity data released monthly by S&P Global was updated last night with releases to “Flash” gauges across 23 economies. Activity broadly accelerated across Europe, with sequential advances and year-plus highs for a range of countries.
Asis-Pacific gauges were broadly higher but decelerated slightly compared to April. While China’s official sector gauges were sharply weaker in April, it was the opposite story in May, with a sequential pickup to the highest levels since May of 2021.
In the Eurozone, while manufacturing activity broadly continues to decline, almost all indicators have improved and hit their best levels at some point, including a 14-month high for the headline index.
Manufacturing PMIs (www.bespokepremium.com)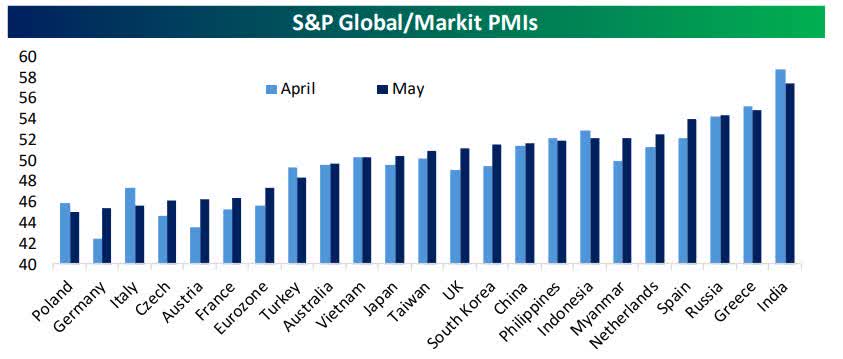
Global Services Data
China
The most notable result from S&P Global’s Purchasing Manager Index data last night was China, where the non-manufacturing (services) gauge reported its strongest reading since May of 2023.
China Services PMI (www.bespokepremium.com)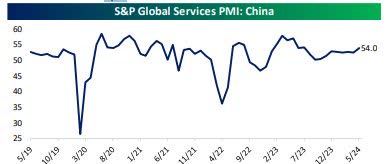
Prices even picked up due to strong demand, which, in turn, sent confidence in the outlook to a 7-month low. As for the rest of the global economy, services activity broadly decelerated but at a very gentle pace, with most readings down sequentially but only by a very small amount versus April.
India
The seasonally adjusted HSBC India Services Business Activity Index remained comfortably above the neutral mark of 50.0 in May, highlighting a sharp upturn in output. That said, the headline figure fell from 60.8 in April to 60.2.
Japan
At 53.8 in May, down from 54.3 in April, the headline au Jibun Bank Japan Services Business Activity Index signaled a robust expansion rate, albeit slightly softer. Rising business activity has been recorded in each month since September 2022. Sub-sector data signaled that the strongest growth was in information and communication, finance, and insurance.
Eurozone
Composite PMI Output Index at 52.2 (Apr: 51.7). 12-month high.
Services PMI Business Activity Index at 53.2 (Apr: 53.3). 2-month low.
Business confidence at 27-month high; inflation rates cool but remain above pre-pandemic averages
The UK
The seasonally adjusted S&P Global UK Services PMI Business Activity Index recorded above the 50.0 no-change mark in May for a seventh month in succession, signaling a sustained expansion in output across the UK’s services economy. However, the headline measure from the survey fell to 52.9, from April’s 11-month high of 55.0, indicating a softer expansion rate.
Global Services PMI (www.bespokepremium.com)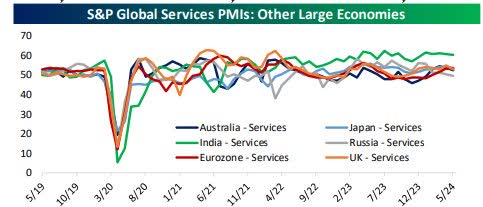
Global Energy
OPEC Extends Production Cuts into 2025.
Two sets of “voluntary” cuts by some (eight top producers) group members – separate from formal production policy – have been extended. The first, which amounts to 1.66mn b/d, was originally agreed in the first half of 2023 and had been set to run until the end of 2024. It will now be in place until the end of 2025.
The second collection of voluntary cuts, amounting to 2.2mn b/d, was announced between June and November last year and was due to run until the end of this month. These will now be prolonged for another three months until the end of September, after which they will be phased out in stages over 12 months.
While this move will keep prices elevated, the initial reaction was to sell the news as WTI fell below support at $74.12. Unless we get a quick reflex rebound, we may have opened the door for a move to the $69-$70 range.
Macroeconomic Issues
This section presents a series of issues that may not necessarily impact the market today but can pose problems for the MACRO scene.
Energy Costs
Policies have consequences – some good, some bad. California is the poster child for BAD choices. In the case of gasoline prices in California and neighboring states (Nevada and Arizona), costly mistakes have been made, impacting consumers. High taxes (bad policy (#1) are partly to blame, but that is exacerbated by California’s special climate control gasoline blend requirements (bad policy #2).
The Average retail gas price in the US has increased to $3.59/gallon, while California’s price/gallon is 44% higher at $5.20. While it may make some happy to claim carbon reduction, that’s debatable. Studies show California’s national parks have the same air quality as Los Angeles.
We do know that it’s doubtful anyone can claim that the added refining costs that cost the West Coast consumer 44% more to operate their vehicles will add to economic growth. If the goal is to drive everyone to Electric, that is set to fail miserably. EVs aren’t the answer because, among other issues, California’s public electric vehicle (EV) charging stations are grossly inadequate, with some studies reporting that they are unreliable 20-30% of the time.
The charging infrastructure is the same across the US, but at least other states haven’t adopted a policy that raises gas prices 44% higher than they should be.
Policy errors have consequences, and some policies are head-scratchers.
The Administration Taps Northeast Gas Reserve in a Move to Curb Prices at the Pump
In 2023, the U.S. used approximately 8.94 million barrels of gasoline daily, and releasing one million barrels amounts to only about 2.7 hours of total consumption.
A “Capital” Waste
The US has spent billions on the “energy” transition. My criticism has been and will continue to be that NO material results have been produced. Enter the EV portion of this transition, and the money spent on the lack of progress is alarming. The Washington Post reports that a $7.5 billion investment in EV charging has only produced seven stations in two years.
The “spin” on EVs continues, but the facts confirm my views. Not only is this a lesson in money mismanagement, but it is also a complete and total failure that will take YEARS to correct and complete. Mandates can continue to be made, but they are no more than pipe dreams. This COST has already impacted the debt situation, and continuing on this path will produce a severe problem for the entire economy.
Only a policy change will avoid that eventuality.
Tax, Tax, and more Tax.
Ever wonder why states were so enthusiastic about legalizing sports gambling? The answer is simple: the need to get a piece of the action to bolster state balance sheets that are in shambles.
Illinois faces an 891 million deficit in 2025, so it proposed a progressive tax to triple the tax rate (up to 40%) on successful gambling operators.
Stocks like DraftKings (DKNG) took a hit on the news. Other states may follow suit. Perhaps not to the degree of the Illinois extortion, but rest assured taxes on these gambling entities will rise.
The Daily chart of the S&P 500 (SPY)
Another solid week for the S&P 500, its sixth weekly gain in the last seven weeks.
S&P 500 (www.freestockcharts.com)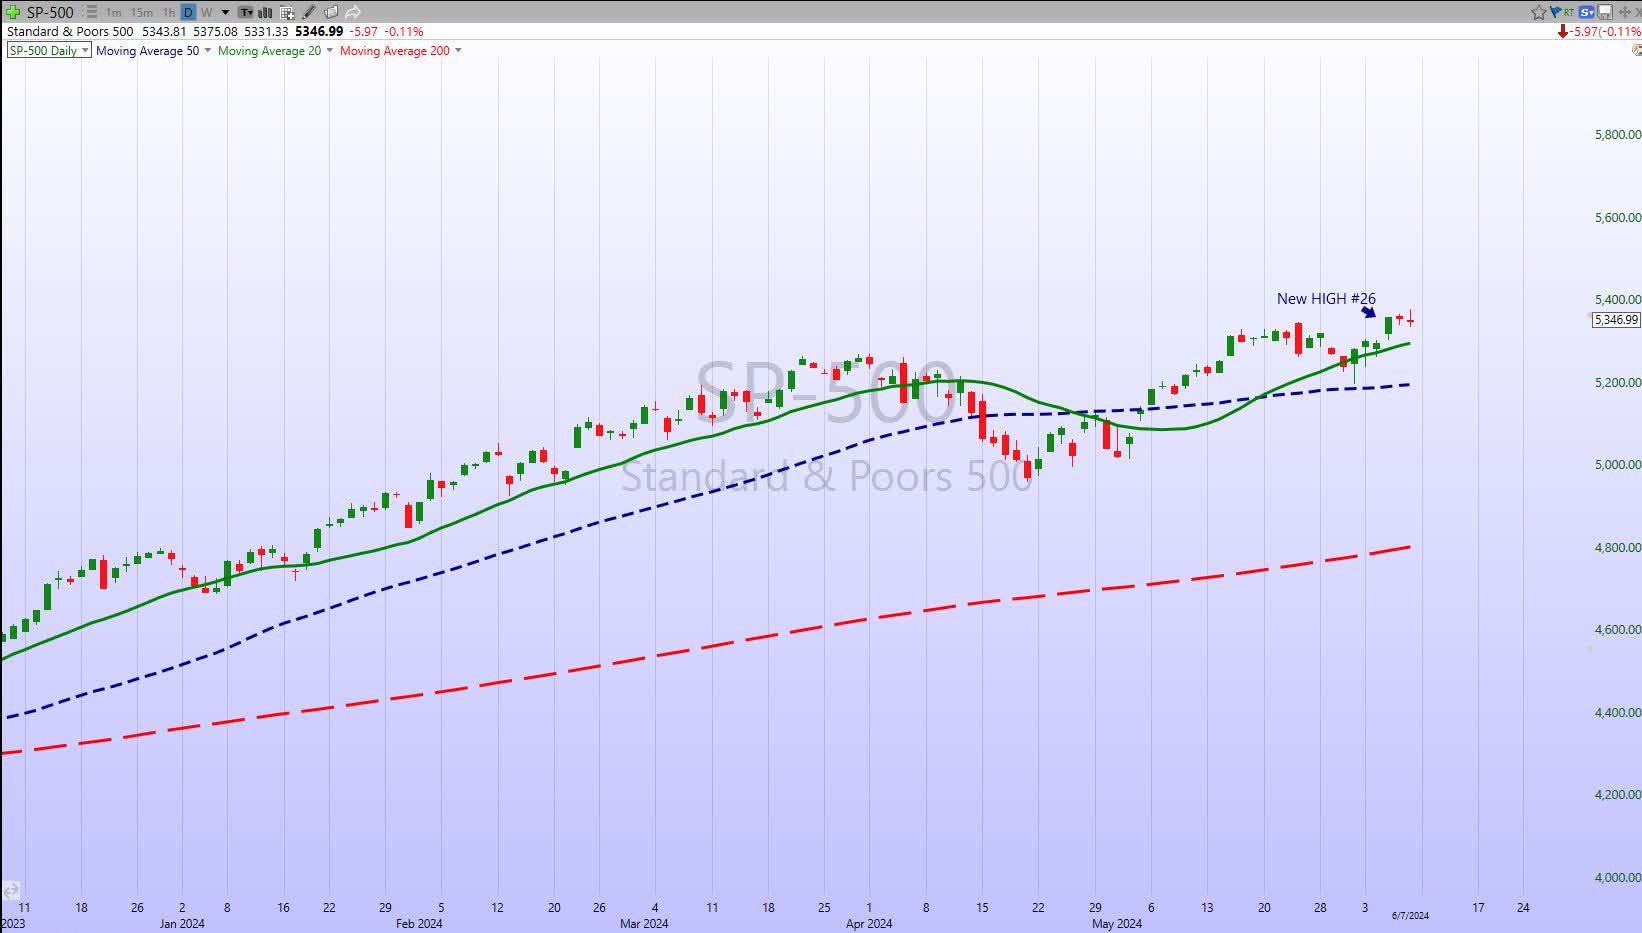
New highs beget new highs (#26), the year’s trend. With the S&P closing at 5346, there is no overhead resistance of consequence. First support comes in at 5290, followed by excellent support at 5190.
Investment Backdrop
June trading kicked off this week, and the table below shows the S&P 500’s historical performance during the month.
June Performance (www.bespokepremium.com)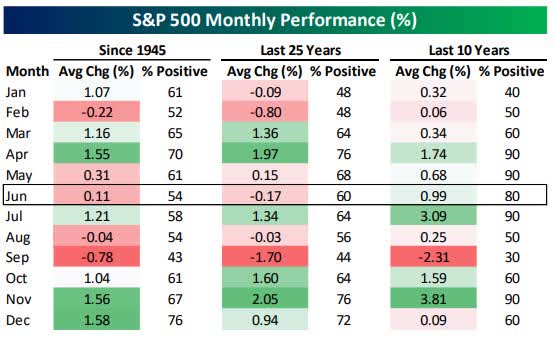
Whether you look at the post-WWII period or just the last 25 years, June ranks as one of the weaker months of the year, averaging modest gains or losses depending on which time frame you consider.
Recent price action is now teasing technicians attempting to forecast the short term. In three trading days, investors witnessed the S&P 500 break below initial support (20-day MA) and quickly reclaim that trendline. On Monday, it broke support again, trading down 43 points only to reverse and close with a five-point gain. It was more of the same on Tuesday. The back-and-forth price action indicates that this market is searching for a short-term direction. The S&P and NASDAQ found that direction with a move to new highs on the back of momentum in the “AI trade”.
In recent updates, I’ve highlighted the weakening breadth picture for the S&P 500 and discussed the divergences seen in the market’s internal measurements.
Market Breadth (/www.factset.com/)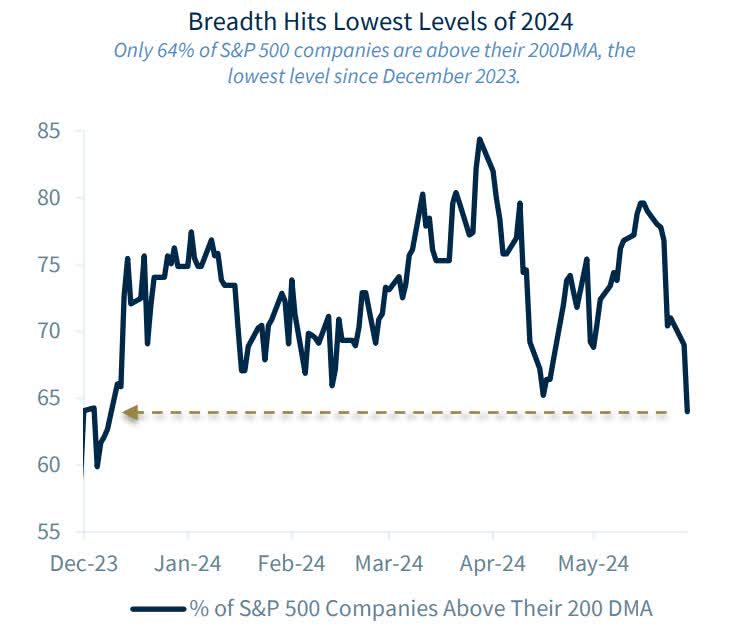
.
This week, the S&P reached a new high on an extremely narrow rally. Strength in NVDA and other mega caps has masked weakness in many other market areas. Small-and mid-cap benchmarks, equal-weight benchmarks, and the Dow Jones Industrial Average all have negative divergences in their internal indicators.
However, narrow breadth and overbought conditions have not mattered. As we have seen with overbought conditions, narrow breadth can also last longer than we might believe. AAPL, MSFT, and NVDA are now valued more than the entire Chinese equity market (excluding Hong Kong), and the three Musketeers represent 20% of the S&P 500 and 27% of the NASDAQ Composite.
The rally’s sustainability will depend on that percentage declining, meaning the number of “other” stocks will have to see their technical patterns increase dramatically and add more value to balance the scales.
The last time breadth was this low (December 23), the S&P went sideways for 2-3 weeks before rallying. Given all the other evidence, the probability of stocks meandering around with a lean to the downside remains HIGH.
I’ve noticed that economically sensitive stocks/sectors are seeing the bulk of any selling pressure. Perhaps a new sentiment is emerging, signaling the economy is getting weaker. That is further evidenced by the 10-year Treasury yield falling back to 4.28% on Thursday before rebounding on Friday.
Once again, this indicates that the entire investment backdrop is a ‘fluid” situation. That doesn’t instill confidence and is another reason I’m not wildly BULLISH.
Long-term investors should remain patient, while traders should follow these strange tea leaves as best they can. Developing a short-term strategy with any conviction behind it is nearly impossible.
THANKS to all the readers who contribute to this forum to make these articles a better experience.
These FREE articles help support the SA platform. They provide information that speaks to Both the MACRO and the short-term situation. With a diverse audience, there is no way for any author to get specific unless they’re simply highlighting ONE stock, ETF, etc. Therefore, detailed analysis, advice, and recommendations are reserved for members of my service offering on the platform.
The information provided here is verified by SA; in most cases, links are provided as supporting documentation. If anyone can point out a comment in any article I put forth and demonstrate that it is factually INCORRECT – I will REMOVE it.
Best of Luck to Everyone!

 Q2 2024 Earnings Call Transcript")

