petrenkod/iStock via Getty Images
What is a buffer ETF?
Essentially, buffer and defined outcome exchange-traded funds (“ETFs”) are a new outcropping of ETFs that seek to offer upside potential, up to a cap, with limited downside exposure versus a particular benchmark. That benchmark is most often the S&P 500.
The first defined outcome, or “buffer” ETFs came out in August 2018 from Innovator. Today, they have approaching $32B in assets under management across the 139 ETFs from nearly a dozen sponsors.
Innovator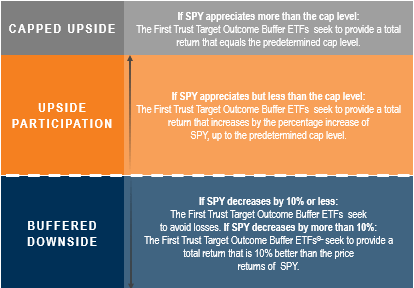
In short, you give up some upside in order to protect against the downside. With the publicly traded buffers, there is no free lunch. The protection has to be paid for.
A quick primer on Buffer ETFs:
These are great tools to more specifically define your outcome in terms of performance and manage risk. Most of the products have worked well- from the companies I’ve studied. The largest players in the space are Innovator Funds LLC and First Trust. They command more than 80% of the assets in the buffer ETF space. A space that is growing VERY rapidly.
An ETF with a 10% buffer means that you, the shareholder, don’t start participating in the losses until the reference asset (S&P 500 most of the time), loses 10% from the ETFs launch date.
That last part is important. It is not from when you purchased the shares but when the ETF was launched. The cap and buffer are reset at the end of each outcome period.
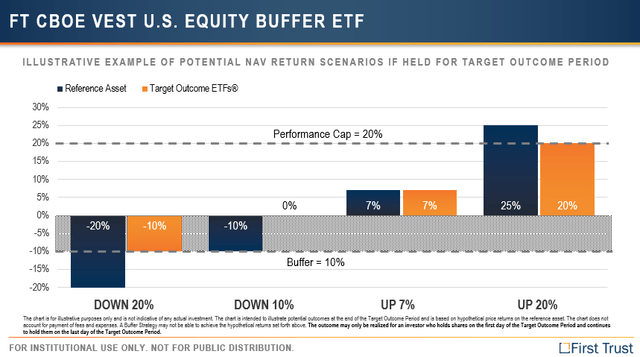
The below table shows one such buffer from First Trust. The reference asset is the S&P 500 and it has a buffer of 10%. You can see how you would do (orange) vs what the S&P 500 does (Blue).
In the case of a 7% rise in the S&P 500, the ETF is up roughly the same (minus expenses). However, if the S&P is up 29% on the year, the ETF is only up 20% because it runs into the cap.
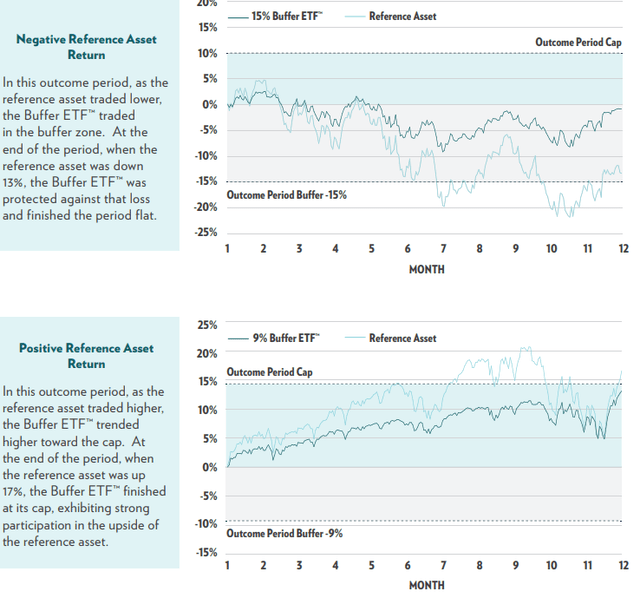
The below is a good illustration of the path and results of the same buffer ETF when the reference asset (S&P 500) is down and when it is up.
Depending on the sponsor and specific ETF, most defined outcome ETFs, including buffer ETFs, have a one-year outcome period. Some, mostly from Innovator, have two-year holding periods but with 100% downside protection.
That must be a consideration when purchasing these. If your reference asset is the S&P 500 and the cap is 8% for two years, then at most, you will earn 3.93% annualized. You better have a lot of downside protection to give up that much potential upside!
Those types of situations are uncommon. Most of the equity caps are around 14-18% depending on the volatility at the time of launch (more volatility, higher the cap, and vice versa).
For example, here are the buffers, outcome periods, reference assets, and launch months Innovator offers. Most of their funds are 12-month outcome periods but they do offer a 24-month with 100% protection.
So, those particular funds are re-offered on each of those calendar months with a new ‘buffer’ as well as a new cap. The cap isn’t known until a few days before the launch of the ETF.
innovator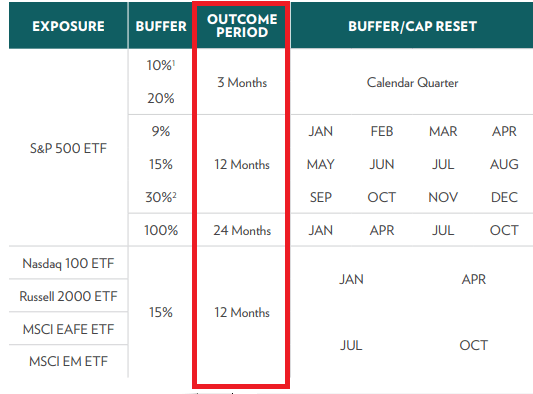
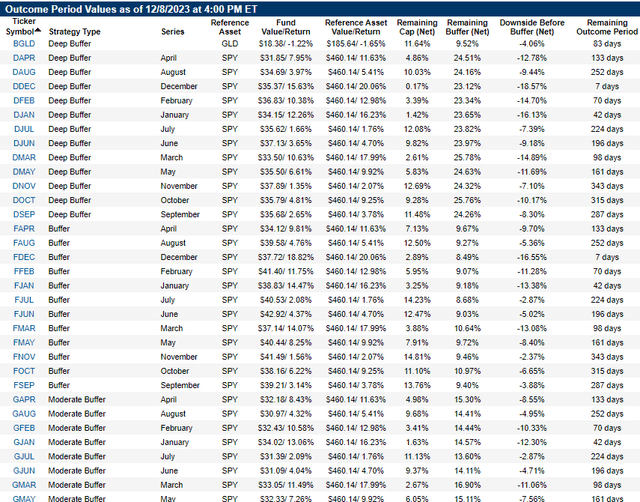
One of the better resources is the First Trust Target Outcome fund list webpage. Here, you can quickly assess each series (which month), the remaining cap, the remaining buffer, and the remaining number of days for the outcome period.
This allows the individual investor the ability to quickly scan and select the fund that offers up the upside/downside and time they need.
Some Thoughts
- Like individual bonds, these are meant to be held until ‘maturity’ (when the outcome period ends). I do NOT consider them trading tools.
- A lot of investors use these to put cash to work. Granted, these days cash earns something decent, but with these you can put it to work for a bit longer with more of a ‘lock’.
- These are good for early retirees who need to protect against a loss early in their retirement. Avoiding that loss when in your late 50s and early 60s, just as you start drawing on your portfolio, is vitally important.
- Short-term horizons. For example, these can be good tools for saving for a particular event, especially when rates move lower. Some people are saving for college or a down-payment on a house and want to earn returns without risking the capital.
- Conservative investors in general are a good candidate for these types of ETFs. While you give up some of the upside, most risk-averse investors are willing to do that in order to protect against the downside.
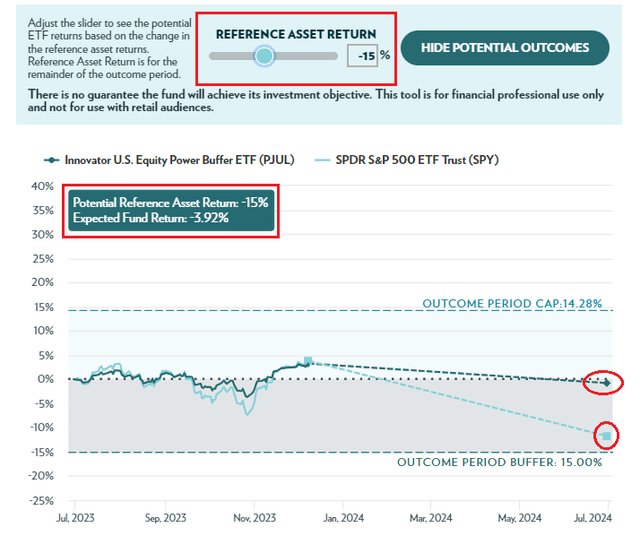
- Play with the “https://seekingalpha.com/article/potential outcomes” charting that Innovator provides. A screenshot of the potential outcomes for (PJUL), the largest buffer ETF in terms of assets, is below. I put the reference asset return slider to -15% and it changes the chart below it to show what the S&P does and what your return will be. PJUL has a 15% buffer (you don’t experience any losses until -15%).
So What’s The Catch?
In most of these products, there is an asymmetrical return trade-off. That just means you can lose more than you gain. For instance, let’s take the 9% buffer from First Trust (FNOV) that has a one-year outcome period and a cap of 14.81%.
The fund has 343 days left since it was launched in November (hence F-NOV) with 9.46% buffer (you don’t start taking losses until the S&P fall 9.46%) but as noted, the cap is 14.81%. If the S&P falls 30% over the next year, you lose about 21%. But you can only make 14.8%. If the S&P were to fall even more, you can lose more, but you still can only ever make the 14.8%.
While the chances of losing more than 10% in a given year are low, it is still possible, especially when starting valuations are as high as they are today. Additionally, most investors focus on the downside protection but fail to appropriately consider the cap or the lack of upside potential.
Markets tend to go up 3 out of every 4 years. Therefore, the shareholders of buffer funds are more likely to ‘lose’ upside than benefit from the downside protection.
A Few Options That I Think You Should Consider:
1) Innovator Defined Wealth Shield ETF (BALT)
This one is fairly unique and is garnering a lot of the dollars flowing into this space. BALT seems to track the return of the S&P 500 but with a QUARTERLY outcome period downside buffer of 20%. In other words, you don’t see losses unless the S&P loses 20% in a quarter.
There have been only four calendar quarters since 1950 where the S&P has fallen by 20% or more. The most recent one being in 2008. That comes out to approximately 4.1% of all quarterly time periods.
The Oct 2023 quarterly cap was set at 2.8% but has historically been around 2.6%. That means you can earn UP TO 2.8% this quarter if the S&P finishes up. With the S&P comfortably up by more than 2.8%, BALT will return 2.8% gross or approximately 2.62% after the 0.69% annual expense ratio (pro-rated over the quarter).
ycharts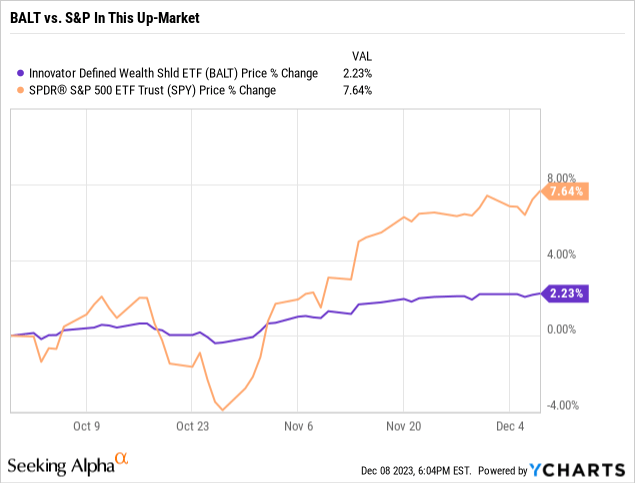
If the market is up about 3% per quarter, then this fund can earn as much as 10.51% in a calendar year if the wind is just right. What I mean by that is the positive returns for the market have to be spread out across the four quarters, so the cap is reached.
2) FT Cboe Vest US Equity Moderate Buffer ETF (GJUL)
This is a moderate buffer, so it will be a bit more aggressive than BALT above or TJUL below. The buffer is 15% meaning you don’t take losses until the S&P falls 15% during the outcome period. It incepted in July, so it has about 224 days left. With the S&P up, all the buffer is available after a 2.87% downside (since the market has moved up since then). The cap is 11.13% so you still have the potential for decent ‘teens’ annualized return (since the holding period will be less than a year 11.13% = ~14.5% annualized return).
3) Innovator Equity Defined Protection ETF (TJUL)
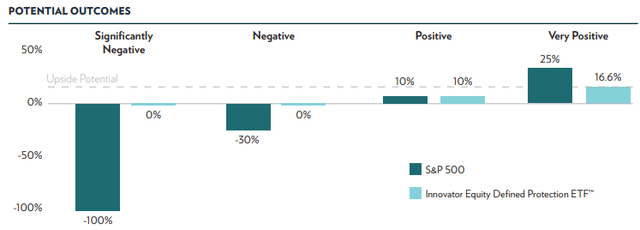
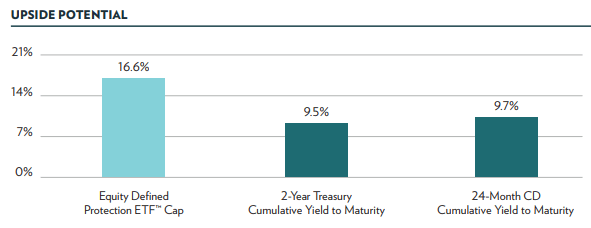
This is another conservative option for investors who are risk-averse or need to avoid losses. It is set up to track the S&P 500 to the cap with 100% downside protection. The most recent cap is 16.62%, but this is a 2-year fund. So at most you can earn is 8.2% annually. For most investors who are risk-averse, 8.2% per year sounds pretty good, with no real downside risk.
Here’s an article on TJUL from the ETF Strategy website.
4) Emerging Markets Buffer (EAPR) – 15% EEM Buffer, April Series: With about quarter left in the outcome period, EAPR is trading slightly below is starting price, allowing for entry point close to day 1 values, with 13.29% left of buffer, and 17.17% remaining cap.
5) Innovator US Equity Buffer (BAUG) – 9% SPY Buffer, August Series – with 233 days left, BAUG is trading just above its starting price, with 8.20% remaining buffer and 16.0% remaining upside cap.
Innovator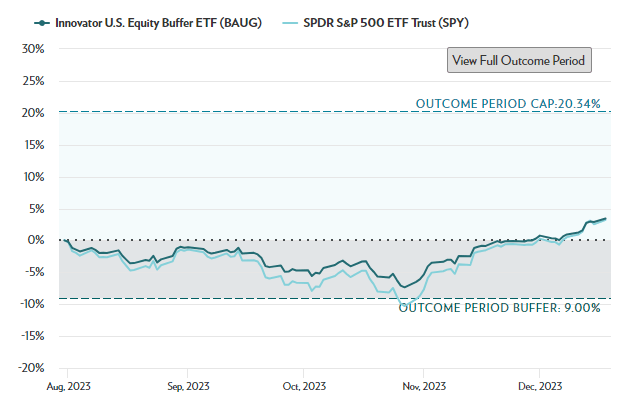
(Alternative) S&P 500 Collar 95-110 ETF (XCLR)
Technically not a true defined outcome ETF, but it will have similar characteristics since the portfolio is hedged with put options. The fund buys 5% out of the money puts, while funding that with the sale of 10% out of the money calls.
In others words, you participate in the first 5% of losses each quarter and have a cap of 10% returns. This is a bit reversed, since buffer ETFs protect against the first dollars of loss.
