Donny DBM/iStock via Getty Images
The Saving Constraint: Living Beyond the National Means
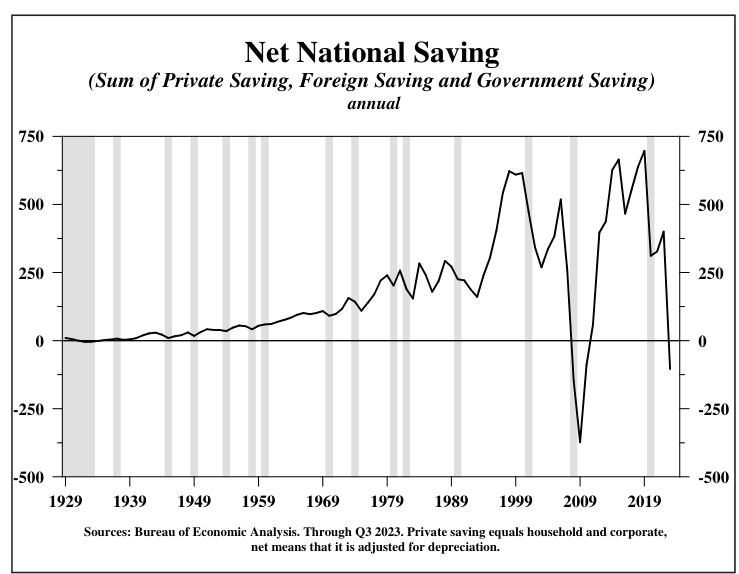
In 2023, the Federal budget deficit exceeded private and foreign saving, resulting in only the eighth year since 1929 with negative net national saving (to be referred to as NNNS). In direct contrast to last year, all the previous NNNS cases took place during extremely severe economic contractions (Chart 1). Four occurred during the Great Depression (1931 through 1934) and the other three occurred during the Great Financial Crisis recession and its immediate aftermath (2008 through 2010). The emergence of NNNS is occurring at a very disadvantageous time for the economy because the Federal Reserve’s actions intended to return inflation to their target are resulting in an increasing number of recessionary signposts in both monetary and cyclical indicators. In addition, the insufficiency of saving strongly suggests the sustained downtrend in the market neutral rate (R*) will prevail well beyond 2024.
Connecting the Production Function and the Circular Flow
The profound consequences of NNNS can be demonstrated by linking two universal concepts in economics – the aggregate production function and the circular flow. The production function states that output is determined by technology and the three factors of production – capital, labor and natural resources. The circular flow means that, in aggregate, an economy’s earnings and spending must be equal, or GDP (gross domestic product) equals GDI (gross domestic income). By algebraic substitution, GDP equals GDI is the same as net national investment (I, or gross physical investment less depreciation) equals net national saving (S, or private saving, foreign saving and government saving, net of depreciation). Investment (I) which equals S is also the increase in the capital stock. Thus, positive net saving, which is a requirement for an increase in the capital stock and a better way of life, by substitution also enters the production function.
Private saving is the sum of household and corporate saving and foreign saving equals the inverse of the current account deficit, which is also the capital account of the international sector. NNNS thus serves as a constraint or special condition that prevents the production function from operating over a full range of conditions. J.M. Keynes “paradox of thrift” – the notion that thrift is a good standard for the individual but not for the economy as a whole – does not apply during periods of NNNS. Without the thrift essential for national saving, resources are insufficient to cover depreciation, and the capital stock, critical for the standard of living, shrinks.
Fiscal policy has tools for promoting saving and investment that could be useful over time, but the subject is not even under consideration and options are contentious and unlikely to be enacted. The Federal Reserve has great flexibility to act but its tools are counterproductive for ending the saving constraint. For instance, increasing money supply growth does not provide additional tangible assets for growing the capital stock but it would accelerate inflation, rendering most households less able to save, enlarging NNNS and further boosting the likelihood of a lower standard of living.
Demographics and Natural Resources
In NNNS periods, achieving increases in real GDP becomes dependent upon changes in demographics or natural resource availability. Today those factors are below trend and are exceedingly slow to shift.
Demographics. Population growth is a factor but the birth rate, household formation and the average age of an economy all matter to economic performance. The latest demographic trends in the U.S. and the other three major economies – the E.U., China and Japan – have all been considerably weaker than the historical and long-run averages. Young and rapidly growing economies with high birthrates and household formation generate a higher demand for goods than slow growing economies with older households and lower birth rates.
The U.S. population grew 0.5% in 2023, which is approximately 42% of the long-term average growth rate. However, the fertility rate for the past two years was the lowest on record and household formation was very low. The demographics are worse in the other three major economies. Population was virtually unchanged in China, the weakest showing since 1949. In Japan, population fell 0.4% and the population in the E.U. expanded 0.6%.
At an average age of 38.9 years, the U.S. is now the oldest it has ever been. The average ages of other major economic powers around the world are increasing at an even faster pace than the U.S., with China at an average age of 40 years, the E.U. at 44.5 and Japan at 49.5.
Natural resources. Mining discoveries have occurred in recent years but, at the same time output from older mines has been depleted. Also, economic growth has reduced land available for agricultural production across the globe. The aggregate production function is unlikely to be effected by the availability of natural resources until raw materials can be retrieved from outer space, a development that is not yet imminent.
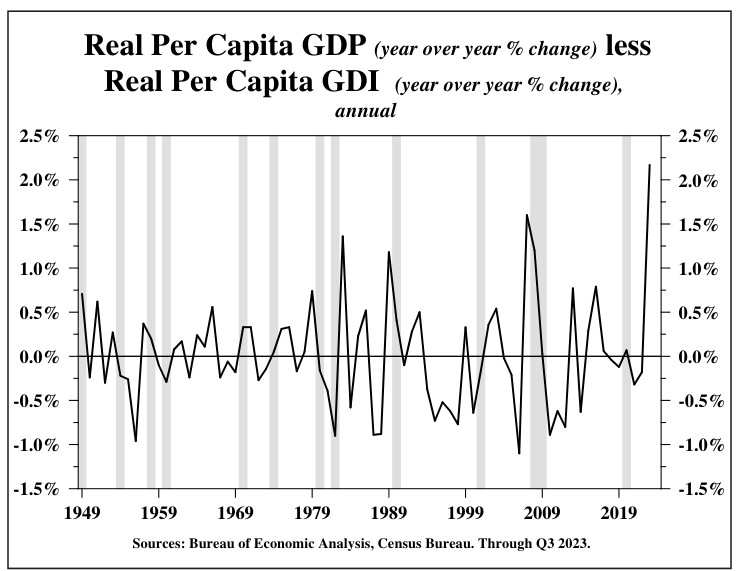
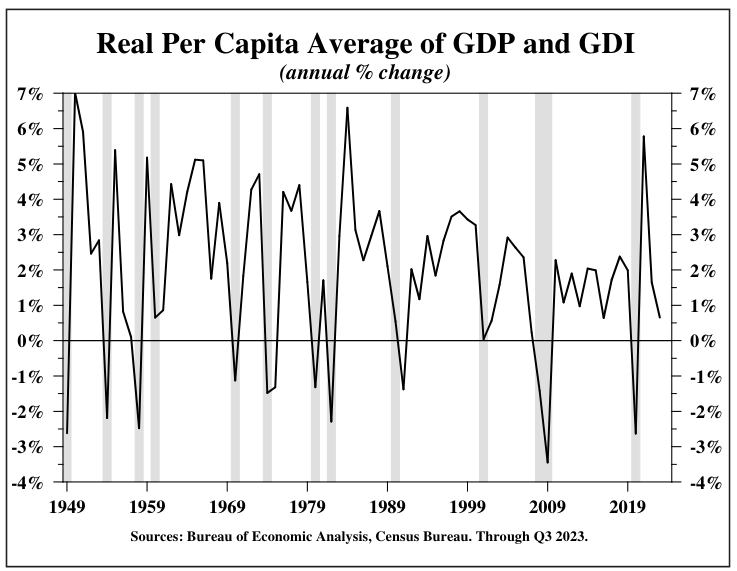
The Standard of Living. The standard of living is either real per capita GDP or real per capita GDI since they are equal measures. On an annual basis through Q3, a record divergence in growth rates of 217 basis points (-0.35 for real per capita GDI versus 1.82 for real per capita GDP) was registered (Chart 2). In such divergent situations the approach of the economic profession is to average the two series. This average grew at just a 0.6% annual rate in the past four quarters (Chart 3), far below the twenty-year average 1.3% per annum and much worse than the post 1970 average of 2.2%.
Under prevailing conditions, the aggregate production function indicates the United States and its major competitors face a prolonged period of subpar economic growth until net national saving turns positive. Indeed, these prospects will likely prompt calls for more deficit spending that will, in turn, serve to worsen NNNS, further impairing resources required for a rising capital stock and, in turn, prohibiting a reversal of this six plus decade decline in the growth of living standards.
Too Little Money, Too Many Goods
ODL and M2. The most basic definition of inflation is too much money chasing too few goods. Now, the opposite is true. The status of supply chains can be debated, but clearly they are considerably better than in 2020 and 2021. Whether or not they have returned to where they were in 2019 is impossible to know. Money does not pose such ambiguity. Our preferred measure of money, real other deposit liabilities (ODL) fell at a record pace last year (data through November), with the two-year rate of decline also a record. Indeed, over the latest three years, real ODL fell at a 4% annual rate, a dramatic undershooting of the long-term trend growth rate of 3% per annum. Real M2 shows a virtually identical pattern. The two-year rate of decline is the greatest since the unwinding of war time conditions in the late 1940s, and the three-year rate of change is negative and far below the historical average.
Consistent with money, all the major measures of inflation recorded unprecedented decreases for an economy in expansion. The latest 12-month change in the headline and core CPI was approximately 570 basis points below and 270 basis points below, respectively, the peaks in 2022 while the drop in the CPI, excluding the problematic shelter component, was in the vicinity of 890 basis points below its peak. The fall in headline CPI inflation in 2022-23 was so massive that it exceeded the full and extended cyclical declines in inflation associated with five of the eight recessions since the late 1950s, excluding the highly abnormal Pandemic recession of 2020.
The irony of the Fed’s explanation for the fall in inflation in 2023 is immense. They make no mention of money, for which they have a constitutional responsibility and which they have great capacity to determine. In 2020 and 2021, the Fed ignored money and did not see the dramatic surge in inflation coming. In 2022 and 2023, although they continued to ignore money, inflation dropped spectacularly faster than the FOMC predicted.
Real bank credit. Bank loans and investments, adjusted for inflation, also shows a contraction similar to that of money. This is highly unusual since bank deposits lead bank assets, with money growth a leading economic indicator and bank credit lagging. Over the latest 12, 24 and 36 month intervals, real bank credit declined by annual rates of 3.8%, 1.8% and 0.9%. In a very extreme development, real commercial and industrial loans (commonly referred to as business loans and a component of the index of lagging economic indicators) fell in 2023, even though the economy expanded.
The real Federal Funds rate. Due to a fall in inflationary expectations, the real Federal funds rate registered a new monthly peak in December, even though the nominal funds rate was last changed in August. Loans tied to SOFR (the Secured Overnight Financing Rate) would also be higher in real terms. Nominal credit card, automobile, and personal loan rates jumped sharply to new peaks in November. Credit card and six-year new auto loan rates reached 21.47% and 8.67%, respectively, as deposit growth continued to contract. In real terms, these key consumer loan rates are substantial and will impair households finances significantly, especially since credit card debt surged dramatically in November.
Increases in the real cost of credit tied to the real federal funds rate are very ill-timed. The Fed’s Beige Book of Regional Economic Conditions released in conjunction with the December meeting of the Federal Open Market Committee indicate that credit demand continued to weaken. The Fed’s Survey of Senior Bank Lending Officers has shown a sharp increase in credit standards. This situation is not likely to change anytime soon since total bankruptcy filings advanced 11.8% and business bankruptcy filings jumped 33.5% in the 12 months ending September 30, 2023. Residential property foreclosures in the fourth quarter advanced 12.8% from a year ago. Consumer loan delinquencies doubled over the latest four quarters according to the Federal Reserve Bank of New York.
Behaving Like a Recession
Over the past year, inflation, real GDI, hours worked of all non-agricultural employees, national saving, delinquencies, foreclosures and bankruptcies portrayed a recessionary environment even though real GDP and payroll employment continued to rise. Key indicators, derived mainly from industry sources rather than the government statistical mill, exhibited characteristics of a hard landing. New vehicle sales, new home and existing home sales, respectively, were 15%, 43% and 42% below their peak levels of the past five years.
Prescient cyclical indicators point to an expanding list of recessionary conditions. Not only did the long running inversion of the yield curve persist through the fourth quarter, but it also became even steeper. A prolonged drop in the index of leading economic indicators was extended. The high multiplier manufacturing sector moved further below its cyclical peak reached last October and the deep drop in world trade volume has never happened without a global recession since the series originated in 1992.
The Neutral Rate (R*) and Inflationary Expectations
The massive 60% drop in the twenty year moving average of real per capita GDP growth from 1970 to the present (Chart 4) is a strong signal that R* has experienced a similar decrease and is now less than 1%.
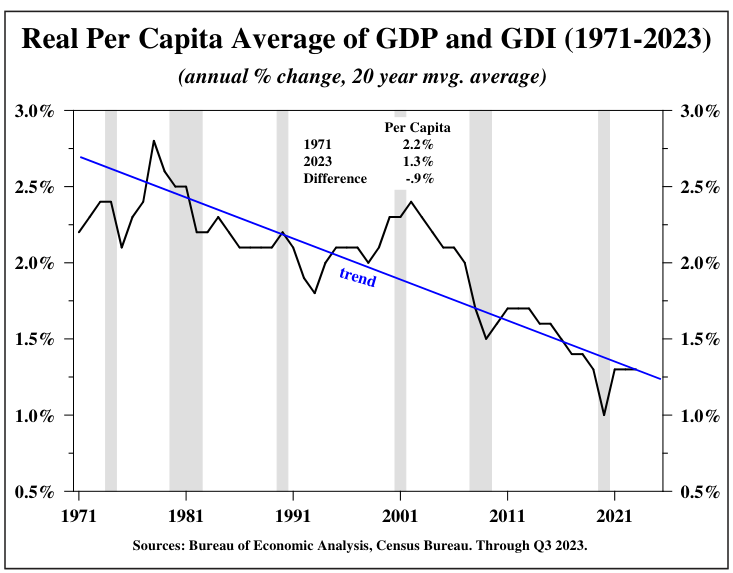
The fluctuation in the twenty-year moving average indicates that substantial volatility occurred around the trend line, which is also shown in Chart 4. The movement of the financial, GDP and price/labor cycles will continue to cause shorter-term fluctuations in R*’s trend as will productivity, risk attitudes, demographics, natural resources and the ability of businesses and households to hedge risks. Factoring in these cyclical and other influences, R* could range from 0.65% to 1.25%, excluding truly extraordinary events like Pandemics or major global supply disruptions. A reversal, however, is unlikely until net national saving reverses powerfully into positive territory, a pathway now even more difficult to achieve due to the proliferation of “buy now, pay later” programs.
With regard to inflationary expectations, the best approach is to stick to basics. History indicates that cutting the Federal funds rate will not provide a quick remedy for the effects of the post 2021 contraction in the real stock of money, even if $1 trillion of very low-cost debt were not to be repriced in 2024. Since this maturing debt was secured when credit ratings were generally much higher, poorer ratings will add to interest costs. Some borrowers may not be able to find financing at all. R* and inflationary expectations suggest the rally in long Treasury bonds will continue through 2024, with the strong prospect for an even longer horizon for this trend.
Hoisington Investment Management
|
DISCLOSURES Hoisington Investment Management Company (HIMCo) is a federally registered investment adviser located in Austin, Texas, and is not affiliated with any parent company. The information in this market commentary is intended for financial professionals, institutional investors, and consultants only. Retail investors or the general public should speak with their financial representative. Information herein has been obtained from sources believed to be reliable, but HIMCo does not warrant its completeness or accuracy; opinions and estimates constitute our judgment as of this date and are subject to change without notice. This memorandum expresses the views of the authors as of the date indicated and such views are subject to change without notice. HIMCo has no duty or obligation to update the information contained herein. This material is intended as market commentary only and should not be used for any other purposes, including making investment decisions. Certain information contained herein concerning economic data is based on or derived from information provided by independent third-party sources. Charts and graphs provided herein are for illustrative purposes only. This memorandum, including the information contained herein, may not be copied, reproduced, republished, or posted in whole or in part, in any form without the prior written consent of HIMCo. ©2024 Hoisington Investment Management Co. |
Editor’s Note: The summary bullets for this article were chosen by Seeking Alpha editors.

 Q2 2024 Earnings Call Transcript")

