Justin Sullivan
Thesis
In my previous article, the most optimistic model for Alphabet, Inc. (NASDAQ:GOOG) (NASDAQ:GOOGL) suggested a fair price of $166.20 and a future price of $269.50, indicating that Alphabet’s upside was too limited to consider it a buy. Consequently, I rated it as a hold. Since then, the stock has risen by 4.09%.
Google recently announced Q4 2023 earnings, therefore I will update my models with the latest financial data and additionally, I will conduct a deeper reevaluation of Google. This time, the most optimistic model has yielded a fair price of around $162.72 and a future price of $275.61. These results continue to suggest that Google’s upside is limited, and significant trend would be necessary for it to grow again (perhaps with the Pixel 8 becoming the new iPhone). Therefore, I am reiterating my hold recommendation.
Seeking Alpha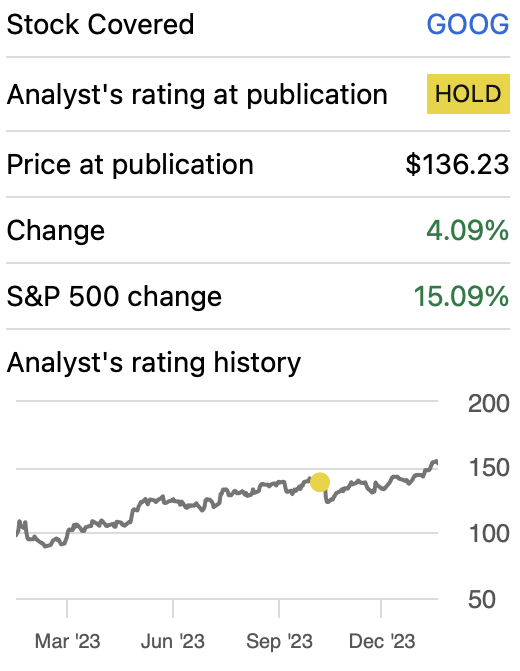
Overview
Segments
Google Search holds paramount importance for Alphabet, contributing approximately 56.9% of its total revenue. Following the search engine, no other segment surpasses the 12% mark. YouTube contributes around 10.25%, Google Network collaborates with approximately 10.18% of the revenues, while Platforms & Devices assist with 11.28%, and Google Cloud brings in 10.76%.
Google FY2023 Annual Report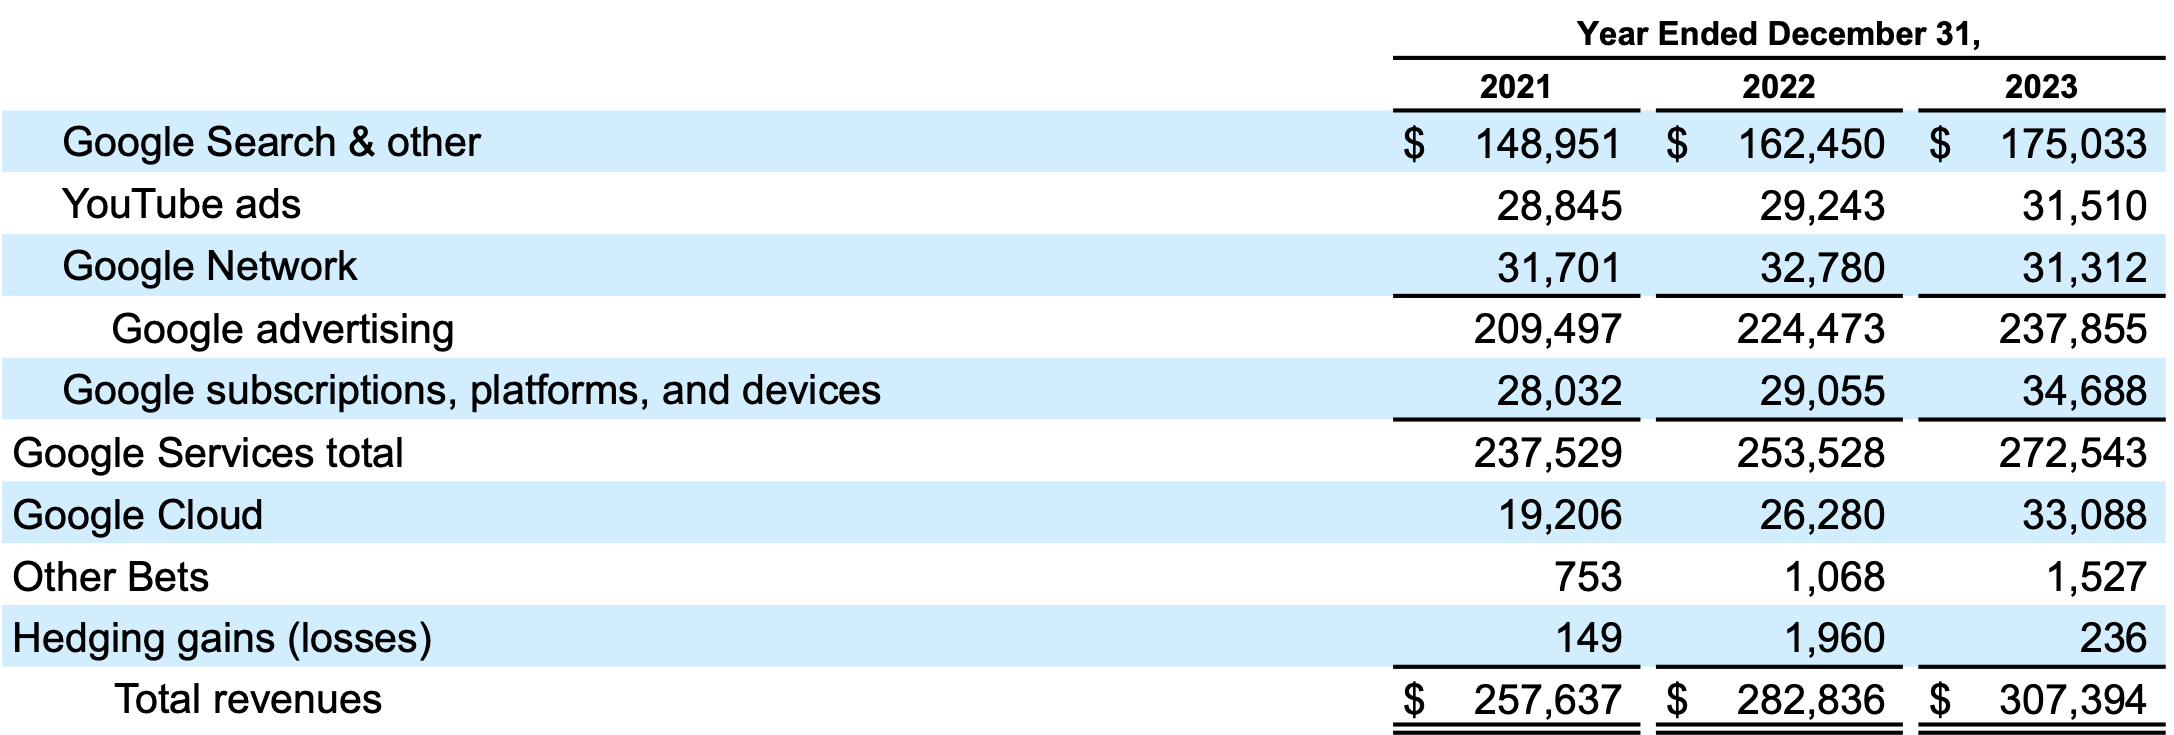
Google Search
In my previous article, I discussed Google search, which held a market share of around 83.40% as of July 2023. However, as of December 2023, Google’s market share has decreased to around 81.71%. This loss has been attributed to Bing, which previously held 9.19% and now holds 10.53%. I will maintain my previous estimate regarding Google search, suggesting that over a five-year period, Google will retain approximately 76.98% of the market.
In October 2018, Google held a market share of approximately 90% in the search engine industry. By July 2023, that share had declined to 83.49%, reflecting a 6.51% decrease over five years, equivalent to an annual 1.3% reduction in market share. If we extrapolate this trend over the five-year period covered in this article, Google’s market share is estimated to be 76.98%.
Nonetheless, 76.98% still represents an effective monopoly in the market. If Google does not take action, it could diminish in its influence over a 30-year period. Let’s remember that what made Google superior to Yahoo was its offering of a better-quality search engine with more results, greater accuracy, and faster response times—attributes that Microsoft Corporation (MSFT) can certainly achieve.
Statcounter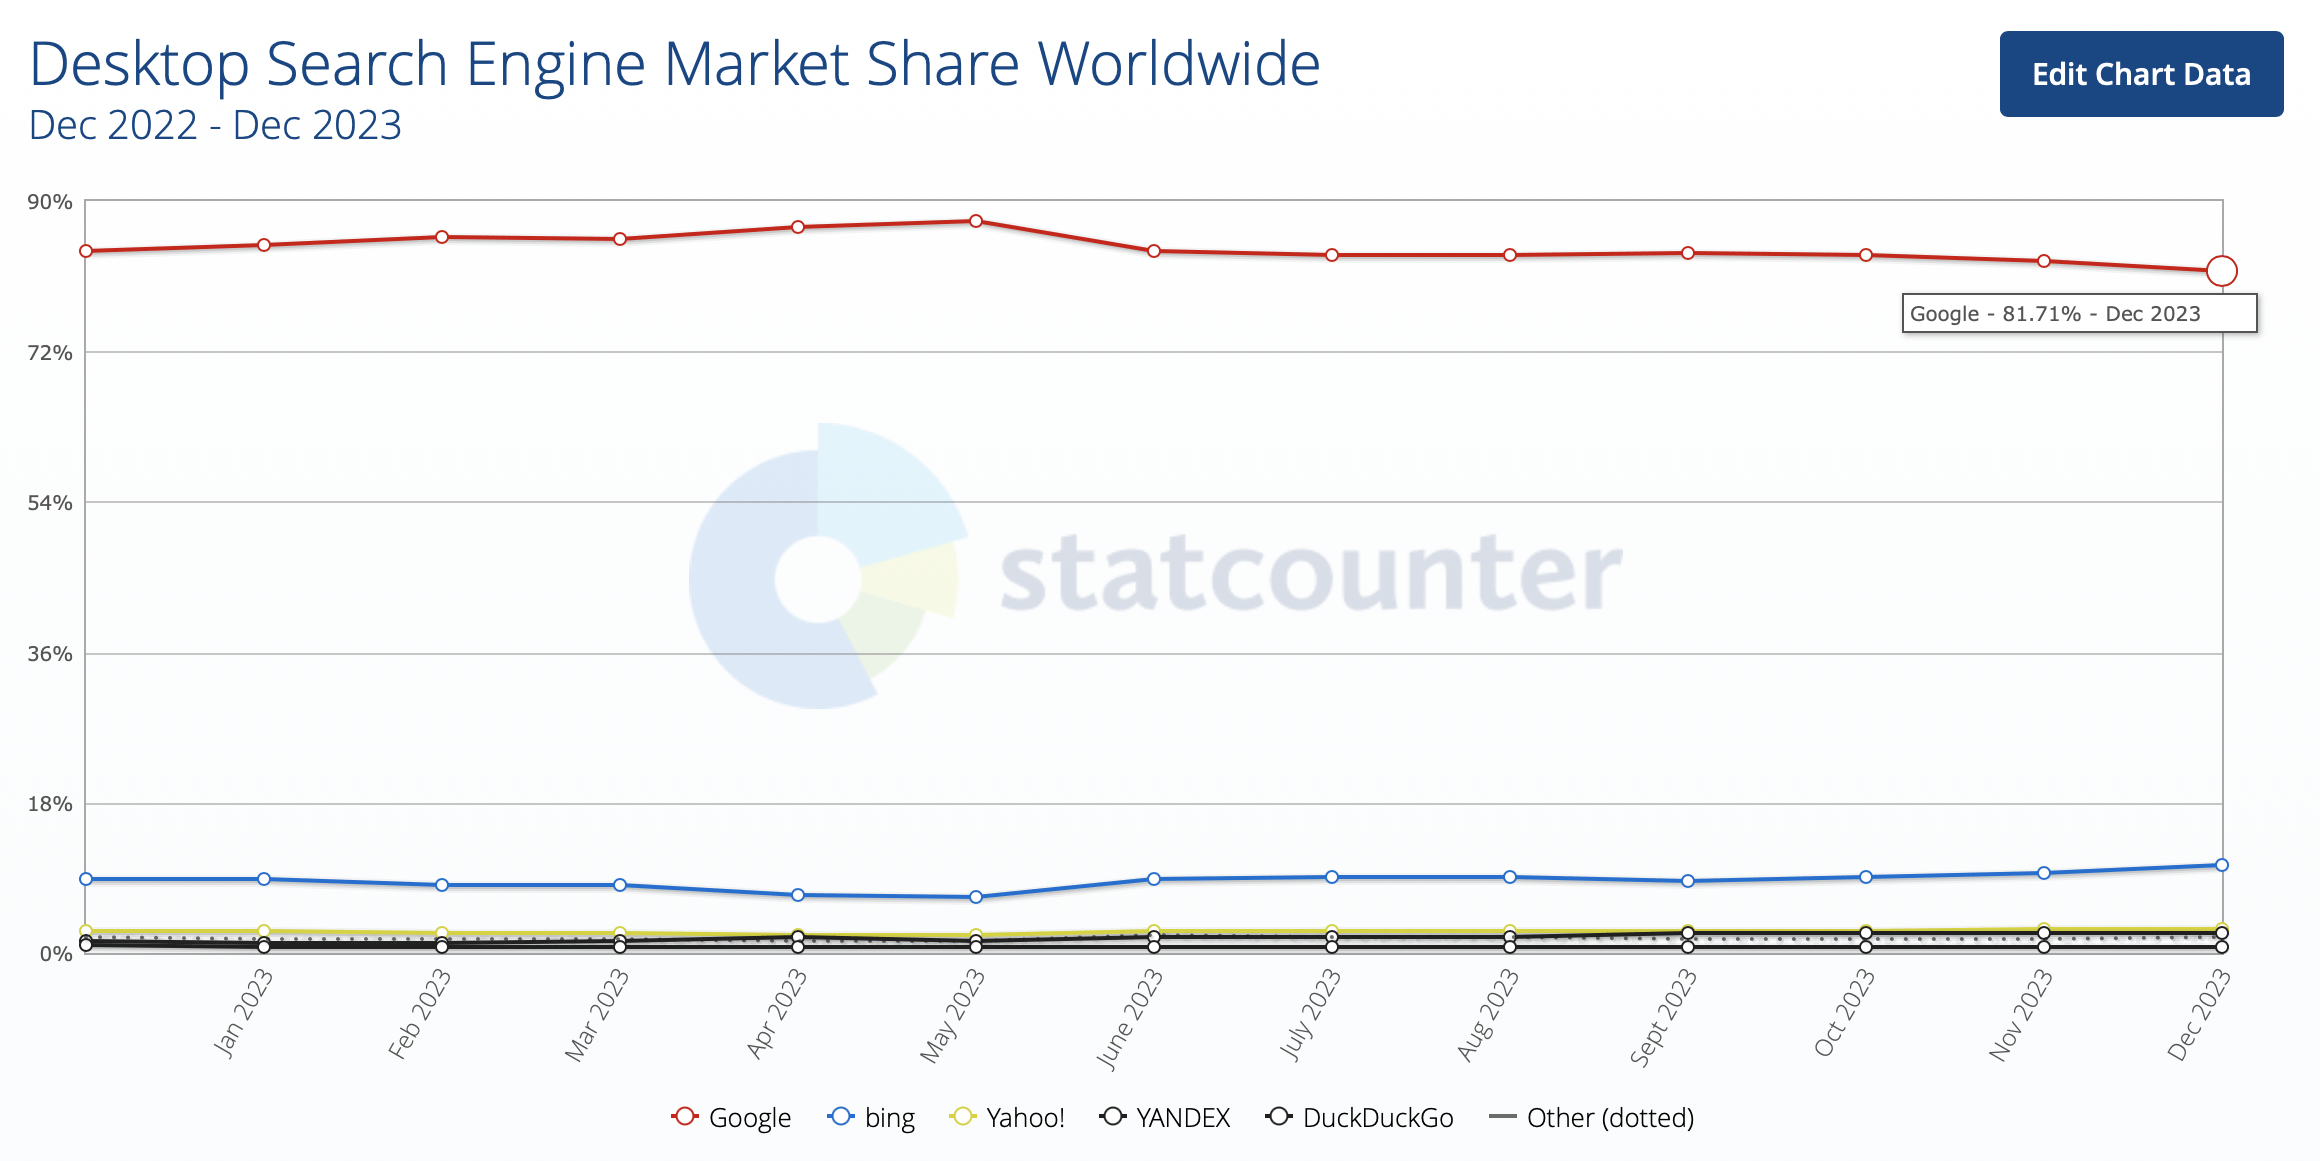
Google’s search engine ads generated around $175 billion for FY2023. If we consider the 2023 number of internet users at 5.158 billion and multiply it by Google’s market share of 81.71%, we find that Google serves around 4.214 billion users. This implies that Google’s search engine generates approximately $41.52 per user.
Daily Host News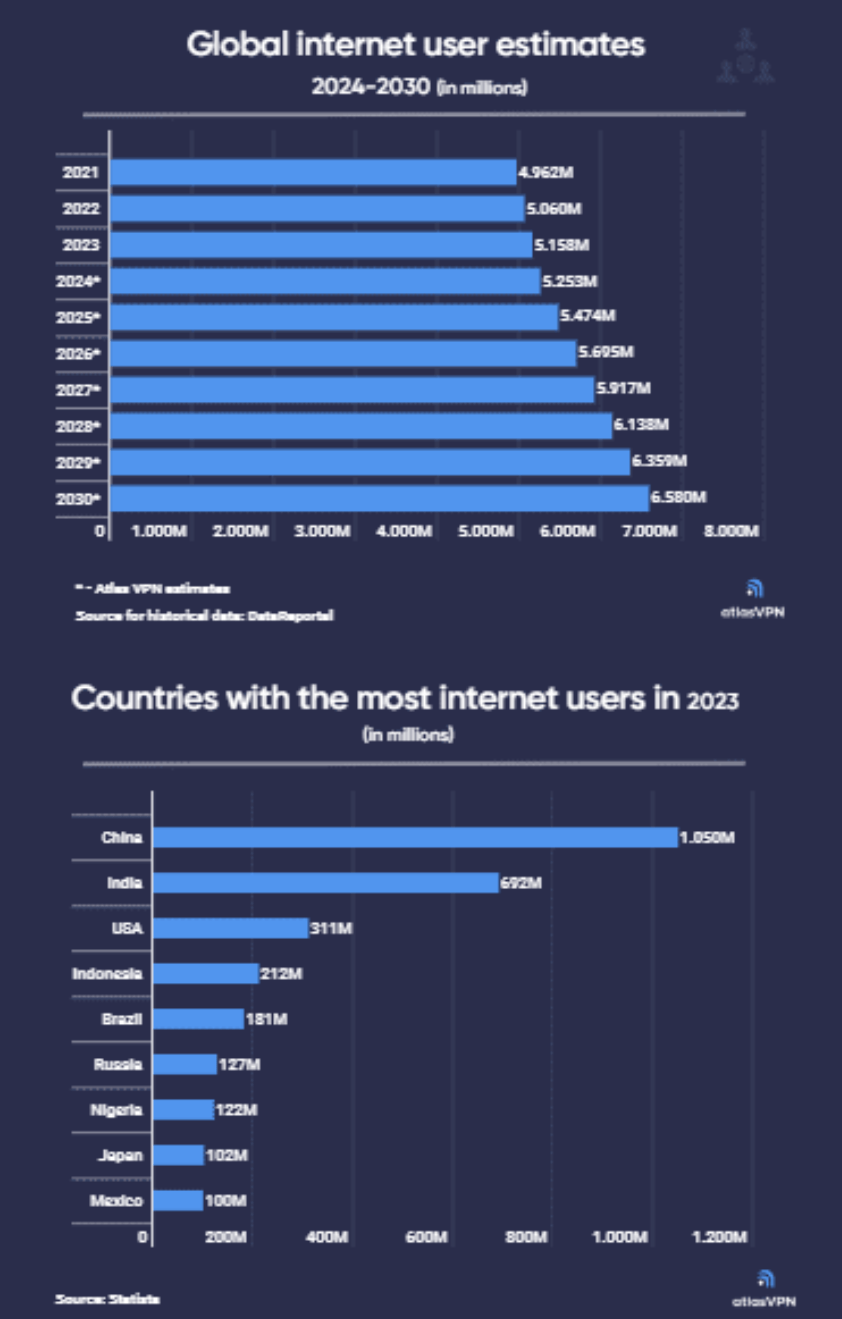
YouTube
YouTube’s user base is anticipated to expand at a 6% annual pace. By 2028, the platform is expected to reach around 1.13 billion users. As indicated in Alphabet’s 10-K, YouTube ads yielded approximately $31.5 billion in revenue for FY2023. As of 2023, the user base stands at approximately 868 million, resulting in $36.29K generated in advertisement revenue per user. Therefore for 2028, with the projected user base of 1.13 billion, we can estimate that YouTube will generate around $41 billion from ads.
Statista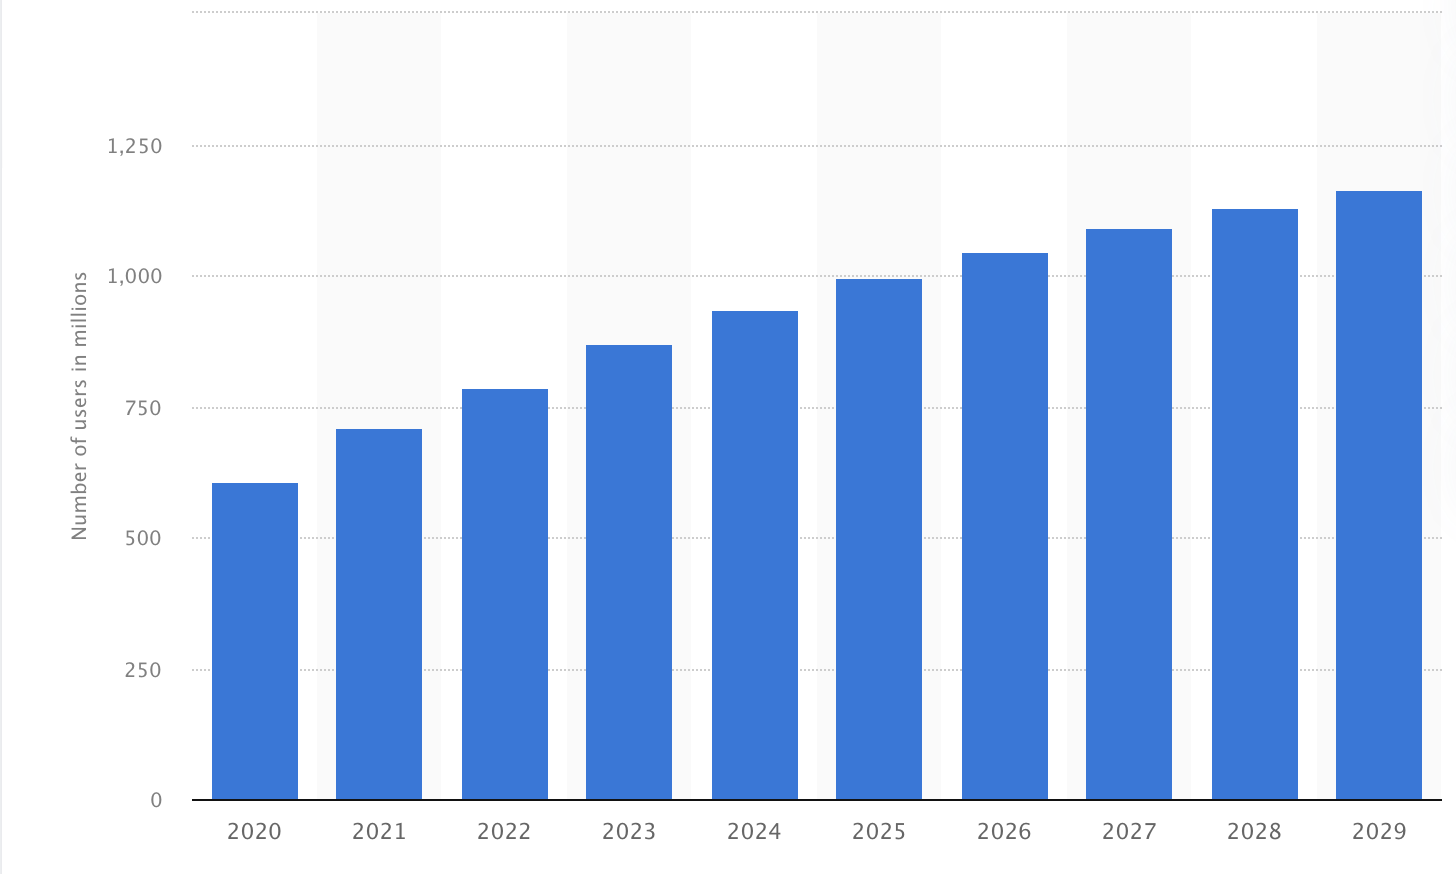
Google Network
The Google Network encompasses AdMob, AdSense, and Google Ads Manager (as said on their 2023 10-K). Primarily, these services provide webpage owners with the opportunity to enable advertisements on their websites. The worldwide digital advertising market is anticipated to grow at a CAGR of approximately 6.94%.
Subscription, Platforms, and Devices
Alphabet offers various subscriptions through its platforms such as Google Play, Google Drive, YouTube, and Google Fi Wireless, among others. The speculated sales figure for Google’s Pixel 8 is approximately 10 million units in one year. According to Alphabet’s 10-K, the primary driver of platforms revenue is Google Play, which generates revenue through the sales of apps and in-app purchases.
The average price for the normal Pixel 8 and the Pro model is $849, implying total sales of around $8.49 billion. This accounts for approximately 24.5% of what Alphabet generated in this segment for FY2023, which amounted to around $34.6 billion.
The revenue of the worldwide smartphone market is projected to grow at a CAGR of 3.53% throughout 2028.
Concerning the other two components of this segment, platforms & subscriptions, Google charges around 15% for 99% of Google Play’s developers. In 2022, consumers spent around $42.3 billion on Google Play apps, resulting in Google Play retaining around $6.3 billion. This represented around 21.8% of the segment revenues in 2022. Using the same percentage, it can be inferred that for 2023, Google Play generated around $7.57 billion.
By subtracting the implied Pixel and Google Play revenue, we are left with $18.54 billion, which closely aligns with the number announced by Sundar Pichai: $15 billion.
The worldwide apps market is expected to grow at a CAGR of around 8.58% throughout 2027.
Statista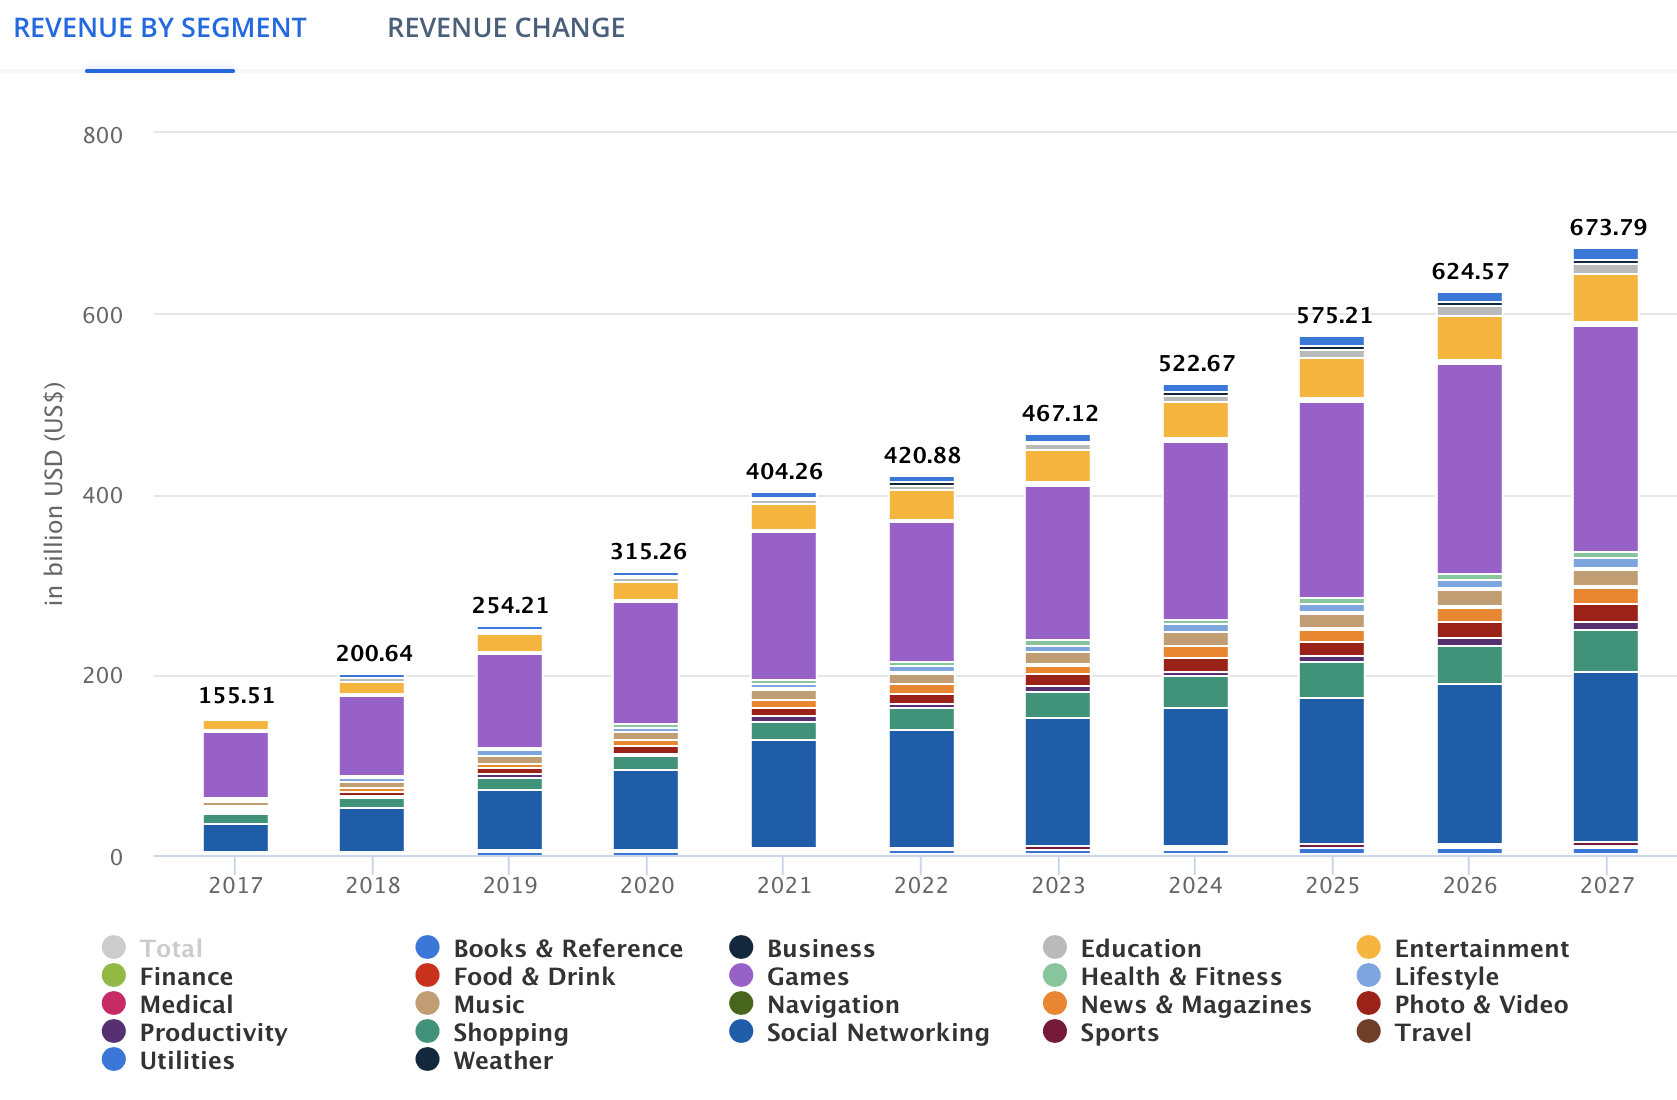
Google Cloud
Google Cloud stands out as one of the most hyped ventures within Alphabet, particularly because cloud computing is experiencing rapid expansion, fueled by AI-powered data centers. The worldwide public cloud market revenue is anticipated to grow at a CAGR of 16.3%.
Q4 2023 Earnings
When Alphabet released its Q4 2023 earnings on January 30th, the stock declined by approximately 7% as Alphabet disappointed with Google Ad revenues, despite surpassing expectations for overall revenue and EPS. It’s important to note that Alphabet’s profitability heavily relies on ads, making ad revenue a direct indicator of Google’s future performance.
Additionally, Alphabet incurred severance charges of around $2.1 billion due to layoffs and $1.2 billion related to lease terminations for offices. However, this implies that Alphabet would have approximately $3.4 billion in extra cash for the next year due to these expense reductions.
Financials (In millions of USD unless specified otherwise)
Alphabet’s revenue has been growing at an annual pace of 29.5%, with operating income expanding slightly faster at 31.9% annually. Net income has demonstrated the fastest growth among the three metrics, at 80.5%.
Since my previous article, released with Q2 2023’s results, TTM revenue has evolved positively by 6.28%. Similarly, operating income has increased by 10%. Net income has shown very positive growth of 21%.
Margins have improved significantly. Operating income now stands at 27.42%, surpassing the Q2 TTM number of 26.44%. Meanwhile, the net income margin has risen from 21.05% in Q2 2023 to the current 24.01%.
Author’s Calculations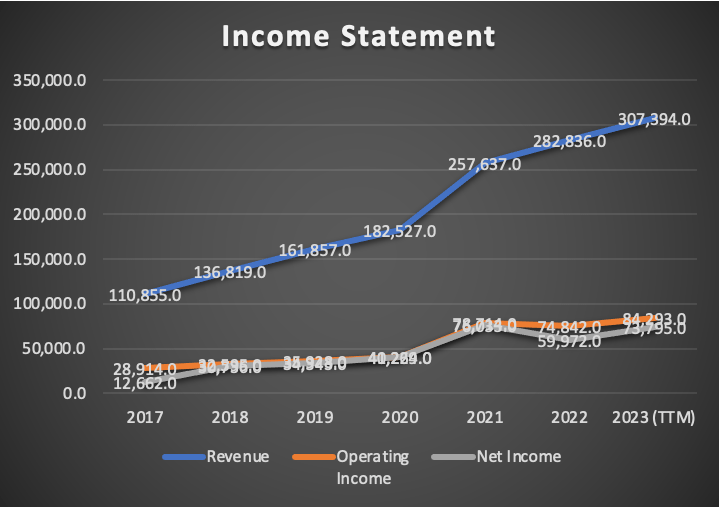
Author’s Calculations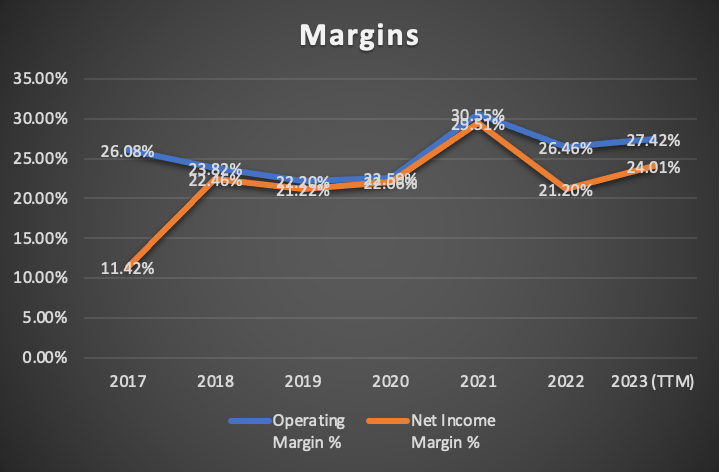
The balance sheet has exhibited a slight deterioration compared to Q2 2023. In my previous article, cash reserves stood at $118.3 billion; currently, they total $110.9 billion. Long-term debt has increased from $11.8 billion to $13.2 billion. However, short-term debt has decreased from $17.5 billion to $12.4 billion. This may signal that the increase in long-term debt and the decrease in short-term debt are due to maturity payments.
Author’s Calculations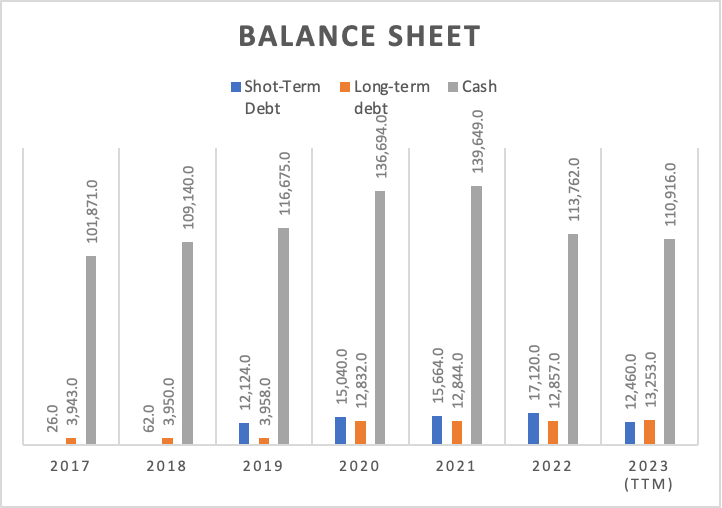
Free Cash Flow currently stands at $57.9 billion, marking a 1.5% decrease compared to Q2 2023 TTM. The FCF margin has slightly declined from 20.3% to the current 18.8%. The probable reason for this change may be attributed to the increase in TTM CapEx from $28 billion in Q2 2023 to approximately $32.2 billion.
Author’s Calculations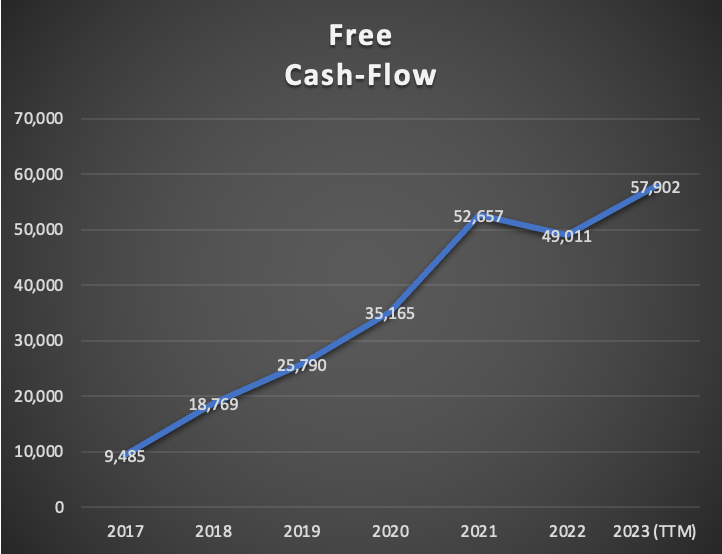
Author’s Calculations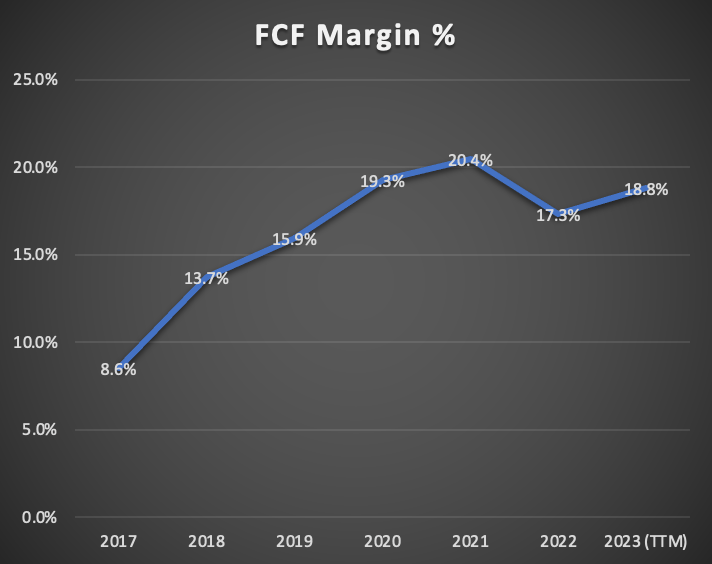
Author’s Calculations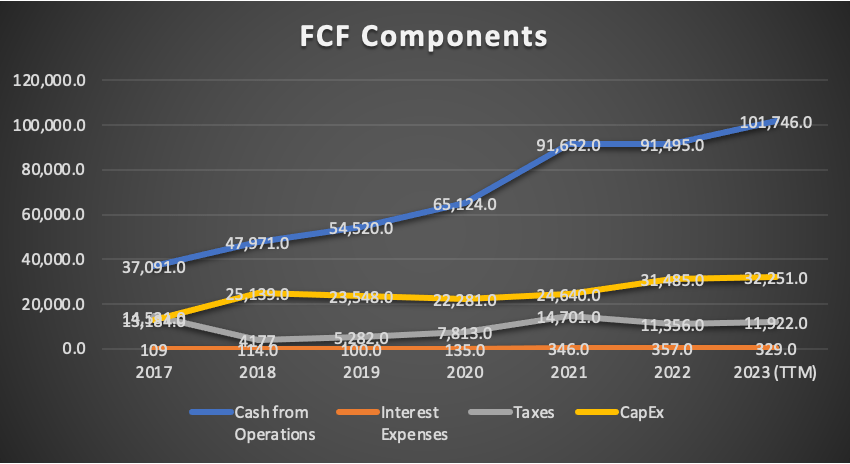
Overall, Alphabet remains a financially robust company, which comes as no surprise. It has demonstrated growth in the three main income statement metrics, with a minor adjustment in the balance sheet, and a slight decrease in FCF generation due to increased CapEx. There’s nothing alarming to be concerned about.
Valuation (In millions of USD unless specified otherwise)
In this valuation, I will conduct two valuation models. The first one will rely on available estimates for Google, which can be found on Seeking Alpha.
The second model will be created from scratch based on the available market projections for each of Alphabet’s ventures.
In the table below, you will find all the current financial information available for Alphabet. CapEx, interest expenses, and D&A will all be projected using margins tied to revenue, aiming to make the model conservative and following the logic that with increased revenue, there will be a need for greater investment in the company.
| TABLE OF ASSUMPTIONS | |
| (Current data) | |
| Assumptions Part 1 | |
| Equity Value | 283,379.00 |
| Debt Value | 25,713.00 |
| Cost of Debt | 1.28% |
| Tax Rate | 13.91% |
| 10y Treasury | 3.93% |
| Beta | 1.12 |
| Market Return | 10.50% |
| Cost of Equity | 11.29% |
| Assumptions Part 2 | |
| CapEx | 32,251.00 |
| Capex Margin | 10.49% |
| Net Income | 73,795.00 |
| Interest | 329.00 |
| Tax | 11,922.00 |
| D&A | 11,946.00 |
| Ebitda | 97,992.00 |
| D&A Margin | 3.89% |
| Interest Expense Margin | 0.11% |
| Revenue | 307,394.0 |
Analysts’ Estimates (In millions of USD unless specified otherwise)
The available EPS estimates suggest that Alphabet will demonstrate a decent double-digit EPS growth, around the 15% mark, with an anticipated acceleration beyond 2026. In my model, I will only incorporate estimates for 2024 and 2025, as they have the most analysts covering them.
Seeking Alpha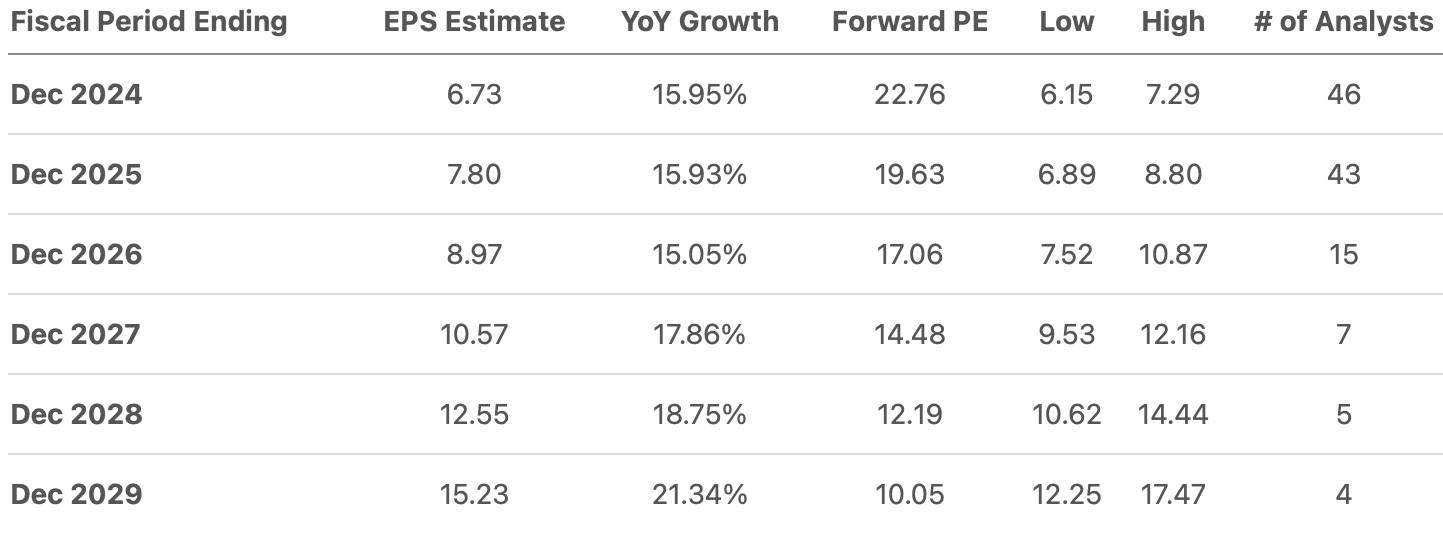
Alphabet’s revenue is forecasted to grow at a slower pace, around the 10% mark. Beyond 2026, the growth rate is expected to decelerate and touch single digits. The projection for revenue growth in 2032, around 5%, may indicate that beyond that date, Alphabet will experience minimal growth. However, I will only utilize revenue estimates for 2024 and 2025 due to the reasons mentioned earlier.
Seeking Alpha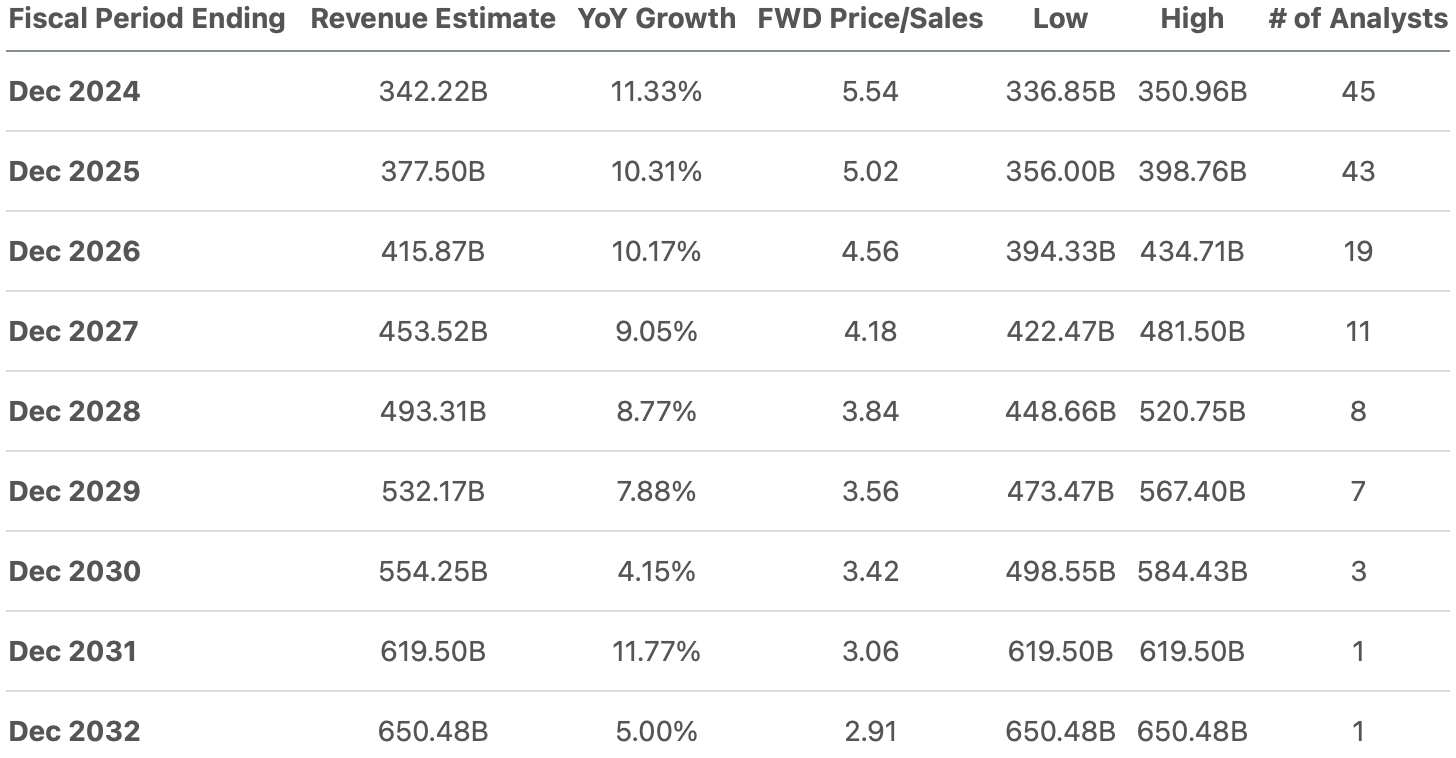
Since I am not incorporating estimates beyond 2025, I will use the forward revenue growth rate of 9.99% and the 3-5 year EPS long-term growth rate of 17.68% (available at Seeking Alpha) to project revenue and net income beyond 2025. Furthermore, upon comparing the table of results below with the previous images displaying the estimates, you may notice that the estimates resulting from my calculations are slightly more optimistic. This could signal that the possible fair price I will derive could be lower if I fully utilized the available estimates.
| Revenue | Net Income | Plus Taxes | Plus D&A | Plus Interest | |
| 2024 | $342,222.0 | $84,044.24 | $95,733.58 | $109,033.08 | $109,399.35 |
| 2025 | $377,500.0 | $97,406.40 | $110,954.23 | $124,253.72 | $124,620.00 |
| 2026 | $415,212.3 | $114,627.85 | $130,570.93 | $146,706.99 | $147,151.38 |
| 2027 | $456,692.0 | $134,894.06 | $153,655.88 | $171,403.92 | $171,892.71 |
| 2028 | $502,315.5 | $158,743.32 | $180,822.23 | $200,343.31 | $200,880.93 |
| 2029 | $552,496.8 | $186,809.14 | $212,791.61 | $234,262.83 | $234,854.16 |
| ^Final EBITA^ |
| Net income Margin % | |
| 2024 | 24.56% |
| 2025 | 25.80% |
| 2026 | 27.61% |
| 2027 | 29.54% |
| 2028 | 31.60% |
| 2029 | 33.81% |
Author’s Calculations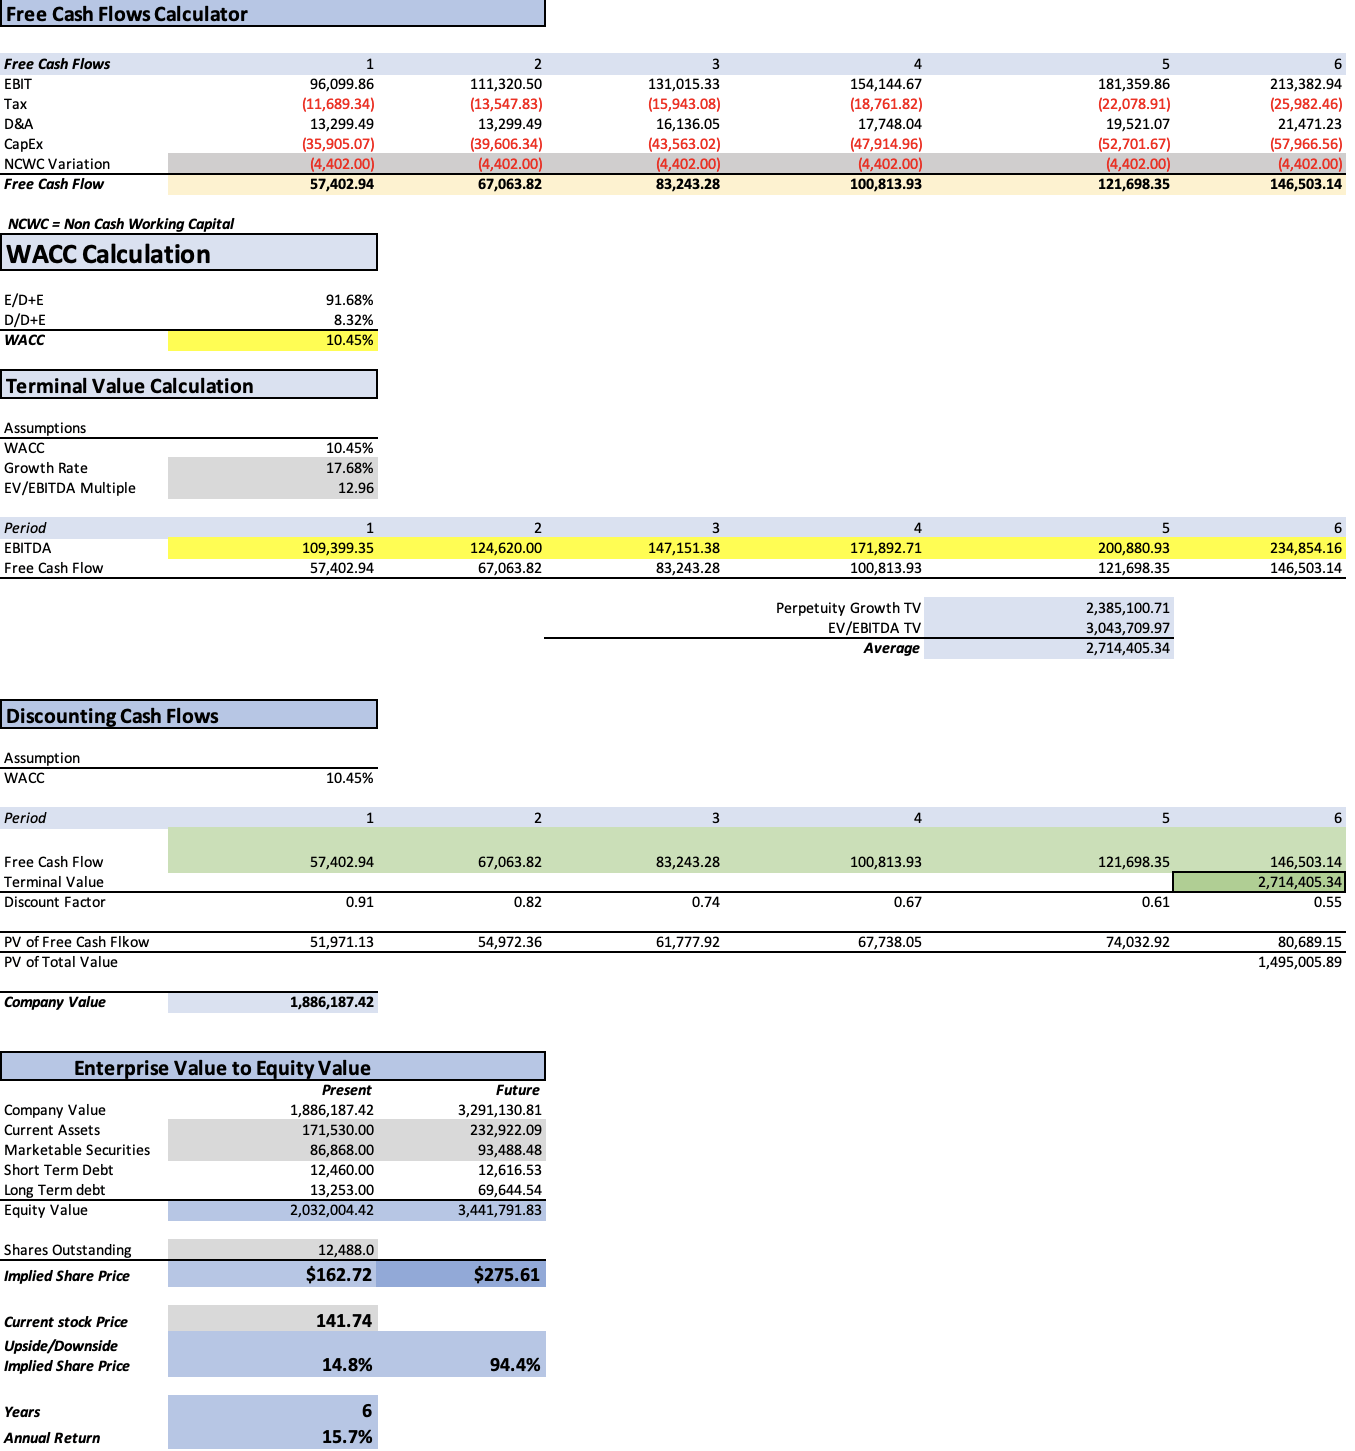
As depicted, this preliminary model yields a fair price of $162.72, which represents a 14.8% upside from the current stock price of $141.74. The future price, if Alphabet follows the average financial evolution displayed from 2017 to 2023, is estimated to be around $275.61, translating into annual returns of 15.7% throughout 2029.
My Estimates (In millions of USD unless specified otherwise)
As mentioned earlier, this second model will be constructed using market projections as the foundation for predicting Alphabet’s fair value. The initial step involves projecting revenues, starting with Google Search Engine projections, utilizing the logic outlined in the overview section.
Google’s search engine ads generated around $175 billion for FY2023. Then if you take the 2023 number of internet users of 5.158 billion, then multiply it by Google’s market share of 81.71% you will get that Google has around 4.214 billion . This means that Google search engine generates around $41.52 per user.
Next, by employing the table of projected internet users and multiplying the projections by Google’s market share, followed by a multiplication by $41.52, we can estimate the revenue.
| Google Users | Google Search Engine Revenue | Internet Users | |
| 2024 | 4,293 | 178,161.3 | 5,254 |
| 2025 | 4,470 | 185,485.8 | 5,470 |
| 2026 | 4,649 | 192,945.9 | 5,690 |
| 2027 | 4,829 | 200,406.0 | 5,910 |
| 2028 | 5,189 | 215,326.3 | 6,350 |
| 2029 | 5,377 | 223,125.5 | 6,580 |
The subsequent step entails predicting Google’s Subscriptions, Platforms & Devices segment revenues. Similar to earlier, I will utilize the logic previously outlined in the overview section.
The average price from the normal Pixel 8 and the pro is $849, which implies sales totaling around $8.49 billion. This is around 24.5% of what Alphabet generated in this segment for FY2023 which was around $34.6 billion.
After estimating how much Google Play could have earned for 2023 and making the revenue grow in line with the Worldwide apps market, which is expected to grow at a rate of 8.58%, we subtract Google Play and devices from 2023 revenue. This process leads to an estimated revenue of around $18 billion from subscriptions for 2023, which will also grow in line with the Worldwide apps market.
Google charges around 15% for 99% of Google Play’s developers. In 2022 consumers spent around $42.3 billion on Google Play apps. If you calculate the 15% of that, you get that Google Play keeper around $6.3 billion. This represented around 21.8% of the segment revenues in 20022. Using that same percentage, we can imply that for 2023, Google play generated around $7.57 billion.
| Subscriptions | Google Play | Google Pixel Devices | |
| 2023 | 18,540.0 | 7,577.5 | 8,490.0 |
| 2024 | 20,130.7 | 8,227.7 | 8,789.7 |
| 2025 | 21,857.9 | 8,933.6 | 9,100.0 |
| 2026 | 23,733.4 | 9,700.1 | 9,421.2 |
| 2027 | 25,769.7 | 10,532.4 | 9,753.8 |
| 2028 | 27,980.7 | 11,436.1 | 10,098.1 |
| 2029 | 30,381.5 | 12,417.3 | 10,454.5 |
YouTube will follow the same logic previously disclosed in the overview section. There what I will do is multiplying the projected user base throughout 2028 by the average ad revenue per user which is $36.29K.
As indicated in Alphabet’s 10-K, YouTube ads yielded approximately $31.5 billion in revenue for FY2023. As of 2023, the user base stands at approximately 868 million, resulting in $36.29K generated in advertisement revenue per user. Therefore for 2028, with the projected user base of 1.13 billion, we can estimate that YouTube will generate around $41 billion from ads.
For the remaining segments, the Google Network will grow at the rate of the Worldwide Digital Advertising market of 6.94%, while Google Cloud will grow at the rate of the Worldwide Public Cloud market of 16.3%.
| Google Search & other | YouTube Ads | Google Network | Subscriptions,Platforms & devices | Google Cloud | |
| 2023 | 174,907.2 | 31,507.9 | 31,292.7 | 34,674.0 | 33,075.6 |
| 2024 | 178,161.3 | 33,398.4 | 33,464.4 | 37,148.1 | 38,466.9 |
| 2025 | 185,485.8 | 35,402.3 | 35,786.9 | 39,891.5 | 44,737.0 |
| 2026 | 192,945.9 | 37,526.4 | 38,270.5 | 42,854.7 | 52,029.2 |
| 2027 | 200,406.0 | 39,778.0 | 40,926.4 | 46,055.8 | 60,509.9 |
| 2028 | 215,326.3 | 42,164.7 | 43,766.7 | 49,514.9 | 70,373.0 |
| 2029 | 223,125.5 | 44,694.5 | 46,804.1 | 53,253.3 | 81,843.8 |
| % of Revenue | 56.90% | 10.25% | 10.18% | 11.28% | 10.76% |
Finally, net income will align with the net income margins derived from the previous model.
| Net income Margin % | |
| 2024 | 24.56% |
| 2025 | 25.80% |
| 2026 | 27.61% |
| 2027 | 29.54% |
| 2028 | 31.60% |
| 2029 | 33.81% |
| Revenue | Net Income | Plus Taxes | Plus D&A | Plus Interest | |
| 2024 | $320,639.1 | $78,748.97 | $89,701.81 | $102,162.55 | $102,505.72 |
| 2025 | $341,303.5 | $88,056.29 | $100,303.66 | $112,764.39 | $113,107.57 |
| 2026 | $363,626.6 | $100,397.31 | $114,361.13 | $128,492.45 | $128,881.63 |
| 2027 | $387,676.2 | $114,519.55 | $130,447.57 | $145,513.51 | $145,928.44 |
| 2028 | $421,145.6 | $133,082.00 | $151,591.79 | $167,958.42 | $168,409.17 |
| 2029 | $449,721.3 | $152,050.77 | $173,198.84 | $190,675.99 | $191,157.32 |
| ^Final EBITA^ |
Author’s Calculations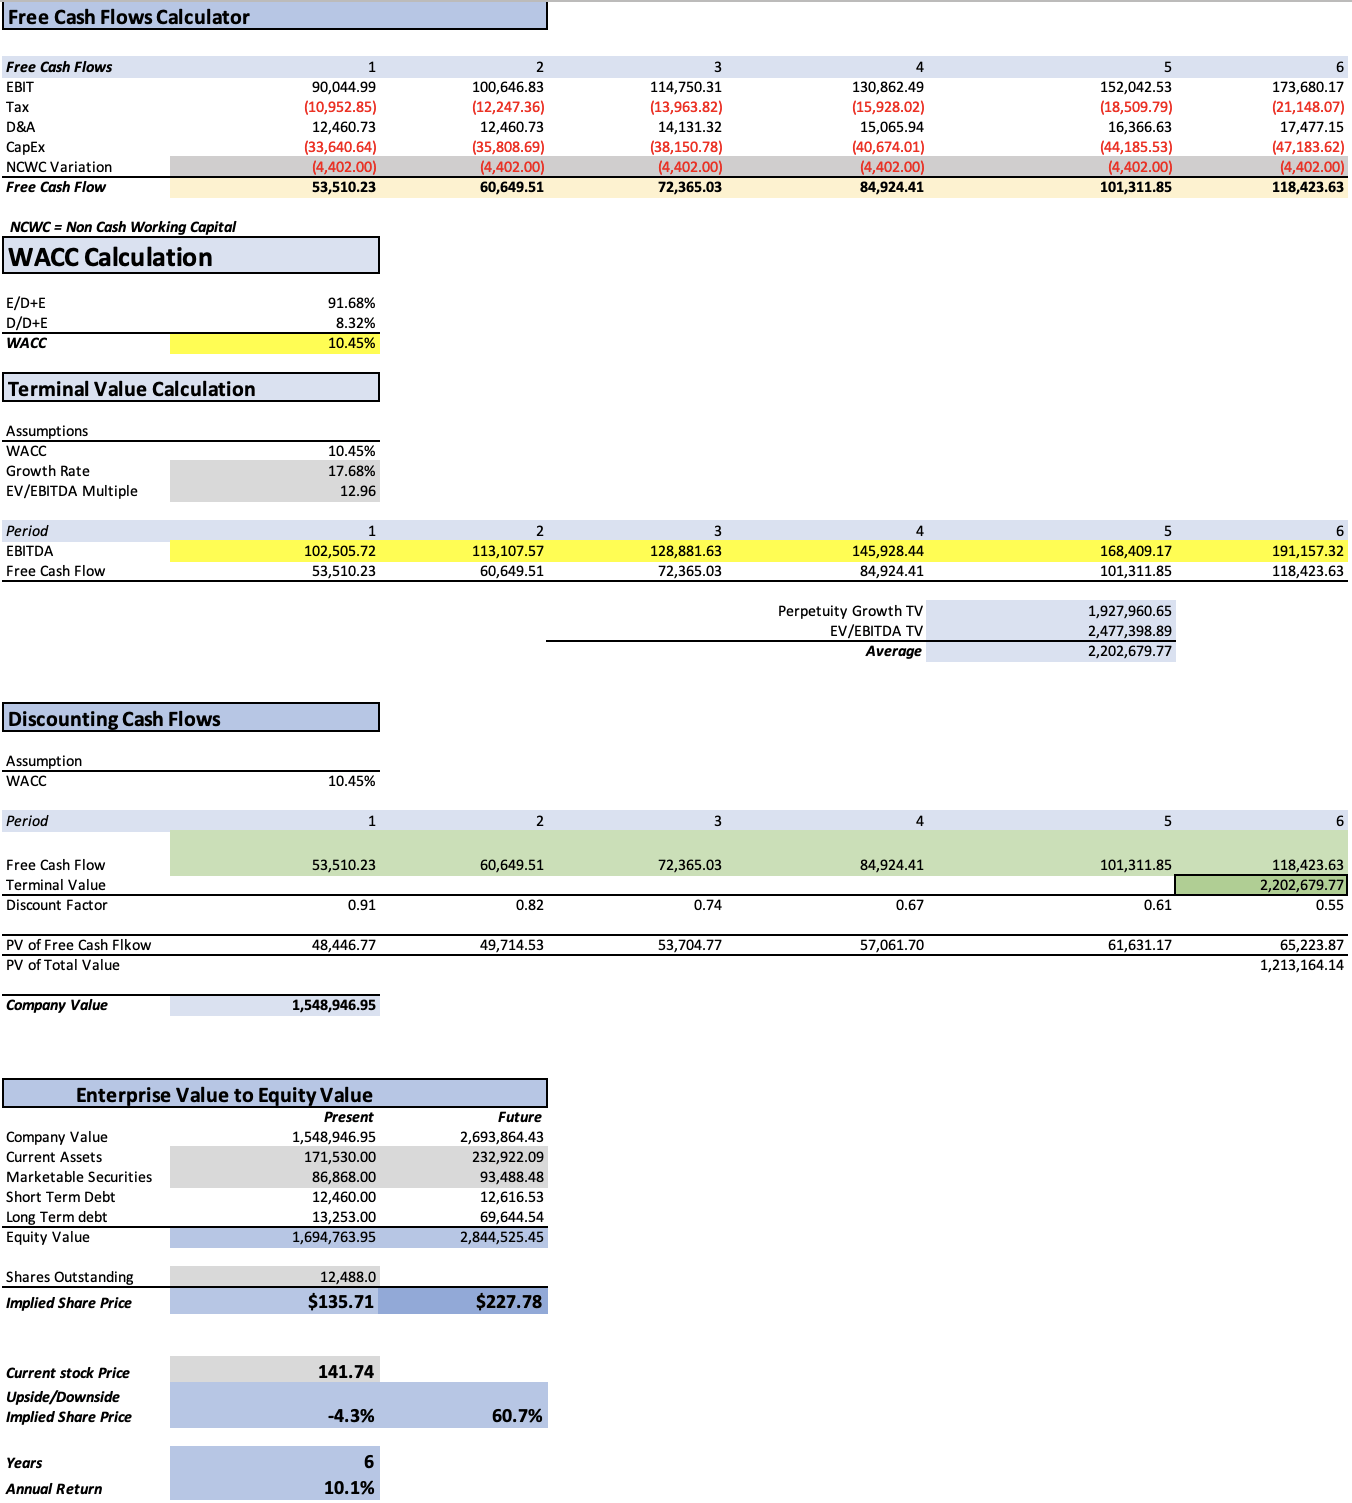
This model is more bearish towards Alphabet, suggesting it’s fairly valued with a stock price of $135.71, just 4.3% lower than the current stock price. The future price stands at $227.78, implying 9.5% annual returns, which may lag behind the S&P 500 (SP500).
Risks to Thesis
The primary risk to this thesis is the potential for Google to implement extensive cost-cutting measures, which could bolster net income and consequently propel the stock price.
The second risk associated with my thesis is that Alphabet may begin expanding through M&As, given its substantial cash reserves and exceptional balance sheet. However, pursuing M&As poses risks, particularly considering that Alphabet has been investigated previously because of anti-trust laws.
The final risk with my models is related to CapEx, since I projected it will continue to grow, however If Alphabet does not increase CapEx, then that would increase the free cash flow and therefore the fair price.
Conclusion
In conclusion, while the company’s robust financial performance and innovative endeavors present promising prospects, challenges loom in the form of limited growth, anti-trust investigation limiting M&As and competitive pressures. The intricate interplay of revenue growth projections, market dynamics, and strategic decisions underscores the complexity of valuing Alphabet’s stock. The results from the two DCF models highlight differing perspectives: while one suggests a fair price of $162.72, indicating a modest upside, the other, more bearish model, indicates a fair price of $135.71, slightly lower than the current stock price.
Given that the most optimistic price implies an upside of 14.8%, I consider Alphabet to be a hold. For my stance to shift, Alphabet must accelerate its net income growth to 20%. In such a scenario, the fair price of the most optimistic model would rise to $180.90, resulting in an upside of 27% and annual returns of approximately 19%, which, in my view, would provide an adequate safety margin.

 Q2 2024 Earnings Call Transcript")

