The Bank for International Settlements (BIS) recently completed a decade-long task of closing gold swaps in the gold arena.
These swaps, conducted monthly since 2010, involved significant volumes of gold, and in 2022, a noticeable decline indicated the completion of this intricate process.
Saqib Iqbal, a financial markets analyst at Trading.Biz, points out several factors contributing to the gold’s projection.
This development aligns with the 11-year period when gold prices remained within a relatively narrow corridor. A critical catalyst was the introduction of Basel III standards, particularly the Net Stable Funding Ratio (NSFR).
This reform altered the treatment of “paper” gold, such as futures and options, on bank balance sheets, enhancing the prominence of physical gold.
The World Gold Council and the London Bullion Market Association (LBMA) cautioned against applying these rules to LBMA, fearing potential market upheaval. While European and American banks embraced Basel III, those linked to the London market resisted. Swiss refineries stepped up to meet the demand from these banks.

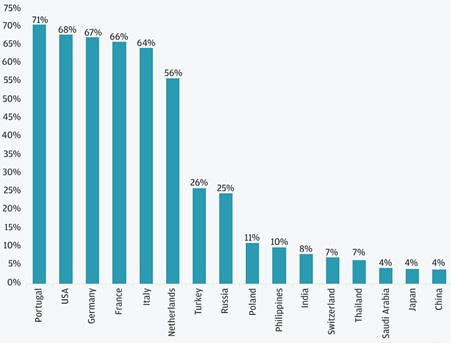
Gold reserves held by central banks (Source: IMF)
The ascent of gold prices in 2023 was further fueled by sanctions against Russia, disrupting gold supplies and resulting in a 38.7% reduction in COMEX gold inventories since January 2021. Banks are now pressured to reclaim gold lent to investment funds to bolster their balance sheets.
Simultaneously, changes in the terms of popular gold ETFs raise intriguing questions about the underlying dynamics of gold markets. Analysts believe this resolution of gold swaps by BIS, just ahead of Basel III implementation, is more than a mere coincidence, signalling a global financial system preparing for gold’s resurgence amidst various economic challenges.
Looking ahead to 2024, the forecast for gold is optimistic, projecting an approach to $2,200. This bullish setup is attributed to closing gold swaps, regulation changes, and global economic factors. The anticipation is that gold will reach $2,200 in 2024, with potential for a slight overshoot. Subsequently, a pullback is expected, followed by a move to $2,500 in 2025.
In the current landscape, gold price predictions abound on social media, but the true dynamics driving gold prices are rooted in leading indicators. Three key indicators – the Euro (inversely correlated to USD), bond yields, and inflation indicators – collectively shape the gold price trajectory. Emphasizing the power of patterns and the correlation between the price of gold and the monetary base M2, analysts expect gold to consolidate and remain range-bound in 2024.
The conclusion is that gold’s path in 2024 hinges on carefully analyzing leading indicators, regulatory changes, and global economic conditions. As investors navigate this landscape, understanding the intricate dance of these factors becomes paramount in making informed decisions. The anticipation is for a peak at $2,200, supported by stabilized Treasuries, lesser upside potential for the U.S. Dollar, and expected rising inflation.
The intricate tapestry of economic shifts, geopolitical events, and regulatory adjustments sets the stage for gold’s journey in 2024. With a focus on leading indicators and broader economic trends, investors aim to decode the patterns influencing gold’s trajectory in the coming year.


