borzaya/iStock via Getty Images
To Our Clients and Friends:
For the fourth quarter and year ended December 31, 2023, the Giverny Capital Asset Management model portfolio, which is a Poppe family account 1, performed as follows 2:
|
GCAM Performance |
Quarter ending |
Year-to- date ending |
One-year ending |
Three years ending |
*Annualized Since Inception |
|
12/31/2023 |
12/31/2023 |
12/31/2023 |
12/31/2023 |
12/31/2023 |
|
|
Portfolio Net Return |
16.26% |
29.07% |
29.07% |
8.94% |
18.68% |
|
11.69% |
26.29% |
26.29% |
10.00% |
19.66% |
|
|
Excess Return -Net |
4.57% |
2.78% |
2.78% |
-1.06% |
-0.98% |
|
* Inception Date 04/01/2020 |
The stock market is peculiar in its ability to deliver a satisfactory result over time in a manner that feels unsatisfying. It’s perhaps like a restaurant with amazing food and awful service. Or a slot machine in reverse: you mostly win and over time your wealth increases. But every so often you suffer a debilitating loss that causes real financial pain. On top of this, the losses generate headlines and the gains are often received skeptically.
The key to long-term success is fortitude. Warren Buffett says temperament matters more than intelligence in investing. Investors who withstood the pain of 2022 were rewarded as stocks clawed back steep losses in 2023. Investors who quit when they were behind will have a tough time ever getting their capital back.
If we look at the three-year period from 2021 through 2023, the S&P 500 Index’ annualized return was a very satisfactory 10%. Ours was 9%. Both are nicely above inflation and approximate the historical norm for the Index. Had we earned a steady 8% to 12% return each year to achieve this result, investors likely would feel like a pleasantly overfed patriarch at the holiday dinner table. Complacent, perhaps even drowsy.
Mr. Market does not do drowsy. Here is how he delivered a 10% return over three years: +28.7% for 2021; -18.1% for 2022; and +26.3% for 2023. The whipsaw journey to an overall gain of 33%, or 10% annually, was the opposite of comfortable. Our three-year net return is even spikier: we were +29.5% in 2021, then down 22.6% last year, before rising 29.1% for 2023. That led to our three-year net gain of 29.5%, or a whisker below 9% annually.
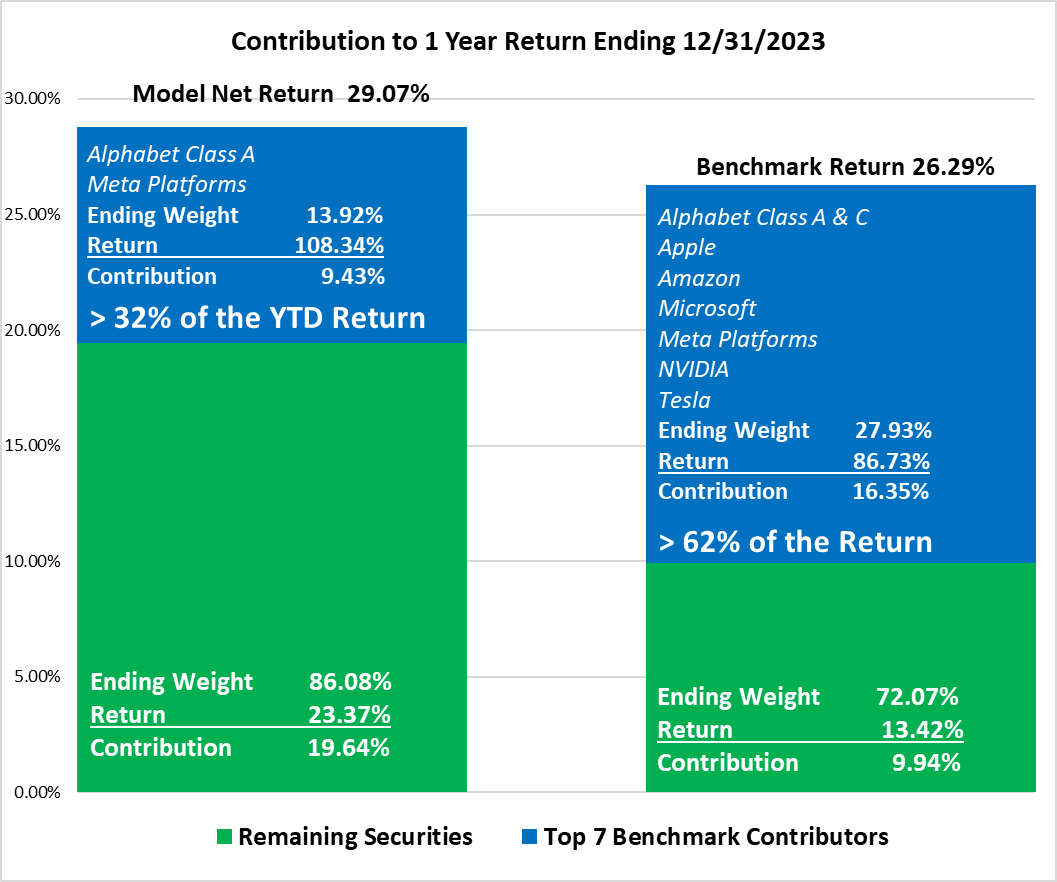
Not only has the market return been wobbly in the extreme, it has been driven by seven giant tech stocks, the so-called Magnificent Seven, of which we own only two: Alphabet (GOOG,GOOGL) and META. As the market delivered 10% compounded over three years, these seven stocks (Apple, Microsoft, Alphabet, Amazon, Nvidia, Meta Platforms and Tesla) compounded at a rate of 16.2% on average. As these seven made up 28% of the Index at the end of 2023, it’s clear they drove a good bit of the overall market return.
One reason why I am confident in our future is that our return outpaced the Index for 2023, and approached it for the three-year period, despite our light exposure to the tech giants. It is not a point of pride for me not to own Apple (AAPL) or Microsoft (MSFT), two of the best businesses on the planet. But it is a point of pride for me that we are pretty good stock pickers: we enjoyed big returns this year from an eclectic basket of stocks, including Arista Networks (ANET, +94%); Constellation Software (OTCPK:CNSWF, +63%), Floor & Décor (FND, +60%) and Installed Building Products (IBP, +114%). That’s in addition to our two Magnificent Seven members, Meta Products (+194%) and Alphabet (+58%).
In a year where 72% of S&P 500 stocks underperformed the market average, our year-end portfolio had 48% (or 12) below the market return and 52% (or 13) above it. Our dispersion is what one would expect: half the constituents below the overall return and half above. The S&P return, on the other hand, hints at the narrowness of the Index. Relatively few constituents drove the return.
A number of our long-term holdings generated returns above 20% for the year, including Progressive Corp. (PGR,+23%), Analog Devices (ADI,+21%), JP Morgan (JPM,+27%), Ashtead Group (OTCPK:ASHTF, +26%), Five Below (FIVE,+21%) and CarMax (KMX, +26%).
The market returned 26% for the year, so one might shrug at a list of stocks that more or less performed as the market did. But 493 S&P stocks outside the Magnificent Seven returned 13% for the year.
More important than our broader base of performance, our companies’ earnings trajectories look good. Most fourth quarter earnings are not reported yet, but nine months of the year are in the books.
According to the consensus of Wall Street analyst estimates as compiled by FactSet Research, the Index components grew their earnings per share by 1% this year. One need not be a math savant to understand that a 26.3% return for stocks driven by 1% earnings growth means the Index enjoyed a hefty 600 expansion of the PE multiple. I think it is fair to say investors were very anxious last year about the prospects for a recession in 2023 and knocked stock prices down in anticipation of one. When earnings and the economy held up, stock prices rose.
Our portfolio components grew earnings well above the Index. Using FactSet consensus estimates with very minor adjustments by us, mainly for insurers with large investment portfolios whose gyrations we exclude from earnings per share calculations, the GCAM model portfolio should grow 2023 earnings per share by 7%, barring a major 4th quarter surprise.
So, we have a broader base of performance than the Index, better earnings per share growth and a lesser reliance on the tech giants. All good. To help you visualize this, we will reprise a chart we published in our last quarterly letter, breaking out the portion of our return driven by our Big Tech holdings Alphabet and Meta vs. the portion generated by our other holdings, and then showing the same for the Index.
We had a strong fourth quarter, but sadly I feel compelled to mention that individual quarters don’t mean much. If the market is characterized by bursts of volatility, I should not boast when the volatility goes our way. Also, in the fourth quarter the big technology stocks lagged relative to the rest of the market. Recently, we’ve underperformed when the Magnificent 7 outpaced the market. We just outperformed during a stretch when they did not. But to repeat myself, I am happy about our strong annual performance and earnings growth.
It felt to me like we were active this year, mainly because I made some difficult decisions (for me) about exiting two positions. Yet when I reviewed our overall transactions for the year, we only turned over about 13% of the portfolio. We aim to act as long-term business owners, partnering with great management teams to create wealth for our clients and ourselves. The portfolio is not a museum and there will be turnover (and taxes to pay) from time to time, but I am from the Charlie Munger school of investment thought: try to make a few well-considered decisions in your life and otherwise spend your time thinking (or, as Charlie would’ve put it, sitting on your butt) rather than to trying to prove that you’re smarter than the market by trading every day.
An important aspect of our low-turnover philosophy is that in a year where our model portfolio appreciated by 29%, the model realized a small short-term capital loss (mostly First Republic Bank sales) and a long-term capital gain amounting to 1.7% of year-end assets. For a client invested the same as the model, a $100,000 portfolio at the beginning of 2023 would have enjoyed $29,000 of appreciation while realizing roughly a $1,000 short-term capital loss and a $2,200 long-term gain. The tax tail should never wag the economic dog, but long-term business owners should expect tax efficiency as a side benefit of patient ownership. [This also presumes the client account behaved the same as the model. Client accounts can differ based on cash flows into and out of the account, timing of account opening – hence the basis price of portfolio positions – and other factors].
Non-taxable clients may not care how actively we trade, but it should resonate that making fewer decisions with more information usually works better than making more decisions with less information.
As we review transactions for the year, let’s cover the bad news first. We exited First Republic Bank (OTCPK:FRCB) at a substantial loss in the first quarter. This cost us roughly 2.5% of client capital, a major reason why our outperformance for the year was not greater. I covered this mistake in our first quarter letter and won’t rehash it other than to say I was listening in May when Warren Buffett spoke at the Berkshire meeting about First Republic’s mismanagement of its balance sheet. I knew this at the time, of course, but felt the business had such strong customer loyalty that it could survive its investment in long-dated bonds yielding very low interest. Mr. Buffett’s point, perhaps oversimplified by me, seemed to be that when the capital allocation is poor it doesn’t really matter how strong the business is. In the end, poor capital allocation is the act of management frittering away wealth.
It’s a bit like two neighbors, both young and with excellent incomes. If one diligently saves a good portion of their income, dollar cost averages regularly into the stock market, pays a little extra on the mortgage every month and avoids credit card debt, while the other dabbles in exotic investments, is on a first-name basis with a local bookie and maxes out credit cards at the holidays, we have a pretty good idea which household will be richer at age 65, no matter who earns more money over their careers.
It’s the same for companies. Earnings power matters, but not more than capital allocation. I thought about this for a while and sold SS&C in the third quarter. This is a fine business with a history of making smart acquisitions. But recently the decision to use floating rate debt to finance acquisitions when interest rates were at historical lows has been a costly mistake. SS&C is growing modestly, but its earnings are stagnant because incremental cash flow must be dedicated to higher interest charges.
In the fourth quarter, we sold Markel (MKL), the Richmond-based insurer. For some years now, Markel has tried to mimic Berkshire Hathaway (BRK.A, BRK.B) by using profit generated in its core insurance business to buy whole companies. While this has been a compelling model for Berkshire, Markel has not been able to convince high-quality companies to sell for attractive prices to the same degree as Berkshire.
Meanwhile, in its insurance operations, Markel has an elevated expense structure – it spends about 33 cents of every dollar collected in premiums on its own overhead. Its leanest competitor spends 21 cents of every premium dollar on overhead. Markel’s cost structure stems from an unwieldy technology stack that would be very expensive to upgrade. I have great respect for Markel, but the combination of middling investments and a challenging expense structure caused me to believe I could find better value elsewhere.
We also exited Ciena (CIEN) during the summer. This was a small position that we discussed in our second quarter letter.
Selling SS&C (SSNC) and Markel, which were each about 4% of the portfolio, was not easy for me. Both businesses trade for reasonable prices and have good competitive positions. They have strong CEOs who have been in the job for many years. CEO Bill Stone founded SS&C and is a billionaire thanks to his own decisions. Tom Gayner at Markel is a well-regarded stock market investor and a much-admired leader.
But with the purchases that followed, I feel confident we strengthened the portfolio.
We bought Fiserv (FI) and Ferguson (FERG) in the third quarter. We covered these purchases in detail in our third quarter letter. Fiserv has performed about the same as SS&C and Ciena since purchase and Ferguson has done better, up about 25% at year-end.
After the sale of Markel in the fall, we used the proceeds to buy a 2% position in Align Technology in November and a 2% position in Kinsale Capital in early December.
With Align (ALGN), our basis is just below $190 and it finished the year at $274, for a very productive seven weeks of ownership.
I have been following Align off-and-on for more than a decade without making a meaningful amount of money for clients for doing so. Until now. Align is the inventor of Invisalign clear aligners, which allow orthodontists and dentists to straighten teeth without using wires and brackets. Millions of adults worldwide have opted to straighten their teeth with clear aligners. Increasingly, orthodontists can achieve the same results for teens using aligners as with braces.
This is important because the market for adults who’d like a better smile is large-but-discretionary. A 40- year old who has lived with crooked teeth for years can defer a $6,000 procedure indefinitely. On the other hand, many parents feel responsible for their children’s orthodontia and, as a result, some 15 million kids around the world get braces each year, including roughly 3.5 million in the US.
In the US, Align has a roughly 15% share of the teen orthodontia market, but our work suggests leading- edge orthodontists are putting 40%-50% of their teen patients into aligners, with this market share moving only in one direction. Importantly, teens often ask for Invisalign by name.
Mr. Market alternates between exuberance at the prospect of Align replacing the global market for wires and brackets and anxiety at the prospect of new entrants copying the technology and commoditizing the price point. After all, there are no recognizable brand names for wires and brackets. As a result, in the past three years the stock has traded as high as $700 and as low as $170.
As mentioned, I’ve been paying attention for some time and do not believe a strong second player is emerging. A lot of money has been lost, in fact, trying to compete with Align by introducing lower price points. Align has lost some patent protections in recent years, spurring a flood of capital into the market and a modest loss of market share. But Align still holds hundreds of US patents and spends more on aligner Research & Development than all of its competitors combined. It has brand recognition with patients who ask for Invisalign by name and credibility with dentists and orthodontists whose professional reputations rely on achieving good results. I think we bought a market leader at a discount to its intrinsic value.
Kinsale (KNSL) was a December purchase, so literally we’ve owned it for a few weeks, but it is up nicely from our $330 basis. Kinsale is an insurance company that writes policies in the so-called Excess & Surplus market, or E&S. The E&S market takes on risks that the regulated market, or standard market, won’t underwrite. A lot of small business coverages end up in E&S, and because of the increasing risks for cyber security, hacking and other forms of fraud, small businesses find themselves needing more coverage.
Meanwhile, property owners in Florida, the Gulf Coast or California who cannot obtain any coverage for hurricane or wildfire risk also are ending up in the E&S market. There, they might pay twice as much premium for half as much coverage as they had previously. Because regulators won’t allow admitted companies to effectively quadruple their rates, those insurers in some cases are withdrawing from property markets. The result: policies flow into E&S.
Kinsale was founded in 2009 by Mike Kehoe, an industry veteran who remains at the helm. Mike built Kinsale on a state-of-the-art technology platform that allows the company to provide quotes to most callers within a couple of hours. Many competitors need several days to scour their databases and assemble the information required to offer a quote. Kinsale’s expense ratio is about 21%, far below larger competitors like Markel. Insurance is a commodity product; nearly every business policy is put out to brokers for bid. In the end, the insurer with the lowest cost of operation is going to win.
We paid a high price for Kinsale relative to its current earnings, but I believe the company can grow at a mid-to-high teens rate for a long time. Currently, it has a 1.5% market share in E&S.
We did a bit of portfolio sculpting during the year, with mixed results. We trimmed Arista Networks several times during the year as it soared. Those trims, a very small one in March at roughly $163 and a larger one in August at $183, don’t look smart with Arista finishing the year at $235 (and up more in January). Arista rose 94% this year. The good news is, Arista finished the year as our second largest holding, at 7.9% of the portfolio.
If you are wondering how I could sell some Arista at $163 but then hold most of it at $235, the answer is that Arista’s outstanding competitive position in Artificial Intelligence became clearer to me as the year progressed. I felt in March that Arista would earn $8 per share in a few years. I see today that it might earn $8 in 2025.
It’s possible there is AI-related froth in the Arista stock price, but also probable that Arista will continue to grow rapidly as the computing centers that process AI queries require enormous amounts of data bandwidth. I believe Arista’s routers and switches are the best tools for routing so-called hyperscale traffic. Also, its operating software allows computer giants to manage the kudzu-like growth of their data centers, lowering their total cost of operation.
We trimmed our Heico Class A (HEI.A) shares from 5% to 4% in the fourth quarter, another dubious decision considering we sold shares for about $132 and they finished the year a few weeks later at $142. Heico, which sells private label aftermarket parts to the aviation industry, is a great family-run business with an enormous growth runway, no pun intended. Like Kinsale, it has a tiny market share in its industry and a fantastic cost-position. It perpetually trades for an enormous price. We felt like 5% exposure to a PE multiple of roughly 35x was a little too much.
The sales of both Arista and Heico reflected my desire to manage PE multiple risk. I keep learning the hard way, however, that trimming your winners generally doesn’t add value. If the valuation is beyond justification, sell the position. If the valuation is high but the business continues to dominate its niche, grow steadily and add value for customers, maybe just take a walk around the block until the urge to sell goes away.
If our two main trims were not well-timed, the good news is that that our additions to existing positions mostly added value. We bought more shares of M&T Bank (MTB) in April at $115. It finished the year at $137. I don’t love the banking business, but M&T is so intelligently managed by CEO Rene Jones and his team that I felt like $115, about seven times 2023 earnings, was too cheap to pass up.
We added to our holding in Charles Schwab (SCHW) several times during the year in the mid-$50s. Schwab finished the year above $68 before declining a bit in January. At year-end, Schwab was our sixth-largest position at 5.7% despite an overall price drop of 18% for the year and a steep earnings decline. I believe in this business and its earnings power over the next few years. However, Schwab qualifies as a poor manager of its own balance sheet. If I listened to Warren Buffett on this, I might sell the stock.
Have I ever mentioned that one of my favorite aphorisms is “consistency is the hobgoblin of little minds?” Like First Republic Bank, Schwab bought a huge volume of extremely low-yielding government bonds during the pandemic. As rates rose, the bonds lost resale value while also generating anemic income. If the bonds were marked down far enough, Schwab might not have enough capital to support its business.
Unlike First Republic Bank, however, Schwab continued gathering billions of dollars of brokerage assets all year, shoring up its capital position. The flow of new money into Schwab meant it had plenty of capital on hand, even after marking down the value of longer-dated bonds. Schwab’s acquisition and integration of TD Ameritrade has been rocky – we use Schwab as our primary custodian and sometimes feel the pain. But Schwab retains a tremendous level of trust with retail investors and remains a great value partner to investment advisors like me. I think the business has earnings power well beyond recent results and will power through its mishap(s).
Perhaps our best addition to an existing position this year was Installed Building Products. When the stock fell to $112 in the fourth quarter, we bought shares. The stock almost immediately went on a tear, finishing the year at $182 and vaulting into our top 10 holdings. If I did this more often, I might become insufferable.
We similarly added to our position in Ashtead Group, buying in September at $66 and then in November at $59 (translated from British pounds). Ashtead finished the year at $70 but subsequently issued weak guidance for 2024 and the stock is back to the low-$60s. Ashtead rents equipment to customers in the construction, maintenance, entertainment and events industries mostly through its Sunbelt Rentals chain in the US. As with IBP, I believe it has a superior cost and service position in its industry and am excited to have a larger stake in this business.
Two of our additions earlier in the year were not helpful: we added to Eurofins Scientific (OTCPK:ERFSF) in March at $71 (translated from euros). It finished the year at $64. Eurofins is a leading scientific testing company that has struggled with lower demand for testing in Europe and increased price regulation in its home market of France. And we added to First Republic on the way down, which felt like catching a boulder with a baseball mitt. This may feel to the reader like a lot of activity, but it amounted to 13% portfolio turnover.
I want to finish up with a deep dive into my macroeconomic outlook for 2024 and beyond. Just kidding. No one knows what the future will bring, least of all me. There are a million things to worry about: overseas wars; the mounting federal debt and lack of seriousness about addressing it; increasingly fragile US institutions; etc. There will always be things to worry about. The stock market does not exist free of macroeconomic or political concerns, but it is close to impossible to predict how those concerns will play out. Because a century of data shows that stocks are the best performing asset class over time, albeit extremely volatile, our bias should be to stay invested. That’s where temperament comes in. We manage risk by partnering with outstanding management teams and strong business models, and by not overpaying for our shares. The underlying assumption is not that everything will be fine. The assumption is that no matter what happens, the best decision makers working at the strongest businesses will navigate storms better than others.
I would also note that even after a big return in 2023, the market outside of the Magnificent Seven is not especially expensive. Here is a chart from The Daily Shot that caught my eye in early January.
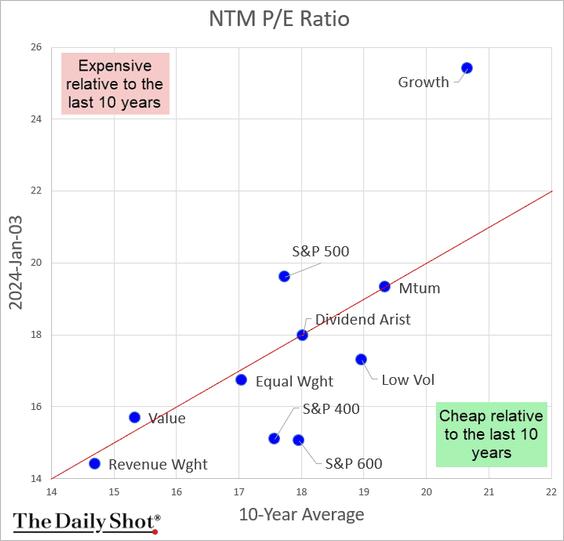
The message here is simple. The S&P 500 is expensive relative to its average valuation over the past 10 years, trading at a forward multiple of about 19.5 times earnings (the Y-axis) versus a 10-year average PE of less than 18 times earnings (the X-axis). However, the equal weight S&P 500 is slightly below its 10- year average valuation and the S&P MidCap 400 is priced well below its 10-year average. The S&P 600 (SP600), which is a small cap index, is also attractively priced, at least compared to the past decade.
The S&P 400 (SP400) includes companies ranging in market capitalization size from $2 billion to $18 billion. It appreciated 9% last year. We have 25% of our portfolio in companies of this size whereas the flagship S&P 500 Index has only about 5% exposure to midcaps.
We outperformed the Index in 2023 and are close to the performance over three years with a portfolio that is quite different from the Index. Over the past century, small and mid-cap stocks have outperformed mega-cap stocks for the simple reason that is hard to grow earnings rapidly from a giant size. Today, several of the best performing (and most expensive) stocks in the US have market caps above $1 trillion and modest earnings growth. My investment decision is that we’ll be better off over time looking for younger companies that have years of earnings growth ahead of them, and preferably with founders or owner-operators at the helm.
In our quest to add value for you, I am lucky to work alongside my partners at Giverny Capital Inc. They have proven to be wonderful colleagues and friends over our nearly four years together. I am grateful to our head of operations Al Munro, whose diligence and attention to detail serves all of us well. In October, John Bleday joined us as an analyst. He’s already making a great contribution in research.
Most importantly, GCAM is lucky to have a steadily growing roster of clients. When I started this business, a money manager friend advised me to be thoughtful about growth. “If you like your clients, you’ll like your life,” he said. “And if you don’t like your clients, you’re going to hate your life.” Well, I love my life. I am in business with long-term investors who believe in the power of a concentrated portfolio. Thank you for entrusting me to invest on your behalf.
With every good wish,
David M. Poppe
|
Giverny Capital Asset Management |
Top 10 holdings |
|
December 31, 2023 |
|
|
Alphabet A&C |
8.3% |
|
Arista Networks |
7.9% |
|
Constellation Software |
7.3% |
|
Progressive Corp. |
6.9% |
|
Charles Schwab |
5.7% |
|
Meta Platforms |
5.6% |
|
Five Below |
4.5% |
|
CarMax |
4.5% |
|
Installed Building Products |
4.2% |
|
Berkshire Hathaway |
4.0% |
|
Total |
58.9% |
|
2023 Top Contributors |
Avg Weight |
Total Return |
Contribution To Return |
|
Arista Networks, Inc. |
7.24 |
94.08 |
5.70 |
|
Meta Platforms Inc. Class A |
4.78 |
194.13 |
5.31 |
|
Alphabet Inc. Class A |
8.21 |
58.32 |
4.44 |
|
Constellation Software |
6.84 |
62.40 |
4.01 |
|
Installed Building Products |
2.99 |
117.53 |
2.83 |
|
30.06 |
89.14 |
22.28 |
|
|
2023 Bottom Contributors |
Avg Weight |
Total Return |
Contribution To Return |
|
First Republic Bank |
0.49 |
-89.99 |
-3.23 |
|
Charles Schwab Corp |
5.02 |
-15.96 |
-1.51 |
|
Eurofins Scientific SE |
2.53 |
-7.77 |
-0.36 |
|
Ciena Corporation |
0.87 |
-14.34 |
-0.28 |
|
M&T Bank Corporation |
2.34 |
-1.67 |
-0.02 |
|
11.25 |
-23.40 |
-5.40 |
|
|
Footnotes 1 The family account does not pay a management fee. The returns presented herein assume the deduction of an annual management fee of 1% to show what a client account’s performance would have been if it had been invested the same as the family account during the period. Past performance is not necessarily indicative of future results. 2 The S&P 500 Index returns include the reinvestment of dividends and other earnings. The Index is an unmanaged, capitalization-weighted Index of common stocks of 500 major US corporations. The Index does not incur expenses and is not available for investment. |
Editor’s Note: The summary bullets for this article were chosen by Seeking Alpha editors.
Editor’s Note: This article discusses one or more securities that do not trade on a major U.S. exchange. Please be aware of the risks associated with these stocks.

 Q2 2024 Earnings Call Transcript")

