Javier Ghersi/Moment via Getty Images
Written by Nick Ackerman, co-produced by Stanford Chemist.
Franklin Universal Trust (NYSE:FT) provides exposure to both high-yield bonds and utilities. That combination can provide some fairly attractive yields for investors. However, similar to most equity closed-end funds, it will also require capital gains to achieve the fund’s current 7.88% distribution yield. The fund is currently trading at a deep discount on an absolute basis. On a relative basis, it’s looking fairly attractive, too, but not as much so.
FT Basics
- 1-Year Z-score: -1.65
- Discount: -12.57%
- Distribution Yield: 7.88%
- Expense Ratio: 2.78% (including leverage expenses)
- Leverage: estimated 24.01%
- Managed Assets: $249.86%
- Structure: Perpetual
FT’s investment objective is to “provide high current income consistent with preservation of capital. Its secondary objective is growth of income through dividend increases and capital appreciation.”
To achieve this, the fund will:
the Fund may invest in a significant portion of its portfolio in lower-rated U.S. debt securities that have high income producing characteristics, including obligations of corporations and other business organizations. Lower-rated securities generally pay higher yields than more highly rated securities to compensate investors for the higher risk. The Fund may also invest in income producing debt obligations of the U.S. Government, its agencies and instrumentalities, and foreign governments and supranational organizations. Under normal market conditions, the Fund generally will invest between 60% and 80% of its total assets in high income producing debt securities of U.S. and foreign issuers, allocated among issuers, geographic regions, and currency denominations in a manner that is consistent with its objectives based upon relative interest rates among various instruments denominated in different currencies, the outlook for changes in these interest rates, and anticipated changes in currency exchange rates.
They continue with:
the Fund will invest approximately 20% to 40% of its assets in dividend-paying common and preferred stocks. The Fund will emphasize investment in common stocks paying higher current dividends with a focus on public utility companies. The Fund may also invest in equity and convertible securities of companies engaged in the business of extracting and processing precious metals and natural resources, such as gold mining stocks.
To sum it up, they invest with some flexibility, but the primary focus is a tilt toward high-yield bonds and matching that up with mostly utility equity positions.
The fund is quite small, but it gets a bit bigger with leverage. This fund utilizes leverage in an attempt to achieve better overall total returns for investors. This can increase volatility and increase potential risks as well as potential rewards.
Interestingly, while they use a credit facility, they have a fixed-rate 5.95% facility that matures on September 14, 2026. That’s actually a fairly attractive rate compared to what funds are having to issue preferred and baby bonds these days. That said, it was still higher than the senior fixed rate notes that they had issued previously. They were paying 3.91% rates, but that matured on September 15, 2023. Being fixed rate means they won’t be able to benefit from rate decreases that are projected in the coming years.
Attractive Discount And Comparison To ZTR
The first comparison that would come to mind as being a similar fund for me is the Virtus Total Return Fund (ZTR) that I covered recently. Additionally, the Allspring Utilities and High Income Fund (ERH) would also come to mind, but ZTR is fresh in my memory, so the comparisons will be to that fund.
As a side note on ERH, the name of the fund is appreciated as it represents what you are getting into upfront. When looking at Franklin Universal Trust and Virtus Total Return Fund, you might get a sense that these are diversified funds or multi-asset funds, at least in my opinion.
Though with that said, ZTR invests similarly to FT with a utility and fixed-income sleeve. However, ZTR covers a broader spectrum of credit quality in its fixed-income sleeve, whereas FT is focused primarily on high-yield instruments.
Additionally, ZTR has favored a 60/40 split with equity utility positions comprising the largest portion of its portfolio and keeping the fixed-income exposure smaller. FT takes a bit of the reverse of this with around a 40/60 split and favoring the fixed-income sleeve over the utility sleeve. To be more specific, the latest breakdown was 62.29% fixed income and 34.54% equities, with cash at 3.17%.
FT Asset Allocation (Franklin Templeton)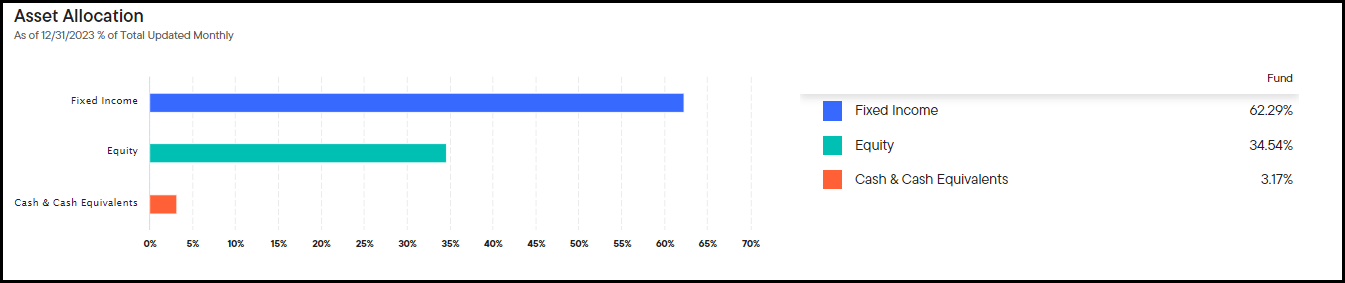
That will clearly make these funds deviate over longer periods of time. That said, over the last decade, the results on a total NAV return basis have come quite close. Throughout the last decade, we can see that ZTR had been outperforming FT, but more recently, it switched with FT coming out on top.
YCharts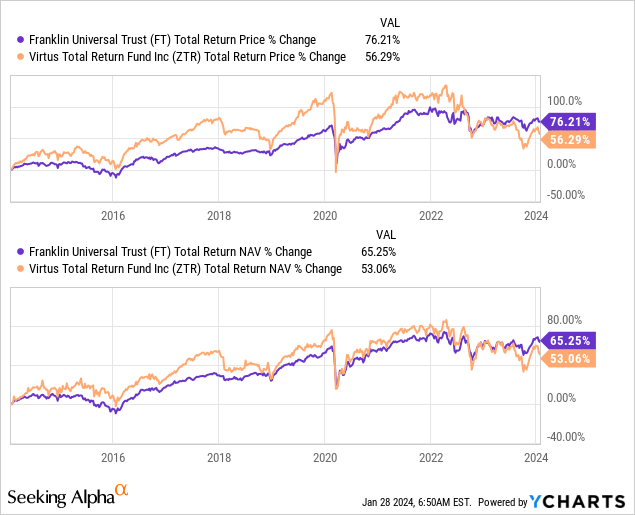
On a total share price return basis, we can also see that the outperformance of ZTR was significantly higher. The reason for this was that ZTR just tended to command a higher valuation relative to FT. ZTR had frequently traded at or above its NAV per share, except for when they cut their distribution last year. That sent the fund tumbling, and lo and behold, now FT was outperforming on a total share price and NAV basis.
YCharts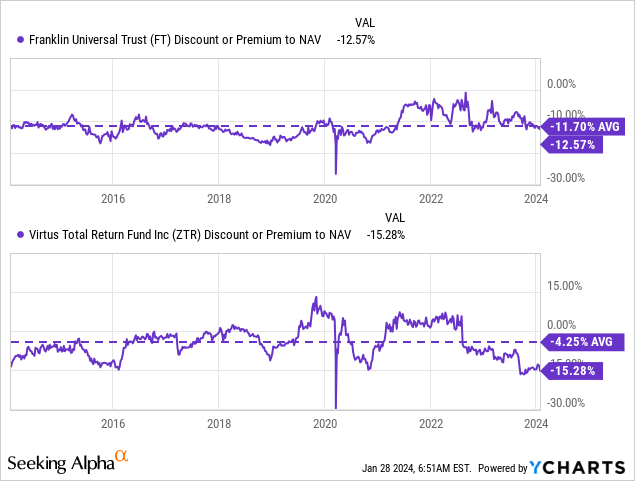
This is yet another reminder of why premiums and high distribution rates don’t mix. This isn’t always the case with high-yielding funds, particularly when they are paying out unsustainable rates. Eventually, those higher valuations catch up with the fund when a distribution is unsustainable.
If I were to pick between the two here, I’d probably rather invest in ZTR purely based on a valuation basis. With that being said, FT is also trading at a fairly attractive valuation and is trading below its longer-term average. Based on more recent history, it’s trading at an even greater relative discount as the last 1-year average comes to -9.53%, and the 3-year average is -8.55%.
However, an argument could be made that the funds are different enough. So, drawing a comparison directly between the two doesn’t make sense, and investing in both could still provide sufficient differences for an investor.
In the end, despite the differences between the funds in terms of specific allocations, they are both sensitive to interest rates. That leaves them in a similar situation where their annualized results are fairly poor at this point.
FT Annualized Performance (Franklin Templeton)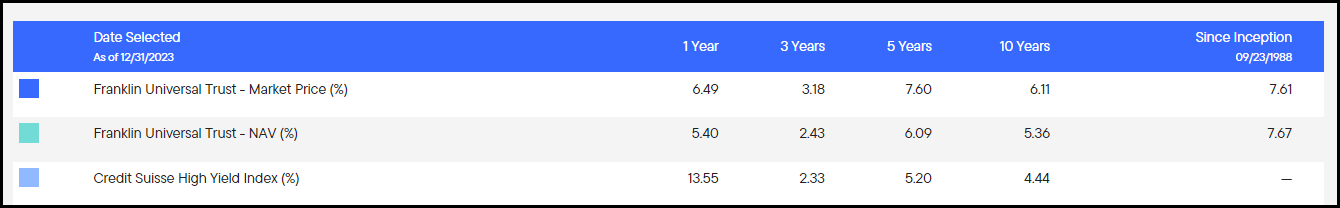
Utilities have been crushed due to higher rates, keeping their yields less attractive compared to risk-free rates. Additionally, utilities have significant CAPEX and tend to carry large debt loads. Those debt loads are going to have to be refinanced at significantly higher rates.
FT may be a bit less interest rate sensitive due to focusing on high-yield instruments, and they have more credit risk compared to investment-grade bonds. High yields and shorter maturities can help keep durations more minimal on a relative basis. Reflecting that is the fund’s 2.85 year effective duration that they have listed. For every 1% change in rates, the fund’s underlying portfolio should increase or decrease around that amount.
Suffice it to say, since I felt that ZTR’s future could look a little brighter with interest rate cuts looking like a real possibility, FT is in a similar situation. The underlying portfolio should benefit from a decrease in rates as income-producing investments such as utilities become more attractive – and it eases up some of the concerns with the cost to refinance. High-yield bonds could also see a bit of a lift when risk-free rates go lower, and investors start a search for higher-income alternatives once again.
Distribution Discount Bump
One of the reasons buying funds at a discount is appealing besides buying assets on sale is the ‘enhanced’ distribution rate that investors receive. That is, relative to what the fund has to earn compared to what investors investing today receive. For FT, the distribution rate comes to 7.88%, but the underlying portfolio has to earn 6.89% to have it covered. That’s nearly a 100 basis point difference in favor of investors.
In my opinion, the fund’s distribution has been fairly remarkably consistent.
FT Distribution History (CEFConnect)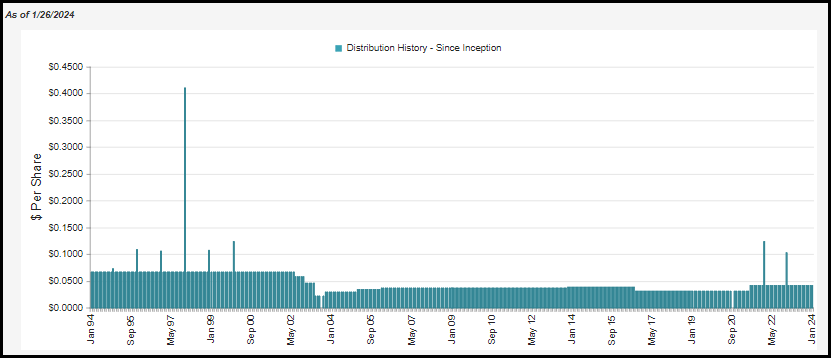
There have been a few adjustments, but there were really only significant changes going back to the dot-com bust of the early 2000s. Generally, we see that sort of chop in the distribution throughout the Global Financial Crisis of 2008/09. Though perhaps since the fund did most of the adjusting in the prior crisis, they didn’t need to cut during the GFC – they simply just didn’t raise it back as aggressively as they otherwise could.
Anyway, that’s all ancient history and irrelevant to where we are now. What is important is where we are now and what the outlook is. Despite the fixed-rate financing they’ve secured being at a higher rate, they’ve been able to see net investment income increase. They invest in some floating rate securities, some utilities that increase their dividends regularly, and portfolio turnover could have all led to the offset of the higher costs.
FT Annual Report (Franklin Templeton)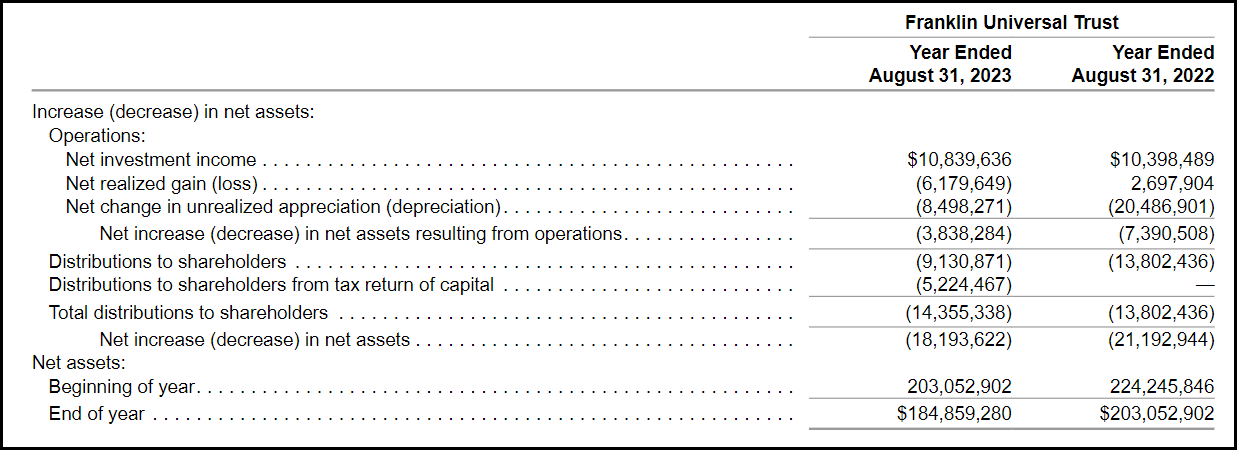
To get a better idea of the NII, we can look at the per share, which came in at $0.43 for fiscal year-end 2023. That was up slightly from the $0.41 in the prior fiscal year. Based on the annualized current distribution of $0.51, that would work out to coverage of 84.3%.
That’s fairly high for a closed-end fund but also somewhat consistent with the split this fund carries. Since they are favoring high-yield bonds in most of their portfolio, that sleeve should ideally cover itself. In fact, this is higher or in line with the coverage figure of some high-yield bond CEFs currently.
Then, on the equity sleeve, we often see most of the distribution covered by capital gains. Though capital gains are still required, thanks to the relatively low NAV rate, it seems like a more than manageable and reasonable payout to investors.
For tax purposes, the fund has listed ordinary income as the primary classification for its distribution. This can make sense when you consider the portfolio is heavily geared towards interest-generating debt investments. However, the last fiscal year also saw a good portion of return of capital characterized in its payout.
FT Distribution Tax Classification (Franklin Templeton)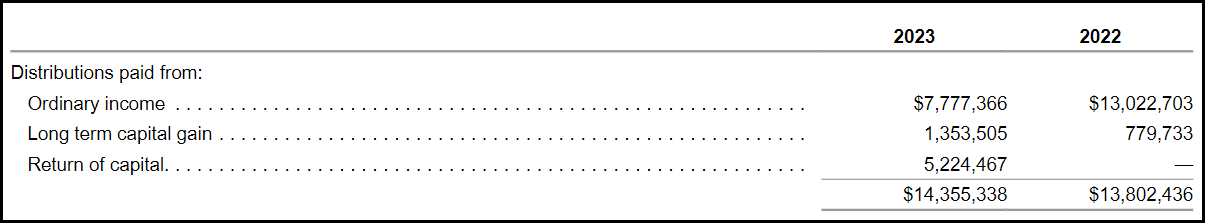
It’s not that they didn’t have enough unrealized appreciation in the underlying portfolio; they listed ~$29 million in unrealized appreciation in the report. They could have ‘covered’ it by showing long-term capital gains, but that doesn’t always make the most financial sense. You can sell losers and let your winners ride on, thereby creating a situation that leads to ROC distributions.
FT’s Portfolio
We already discussed the basic composition of the fund throughout this article, so we’ll focus on a few last points that we haven’t touched on yet.
In total, the fund invests in 335 holdings. However, it could be listed at thousands like CEFConnect shows 3091.
This is because the portfolio not only invests in bonds but in marketplace loans as well. This comprises only 6% of the fund as of their last annual report. These are loans that have principal amounts of a few dollars to sometimes up to $20k or $30k. These instruments also carry some massive rates that can push over 30%.
There is such a wide range and thousands because these are basically personal loans to individuals. This is through a “method of financing in which a platform facilitates the borrowing and lending of money.” One of those platforms makes an appearance in the fund’s top ten as well; that’s the “UPSTART 4002” listing we can see below.
FT Top Ten Holdings (Franklin Templeton)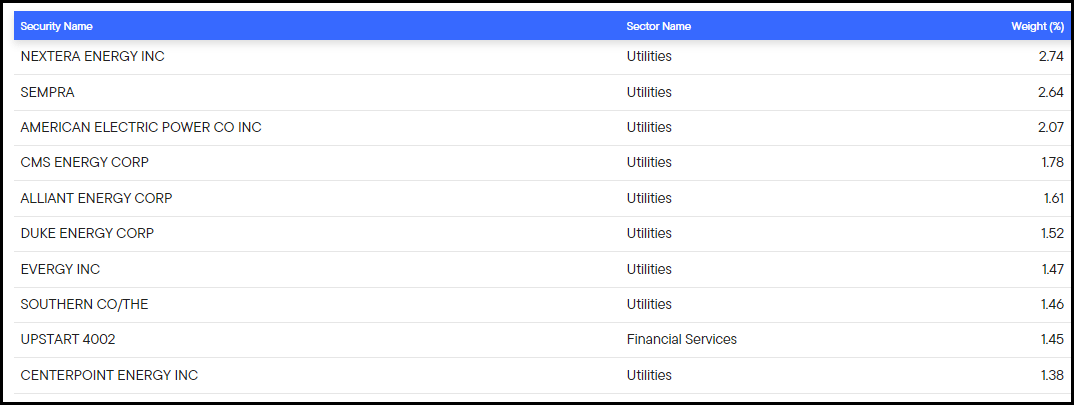
These are unsecured loans, and there will be a number of defaults – sometimes a fairly high number of defaults, with the default rate sometimes over 10%. These default rates can vary wildly, though, depending on the platform, location, and current economic conditions. So, finding one average number was difficult when searching.
However, the general idea is almost the same as high-yield corporate bonds. You will have defaults and non-payments, but you are compensated with a higher interest rate/yield to take on that risk. The hope is that the good loans/bonds are able to offset the ones that go bad. For marketplace lending, it’s just spread out amongst thousands of individuals who pay incredibly high rates for stuff they probably don’t need.
In the grand scheme of things, this isn’t a large portion of the fund at only 6%. The more conventional corporate bonds that investors are probably more familiar with made up 76.7% of the fund, with equities making up 46.9%. There are negligible positions allocated to preferred, asset-backed securities and senior notes. These three categories combined represent just over 1% of the fund’s investments.
In total, these breakdowns are over 100% because of the leverage the fund employs. We shared the table showing the weighting above for the fund when adjusted for the leverage.
Despite equities making up a smaller portion of the fund, it is much more concentrated than the high-yield positions. In total, it was easy to count the total number of equity names simply because there weren’t that many, and that came to 35 names. Given the higher concentration, it isn’t too surprising then to see that utilities are heavily represented in the top ten of the portfolio. At the same time, the fund seems more than diversified enough, even with a relatively more concentrated utility equity portfolio, given the percentage weights we see above.
Conclusion
FT provides an interesting portfolio with exposure to high-yield debt instruments while also having a minor sleeve of equity investments in the utility sector. This provides a fairly stable and predictable stream of income generation for investors. The modest distribution rate of FT translates to some solid distribution coverage, with a fairly reasonable amount needing to be covered through capital gains.
The discount for the fund is somewhat attractive on an absolute basis, and I’d even consider it attractive on a relative basis. However, that’s more specific to the near-term averages. Over the long term, the discount is trending around its usual level, making it overall fairly valued.
Editor’s Note: This article covers one or more microcap stocks. Please be aware of the risks associated with these stocks.

 Q2 2024 Earnings Call Transcript")

