Dragon Claws
ETF Overview
The iShares Fallen Angels USD Bond ETF (NASDAQ:FALN) seeks to provide investors with investment results which correspond to the Bloomberg U.S. High Yield Fallen Angel 3% Capped Index. The index is designed to reflect performance of U.S. dollar-denominated, high yield corporate bonds that were previously rated investment grade.
FALN currently has ~$1.3 billion in net assets and charges an expense ratio of 0.25%. The fund currently holds 209 different securities, has an average yield to maturity of 8.14%, a 30 Day SEC Yield of 8.17%, and an effective duration of 4.74 years.
FALN is well positioned to take advantage of forced selling that occurs when a company’s credit rating gets downgraded from investment grade to junk. The fund has exhibited very strong risk adjusted returns compared to traditional high yield ETFs suggesting the structural edge related to fallen angel investing is persistent and strong. For this reason, I believe FALN represents an excellent way for investors to get exposure to the high yield bond market.
Investment Strategy
The idea behind the fallen angels strategy is that junk bonds which were previously rated investment grade have a lower probability of default than bonds which were rated high yield at issuance. Despite the relatively high quality nature of many fallen angel issuers, some regulated institutional investors including some insurance companies are forced to sell as they cannot hold bonds rated below investment grade. Additionally, some insurance companies and banks face a significantly larger capital charge for holding junk bonds compared to investment grade bonds and often sell in the event of a credit downgrade.
Reasonable Management Fee
FALN charges an expense ratio of just 0.25%. To put that into context, the average fixed income ETF expense ratio is ~0.11%.
While FALN is more expensive than the average fixed income ETF, it allows investors to get exposure to a segment of the market which is difficult to access. FALN appears reasonably priced compared to its closest peer the VanEck Fallen Angel High Yield Bond ETF (ANGL) which has an expense ratio of 0.35%. FALN is attractively priced compared to other high yield products such as the SPDR Bloomberg High Yield Bond ETF (JNK) and the iShares iBoxx $ High Yield Corporate Bond ETF (HYG) which have expense ratios of 0.40% and 0.49% respectively.
Strong Historical Performance
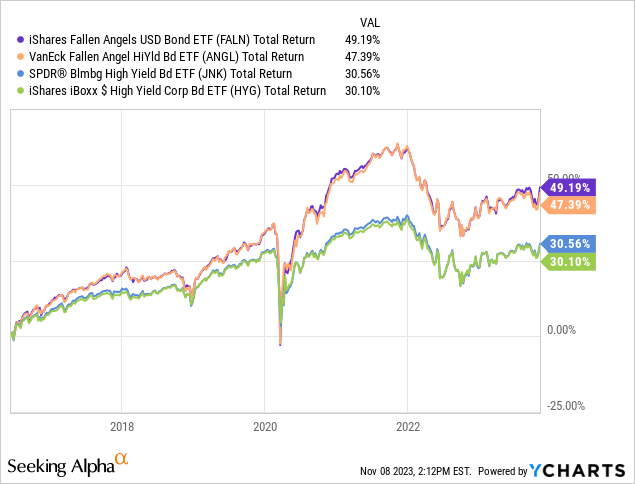
FALN launched in June 2017 and has significantly outperformed other traditional corporate high yield since then. Since inception, FALN has delivered a total return of 49.2% compared to a total return of 30.5% delivered by JNK and a total return of 30.1% delivered by HYG. In addition to outperforming these ETFs, FALN has also outperformed its closest peer ANGL by 1.8%.
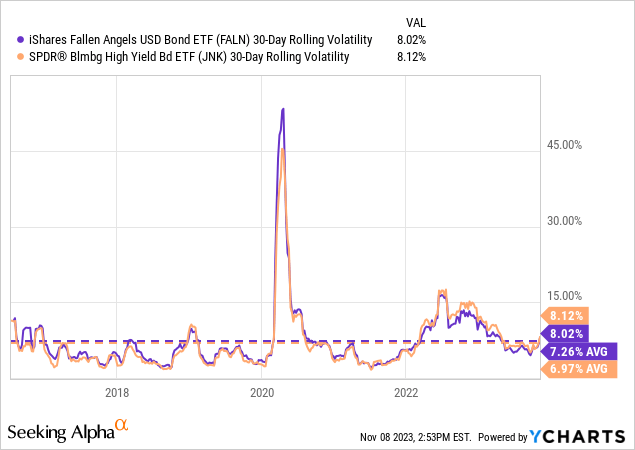
FALN’s outperformance of traditional high yield ETFs such as JNK if even more impressive when considering FALN has realized roughly the same average volatility as JNK. Thus, in addition to outperforming on an absolute basis FALN also has outperformed on a risk adjusted basis.
Holdings Analysis
FALN is well diversified with the top 10 issuers accounting for 15.3% of the total fund.
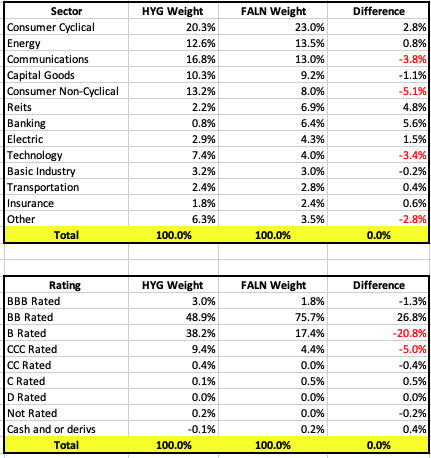
To get a sense of how FALN compares to traditional high yield ETFs such as HYG, it is useful to compare sector and credit ratings. As shown by the table below, on a sector basis FALN has significant overweights in banking and REITs relative to HYG. These overweights are offset by underweights to the consumer non-cyclicals, communications, and technology sectors.
While the sector differences are meaningful, FALN really stands out for its different average rating profile vs HYG. FALN has significantly more exposure to BB rated credits than HYG (75.7% compared to 48.9%) which is offset by less exposure to B and CCC rated credits. Thus, based on credit ratings FALN appears to exhibit a higher quality portfolio than HYG.
iShares Author (data from iShares)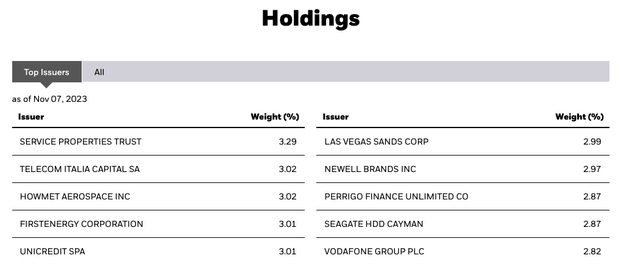
Slightly Lower Yield Than Traditional High Yield ETFs
As discussed in the previous section, FALN has a higher quality credit portfolio than HYG. The market is aware of this and thus FALN offers slightly less credit spread compared to HYG.
Currently, JNK has an average yield to maturity of 8.68% compared to 8.14% for FALN. This difference is driven by credit spreads as JNK has an option adjusted spread (“OAS”) of 371bps compared to a 322bps for FALN.
Future Performance
I expect FALN’s long-term risk adjusted historical outperformance of traditional high yield ETFs to continue. FALN’s strong historical performance through multiple investing environments suggests the structural edge related to fallen angel investing is strong and consistent. Moreover, the total combined assets of FALN and its peer ANGL is just $3.8 billion. Comparably, other traditional high yield ETFs have a much high level of assets. JNK and HYG combined currently have $21.7 billion in assets.
Risks To Consider
The primary risk consider when investing in FALN (or any other high yield ETF) is credit risk. While FALN holdings are focused on the higher quality part of the high yield market, the fact remains that FALN holds high risk corporate bonds. In the event of a recession, FALN could experience significant losses. Investors who hold FALN should continue to actively monitor the macroeconomic environment.
Another risk to consider as it relates to FALN is the possibility that the market becomes more efficient in the way it prices “fallen angles.” Given the strong historical performance of fallen angel products such as FALN relative to other high yield bonds, investors may seek to invest more aggressively in fallen angel bonds. Significant inflows into the strategy may drive up the price of fallen angel bonds vs other high yield bonds. The result of this may be a loss of structural edge for the fallen angel strategy. In order to monitor this risk investors should do a few things.
First, investors should monitor the difference in yield between FALN and traditional high yield ETFs such as HYG as a wider yield differential may indicate a change in relative credit pricing. Second, investors should keep an eye on relative performance of FALN vs traditional high yield ETFs to see if the structural edge continues to persist. Finally, investors should also monitor the total assets invested in FALN and ANGL compared to traditional high yield funds such as JNK and HYG.
Conclusion
In a world where many new ETFs have come to market offering very high fees for products that fail to deliver, FALN stands out as a great ETF which has delivered on its objectives while charging reasonable fees.
FALN allows investors to benefit from forced selling of high quality that get downgraded.
FALN has a very strong history of outperforming traditional high yield ETFs such as HYG and JNK on both an absolute and risk adjusted basis. FALN has also outperformed its closest peer ETF ANGL.
FALN offers higher quality high yield corporate bond exposure compared to traditional ETFs. The market is aware of the quality difference between FALN’s holdings and traditional ETFs such as HYG and thus FALN carries a slightly lower yield than traditional high yield ETFs (0.54% lower average yield to maturity.) However, historical performance has shown that that difference is more than accounted for by the higher quality nature of FALN’s portfolio.
I believe FALN represents an excellent way for investors to get exposure to the high yield corporate bond market. FALN has a very strong historical performance compared to other high yield products and I expect this to continue going forward. However, investors should continue to monitor yields, assets, and performance relative to traditional high yield ETFs to ensure the structural edge remains in place.


