SweetBunFactory
Entegris, Inc. (NASDAQ:ENTG) released its latest report on February 13. ENTG was able to beat estimates for the top and the bottom line, although guidance was somewhat softer than expected, but that was arguably not what took the spotlight. What did was ENTG’s latest revision to its financial model for the FY2023-2026 period in the latest call. Why will be covered next.
Why ENTG may soon encounter resistance
A previous article from July 2023 rated ENTG a hold after concluding that the stock could be due for a move downwards with an earnings report due, especially if it failed to deliver on further improvements which had caused the stock to rally off the lows in late 2022. The stock had almost doubled by then, which raised the likelihood the stock could be due for a change in direction.
Source: Thinkorswim app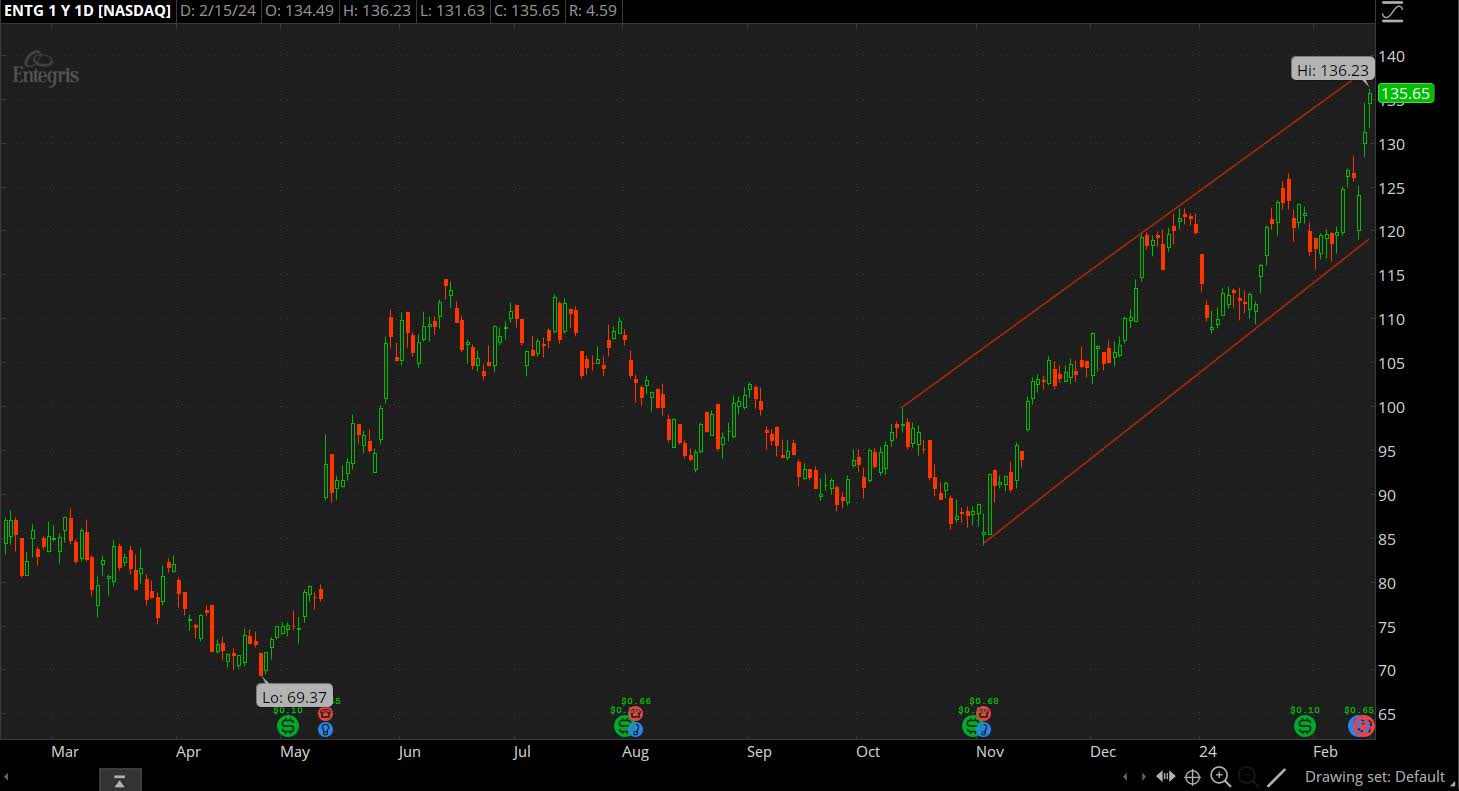
The chart above shows how the stock headed down starting in early August. The decline continued until early November when another earnings report put the stock on a different course. The stock market also went on a rally that has yet to end, which provided an additional boost to ENTG. However, the stock turned flattish in 2024.
Note how the stock struggled in the $120-125 region in recent weeks. ENTG got to this region in late December, but until a few days ago, the stock had all sorts of problems getting past this region. This was not by accident. Recall how the stock has gradually trended higher after hitting a multi-year low of $61.75 in November 2022.
Source: Thinkorswim app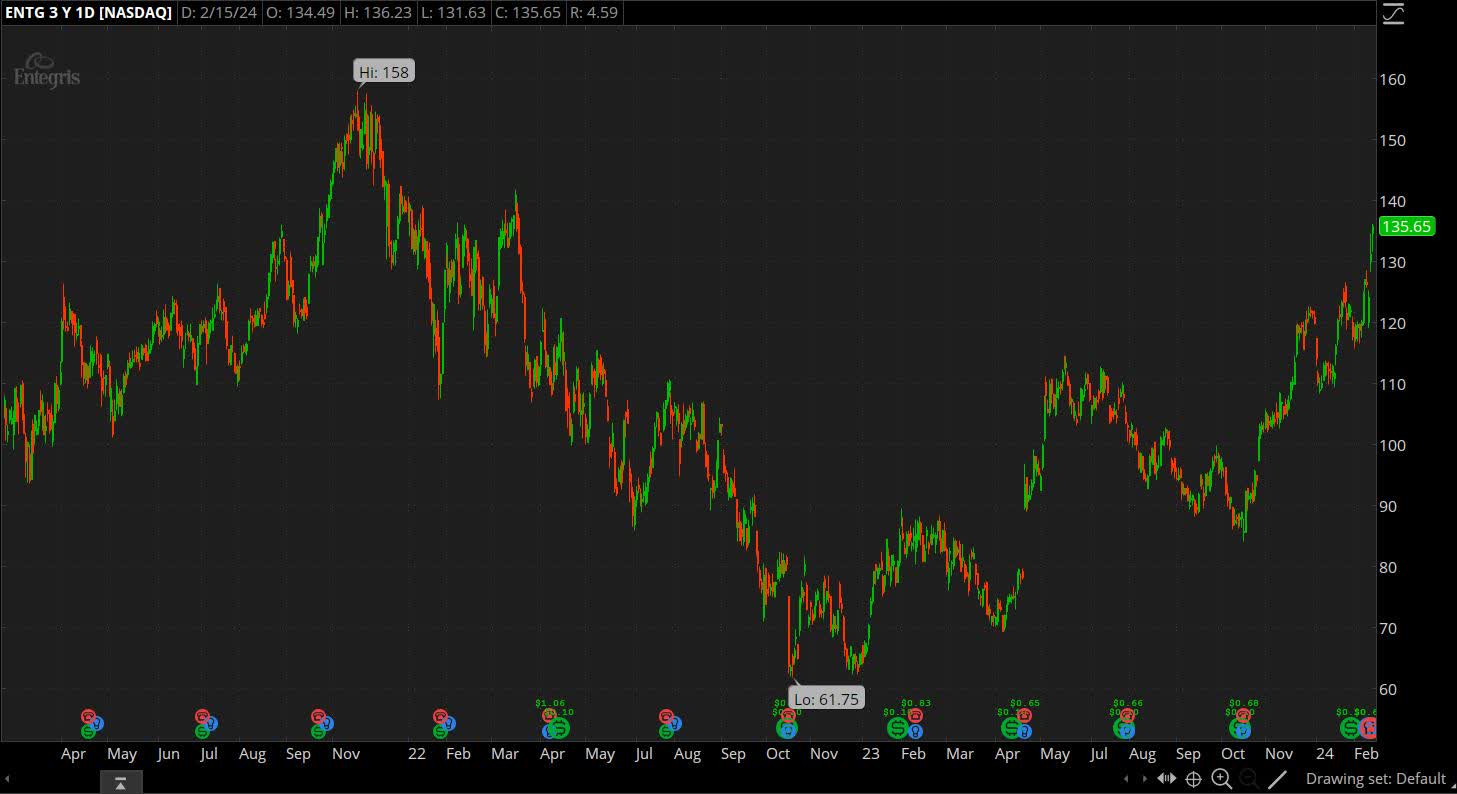
This uptrend was preceded by a downtrend that started with the stock hitting an all-time high of $158.00 in November 2021. If we then assume the current uptrend is a retracement of this downtrend, then it is interesting to note that the 61.8% Fibonacci retracement of the downtrend, starting with the November 2021 high of $158.00 and ending with the November 2022 low of $61.75, is $121.23.
This is within the $120-125 region, which puts the stock’s struggles in this region in a different light. Note also that the 50% Fibonacci retracement of the aforementioned downtrend is $109.88, which is close to the $110 price level where the stock also spent a lot of time as shown in the previous chart. The stock spent weeks hovering in or around the $110 price level in January 2024 and June-July 2023, for example.
However, the sideways action of the last two months or so came to an end on February 14. The stock has broken through what appears to have been resistance at the 61.8% Fibonacci retracement level. On the other hand, it’s worth reminding that the current uptrend in the stock started in early November as mentioned earlier, and if the highs and the lows are connected by trend lines, then an ascending channel appears.
The stock is closing in at the upper bound of the channel, which may slow down further gains, if not trigger a pullback after the rally. Keep in mind the stock is now overbought with an RSI reading over 70 after spiking higher in recent days. Note also that the next Fibonacci level, the 76.4% Fibonacci level, can be found at $135.29, which is close to where the stock closed on February 15 at $135.65. Bulls may want to position themselves accordingly with the above in mind.
Why the Q4 report was a mixed bag in spite of the spike
The stock soared higher after the Q4 report on February 13, but it is worth mentioning that the latest report came in mixed. The consensus was expecting Q1 guidance to call for non-GAAP EPS of $0.63 on revenue of $793M, but guidance came in somewhat below expectations with earnings of $0.60-0.65 on revenue of $770-790M. The table below shows guidance for Q1 FY2024.
|
(GAAP) |
Q1 FY2024 (guidance) |
Q1 FY2023 |
YoY (midpoint) |
|
Sales |
$770-790M |
$922.4M |
(15.44%) |
|
Net income |
$42-49M |
($88.2M) |
– |
|
EPS |
$0.28-0.33 |
($0.59) |
– |
|
(Non-GAAP) |
|||
|
Sales |
$770-790M |
$922.4M |
(15.44%) |
|
Net income |
$91-98M |
$97.8M |
(3.37%) |
|
EPS |
$0.60-0.65 |
$0.65 |
(3.85%) |
Source: ENTG Form 8-K
On the other hand, ENTG did beat estimates for the top and the bottom line in Q4 and some may be thinking ENTG is being conservative with its latest Q1 guidance. The consensus expected non-GAAP EPS of $0.58 on revenue of $781M, but ENTG reported $0.65 on revenue of $812.3M. Adjusted EBITDA was $210.8M, down 10.4% QoQ and 19.3% YoY. The table below shows the numbers for Q4 FY2023 on a QoQ and YoY basis.
|
(Unit: $1000, except EPS) |
|||||
|
(GAAP) |
Q4 FY2023 |
Q3 FY2023 |
Q4 FY2022 |
QoQ |
YoY |
|
Sales |
812,291 |
888,239 |
946,070 |
(8.55%) |
(14.14%) |
|
Gross margin |
42.4% |
41.3% |
42.8% |
110bps |
(40bps) |
|
Operating margin |
12.4% |
13.2% |
15.2% |
(80bps) |
(280bps) |
|
Operating income |
101,017 |
117,061 |
143,776 |
(13.71%) |
(29.74%) |
|
Net income (loss) |
37,977 |
33,212 |
57,427 |
14.35% |
(33.87%) |
|
EPS |
0.25 |
0.22 |
0.38 |
13.64% |
(34.21%) |
|
Weighted-average shares outstanding |
151,331K |
151,229K |
149,909K |
0.07% |
0.95% |
|
(Non-GAAP) |
|||||
|
Sales |
812,291 |
888,239 |
946,070 |
(8.55%) |
(14.14%) |
|
Gross margin |
42.4% |
41.4% |
42.8% |
100bps |
(40bps) |
|
Operating margin |
20.7% |
22.0% |
23.2% |
(130bps) |
(250bps) |
|
Operating income |
168,268 |
195,715 |
219,353 |
(14.02%) |
(23.29%) |
|
Net income |
97,943 |
103,588 |
124,451 |
(5.45%) |
(21.30%) |
|
EPS |
0.65 |
0.68 |
0.83 |
(4.41%) |
(21.69%) |
|
Weighted-average shares outstanding |
151,331K |
151,229K |
149,909K |
0.07% |
0.95% |
|
Adjusted EBITDA |
210,826 |
235,346 |
261,235 |
(10.42%) |
(19.30%) |
Source: ENTG Form 8-K
If the Q4 numbers are out, then so too are the numbers for all of FY2023. FY2023 revenue increased by 7.4% YoY to $3,523.9M and non-GAAP EPS declined by 29.2% YoY to $2.64. Keep in mind that FY2023, unlike FY2022, included a whole year of contributions from the addition of CMC Materials, a cash and stock transaction worth about $5.7B.
The latter explains the increase in the number of shares outstanding as shown in the table below. Adjusted EBITDA was $942.3M in FY2023, down 3.2% YoY, but it also does not include interest expense which reached $301.1M in FY2023. ENTG finished with cash, cash equivalents, and restricted cash of $456.9M, offset by $4.7B of total debt.
The latter is mostly the result of the CMC acquisition. However, debt is also down by $1.3B after ENTG conducted several business transactions to raise cash in order to pay off debt. These transactions in the past year included the sale of QED to Quad-C, the sale of the electronic chemicals business to Fujifilm, and the revised distribution agreement with Element Solutions.
|
(Unit: $1000, except EPS) |
|||
|
(GAAP) |
FY2023 |
FY2022 |
YoY |
|
Sales |
3,523,926 |
3,282,033 |
7.37% |
|
Gross margin |
42.5% |
42.5% |
– |
|
Operating margin |
14.2% |
14.6% |
(40bps) |
|
Operating income |
499,158 |
479,981 |
4.00% |
|
Net income (loss) |
180,669 |
208,920 |
(13.52%) |
|
EPS |
1.20 |
1.46 |
(17.81%) |
|
Weighted-average shares outstanding |
150,945K |
143,146K |
5.45% |
|
(Non-GAAP) |
|||
|
Sales |
3,523,926 |
3,282,033 |
7.37% |
|
Gross margin |
42.7% |
44.4% |
(170bps) |
|
Operating margin |
21.8% |
25.5% |
(370bps) |
|
Operating income |
769,672 |
837,850 |
(8.14%) |
|
Net income |
398,918 |
534,170 |
(25.32%) |
|
EPS |
2.64 |
3.73 |
(29.22%) |
|
Weighted-average shares outstanding |
150,945K |
143,146K |
5.45% |
|
Adjusted EBITDA |
942,355 |
973,221 |
(3.17%) |
Source: ENTG Form 10-K
Note that there is room for more of these transactions to pay down debt. For instance, the pipeline and industrial materials or PIM unit is still part of ENTG after Infineum declined to proceed with the acquisition of PIM for $240M. On the other hand, ENTG is still interested in further mergers or acquisitions, which could increase debt. From the Q4 earnings call:
“Moving past the near-term, we will seek to complement our organic growth with strategic acquisitions. We have a track record of creating shareholder value through M&A. So, expect us to remain active on that front at the appropriate time. We will, of course, continue to pay a dividend. And we may consider share repurchases in the future. But for now, share repurchases remain on hold.”
Source: ENTG earnings call
ENTG updates its financial model for the coming years
However, it was the updated financial model that was arguably the star of the show. Key to this model on page 19 is the belief in the need for better performance in the chips the world uses. A key way to accomplish this is through smaller transistors, which in turn drives the need for better materials and enhanced purity, both of which are aspects ENTG focuses on. The model also assumes PIM will be disposed of, and it is therefore not included in the model, on top of those units that have already been disposed of in recent months.
Accordingly, the revised financial model presented by ENTG sees sales growing at a CAGR of 11% in FY2023-2026. EBITDA is projected to grow at a CAGR of 15% and interest expense will be halved to around $160M by FY2026. The result is FY2026 sales of around $4.2B, leading to non-GAAP EPS of $5.00. In other words, earnings are expected to more than double in the next three years.
ENTG has traded at a forward multiple of around 30x for the last 5 years, on average. Apply a multiple of 30x to EPS of $5.00 gets you to a stock price of $150. In contrast, the stock is 10% below $150 at the moment. In FY2024, ENTG is projected to earn $3.30 on revenue of $3.5B, assuming no contributions from the PIM unit. This implies a forward non-GAAP P/E multiple of 41.1x with the stock priced at $135.65. In comparison, ENTG currently trades at a trailing P/E multiple of 51.4x with non-GAAP EPS of $2.64 and a stock price of $135.65.
Investor takeaways
The market has given the latest report from ENTG a thumbs up. The rally of the last few months had stalled, and the stock was looking for direction, which it got with the Q4 report. However, if the Q4 report did not come with a revised financial model for F2023-2026, the market reaction could have been much less positive.
Guidance was actually soft and below expectations, even if it got overshadowed by the latest financial model. However, the financial model made up for it. The model basically calls for earnings to more than double in the next three years, which more than offsets any backlash the weaker-than-expected guidance may have triggered.
ENTG made a major acquisition at what could be argued was a bad time, just as the industry went into a downturn. ENTG leveraged itself at a time when it was best not to. But the financial model sees ENTG improving itself by not only growing earnings, but also by deleveraging itself. Interest payments reached over $300M in FY2023, but this is expected to be cut in half by FY2026.
ENTG has been able to address its balance sheet, which was arguably something people worried about most. ENTG has reduced debt, which stood at $6.1B after the CMC acquisition, to $4.7B and this number is likely to drop even further in the near term. ENTG was able to accomplish this through asset sales to quickly raise cash, something that could continue when the PIM unit is disposed of.
The stock has soared higher in the days following the Q4 report, but there is reason to believe the stock is due for a pullback. For starters, the stock is very overbought. The stock has trended higher since bottoming last November, but the stock is now close to the upper half of the ascending channel. The trend suggests the recent spike does not have much more to go.
I am thus neutral on ENTG. ENTG is predicted to make strong gains in the coming years, including earnings, but much, if not all of this has essentially been baked into the stock. Momentum followers may want to follow the trend, especially if the stock pulls back to keep the channel intact. Others may want to take heed that the stock is running hot and likely due for a pullback soon.

 Q2 2024 Earnings Call Transcript")

