Foreword
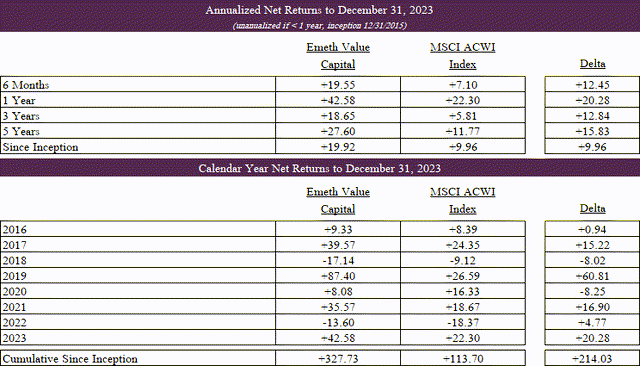
I intend to share the updated results at the outset of each letter. It is worth reiterating that I ascribe little significance to short term results. I look out many years when making investments for the partnership and believe our results are best weighed using a similar time horizon.
A Dangerously Reasonable Price
I’ve made the comment before that the value investing industry has had irreparable damage and is unlikely to recover in a material way. But the corollary of that is that value investing for those that remain, I think is an extraordinarily exciting time. Let me explain the way that I would have tended to look at things a long time ago, which our business was buy things that are sort of cheap, figure out that they are going to be a bit better than the world generally understands, and wait. So the very simple math is if a stock is $10 and the world thinks it’s going to earn a buck, and you think it’s going to earn $1.15… and you wait for a year and they’ve made $1.15 instead of a buck and now it looks like they’ll earn $1.35 the following year, and you get a 13x multiple on the $1.35 and you paid a 10x multiple on the $1, then you’ve just made 60-70% over 18 months. Now, if you play out that same story today, it’s an 8x multiple instead of 13x, and at the end of that 18 months you’ll have made 6% on you money not 60%. The problem is those fundamental buyers simply aren’t there anymore, they’ve been turned passive. So, where does that leave us and how have we adjusted our strategy? What we’re doing now is we’re saying, what do we have to do to make a good return if a tree falls in a forest and nobody is there to hear it? You have this enormously bifurcated market, there is a wasteland of companies where literally nobody’s paying attention and nobody’s following. So, instead of buying at 10x earnings because you think earnings are going to be x in the future, you can buy that same type of situation at 5x earnings, and at that point what others think matters less. If companies are taking the vast majority of that earnings yield and giving it back to you in dividends or buybacks, this has to work itself out over time in a favorable way.
You have to build a portfolio of companies that are so cheap and so unloved it will be difficult to lose. (David Einhorn)
One of the great challenges in public markets investing is that the feedback loop between process and outcome can at times be painfully long. We know, mathematically, that over the extreme long run an investment in a stock earns the return of the business that underlies it. However, in practice, the journey rarely feels so consonant. One of the principal reasons for this is that in the initial stages of compounding, when an investment’s growth is still somewhat linear, stock performance is far more influenced by multiple expansion or contraction rather than fundamental performance.
Consider a hypothetical investor who pays a market multiple, or 16x, for stock in a company they believe can sustainably compound earnings at twelve percent per annum; in other words, a reasonable price for a business that grows at double the long-term market average.
While oversimplified, one way we can frame the process-outcome disconnect is as a measure of time. The graphic above calculates how many years of compounding are “lost” based on certain levels of growth and multiple compression. If we assume our hypothetical investor’s analysis is flawless, and that indeed the business does compound earnings at twelve percent per annum, the result is that more than six years of compounding would be erased if the multiple falls to 8x.
This is a significant period of time for any investor. However, after this passage of time the investment would only have returned to breakeven. If this hypothetical investor’s benchmark was over the same period returning seven percent per annum, perhaps driven by a handful of overweight technology stocks, then a re-rating to an 8x multiple would necessitate fifteen years of compounding to reach parity with a market return.
In other words, this hypothetical investor could have (i) paid a reasonable price, (ii) flawlessly underwritten more than a decade of business dynamics, and (iii) still looked incompetent relative to their benchmark for the better part of fifteen years.
This is a startling result as, once more, 16x is not an unreasonable price to pay for the business described; yet as David Einhorn aptly notes, nor is an 8x multiple an unusual sight to see in the current market environment where entire swaths of companies go completely forgotten. It seems that in a market that is prone to irrationality, starting from a baseline of rationality can be a dangerous proposition. Below I highlight one of our portfolio companies, Driven Brands Holdings, where Mr. Market’s irrationality is already in full onset.
Driven Brands Holdings Inc. (DRVN)
Overview
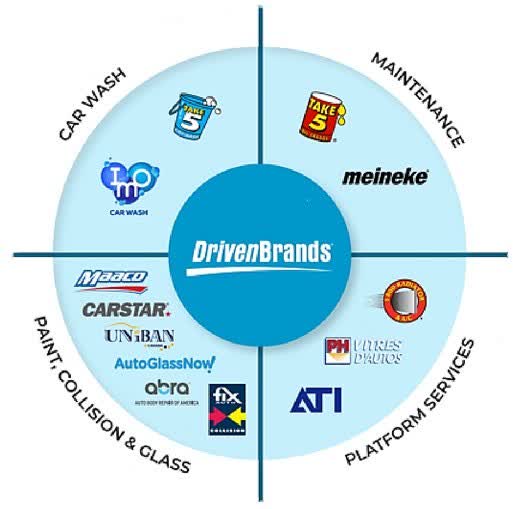
Driven Brands is the largest automotive services platform in North America with more than five thousand corporate owned and franchised store locations operating across quick serve oil change, maintenance and repair, collision, paint, auto glass, auto parts distribution, and car wash. The group serves more than seventy million vehicles annually and owns several of the most recognized brands in the industry, including Meineke, Take 5 Oil Change, Maaco, and Carstar.
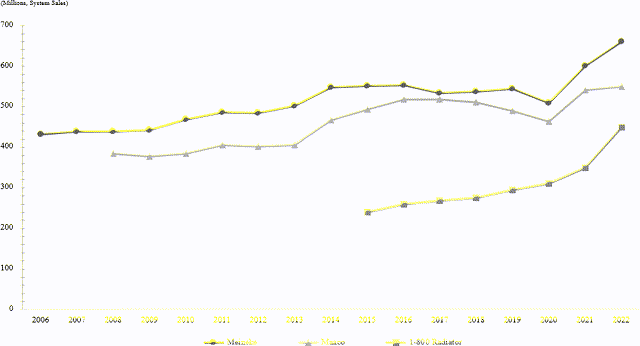
Over the past decade, Driven Brands has expanded its location count by more than threefold, grown its system-wide sales by more than sixfold, and increased profits by nearly fifteenfold. The group is majority owned by Roark Capital, a leading private equity investor in franchise business models, and has been led by Jonathan Fitzpatrick, CEO, since 2012. Fitzpatrick personally owns more than $30 million of Driven Brands common stock and the vast majority of his and his management team’s compensation is tethered to generating long-term shareholder value.
Industry Overview
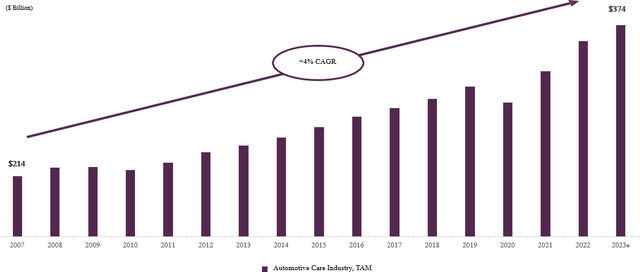
The automotive care industry in the United States is large, growing, and highly fragmented. In aggregate, the total addressable market is estimated to be $350+ billion and encompasses a wide range of services, including automotive repair and maintenance, heavy collision repair, paint, auto glass, and car wash. There is a steadily growing car parc of 285 million vehicles in the U.S., which travel in excess of three trillion miles annually, and the automotive care industry plays a role in keeping this essential transportation infrastructure operating.
The industry has proven to be recession-resistant and has a long track record of consistent growth, having grown at four percent per annum since 2007. In addition, several structural tailwinds will continue to drive predictable long-term industry growth. The number of vehicles in operation, average vehicle age, and vehicle complexity are all increasing, which in turn drives growth in demand for vehicle maintenance and cost of repair. Moreover, the continued shift in consumer preference toward do-it- for-me (DIFM) versus do-it-yourself (DIY) has increased the market for professional services.
With respect to the competitive landscape, the automotive care industry in effectively every sub-segment remains highly fragmented. For instance, roughly eighty percent of auto service locations are comprised of smaller chains and independent shops, which provides scaled multi-site operators (MSOs) significant whitespace for organic and inorganic growth. This bodes well for Driven Brands, as it has the ability to invest in the required technology, infrastructure, and equipment to service more complex cars, and receives preference from insurance carriers and fleet operators who wish to work with nationally scaled and recognized chains.
Company History
Meineke, originally called Meineke Discount Mufflers, was founded in 1971 by Sam Meineke in Houston, Texas. The only major muffler company at the time was Midas (i.e., Muffler Installation Dealers’ Association), and Sam believed there was an opportunity for a midsized operator to gain share by offering better service and unbeatable prices. His intuition proved right. Meineke expanded rapidly over the next decade, opening multiple stores within the first year and beginning to franchise soon after.
In 1983, the British conglomerate GKN plc acquired the company. The years that followed were eventful. In the 1990s, nearly all automakers began building their cars with stainless-steel mufflers, which had dramatically longer lifespans than traditional mufflers. Although Meineke had already begun to diversify into new service offerings, nearly seventy percent of group revenues in 1995 still depended on the muffler replacement business.
Moreover, tensions escalated in 1993 when a group of franchisees filed a lawsuit against Meineke for improper use of advertising funds. While the lawsuit was eventually dismissed in 1998, it became evident that GKN no longer had an interest in supporting the business. As a result, in 2003, Meineke’s executive team organized a $68.5 million management buyout from its long-time British parent company.
With newfound independence and additional growth capital, Meineke successfully pivoted to a comprehensive auto services model over the following years, exited its corporate owned stores, and formally changed its name to Meineke Complete Auto Care. In 2006, when Meineke purchased west coast based Econo Lube N’ Tune for $22.5 million, Driven Brands was born. The acquisition expanded the combined group to over one thousand franchised auto service locations and gave the company a true national footprint with $500 million in system sales.
In 2008, Driven Brands acquired Maaco, which expanded the scope of the platform to include auto body and paint services and increased aggregate system sales by eighty percent to $900 million. The group witnessed steady growth and strong profits over the next several years, and in 2012, Jonathan Fitzpatrick was appointed to succeed the longtime CEO of Meineke. The activity of the group accelerated materially when Roark Capital acquired the company in 2015.
In less than a years’ time, Driven Brands expanded into three new verticals: auto parts distribution with the purchase of 1-800 Radiator, collision with the purchase of Carstar, and quick serve oil change with the purchase of North Florida Lubes. Of note, while Driven Brands had been entirely franchised up until this time, the quick serve oil change segment was led with a corporate owned store model. This allowed the group to move faster in consolidating the fragmented oil change market and retain more profit dollars per unit. Over the next five years, Driven Brands acquired more than three hundred oil change locations and built two hundred greenfield locations.
This included the purchase of the then sixty-five unit Take 5 Oil Change system in 2016. Following this period of rapid growth in the oil change segment, Driven Brands entered another new vertical in 2019, auto glass, with the purchase of Clairus Group in Canada. This added 240 franchised retail auto glass locations in Canada and one of the country’s largest wholesale auto glass distribution businesses.
In addition, in 2019 and 2020, Driven Brands completed two bolt-on acquisitions in its collision segment with the purchase of Abra and Fix Auto USA. This increased the collision segment to 900 franchised locations and $1.5 billion in system sales. Later in 2020, Driven Brands made its entrance into the car wash segment when it merged with another Roark Capital portfolio company, International Car Wash Group (ICWG), the world’s largest conveyor car wash company.
This acquisition brought the combined group to more than 4,000 store locations and $3.8 billion in system sales. Finally, in 2022, Driven Brands made a bold push into the U.S. auto glass market with twelve acquisitions in less than a years’ time. These acquisitions solidified the group as the second largest auto glass retailer in the country behind Safelite, and all stores were consolidated under the Auto Glass Now brand.
As it stands today, the breadth of Driven Brands’ platform not only provides benefits of scale and exposure to different verticals within the auto industry, but also fosters natural resilience. Indeed, the portfolio of brands is diversified across three important spectrums: needs-based versus discretionary, mature versus high growth, and EV-negative versus EV-positive.
Mature Brands
Driven Brands owns several mature brands that consist of entirely franchised store networks and have multi decade histories of providing reliable royalty based cash flows. These include Meineke, which was founded in 1971, Maaco, which was founded in 1972, and 1-800 Radiator, which was founded in 1982. These brands collectively produce more than $1.6 billion in annual system sales, and have been growing in the low-to-mid single digits for many years. Driven Brands, as the mothership, earns a five to eight percent royalty on each unit’s sales with no associated cost or capital expenditure.
Each company operates in a distinct auto sub- segment. Meineke competes in the general automotive repair and maintenance industry, which consists of more than eighty thousand independent general repair shops and fifteen thousand dealership facilities.
Meineke’s 790 locations, and approximately one percent market share, establish the group as one of the largest players in this highly fragmented segment. Furthermore, because Meineke is positioned as a comprehensive dealership alternative, their broad offering of services competes with specialist auto locations that offer a specific service, such as tires or oil changes. This increases the scope of Meineke’s addressable market to more than 120 thousand service locations in the U.S.
In recent years, Meineke’s location count has remained relatively stable, while comparable store sales have increased mid-single digits. Maaco offers cosmetic body work and painting services at a much lower price point than insurance-driven collision centers, providing an economic option for customers who are paying out of pocket for elective repairs or who do not want to file a claim. Notably, Maaco has a strong commercial fleet services business that works with some of the largest fleet operators in the nation, such as Amazon (AMZN), to provide vehicle painting, rebranding, and cosmetic repair.
These national relationships are a significant positive for Maaco franchisees, as they provide a base level of recurring revenues. The addressable market for cash autobody repair and painting services in the U.S. is estimated to be approximately $10 billion, and Maaco’s network of 415 stores has a significant market share. Although Maaco’s location count has decreased in recent years, the decline has been more than offset by increases in comparable store sales. 1-800 Radiator is a wholesale distributor of radiators, air conditioning components, and other select automotive parts.
The group serves over two hundred thousand auto repair shops, parts stores, collision shops, car dealers, and junk yards, differentiating itself through high in-stock rates of long-tail inventory, same-day delivery, and rigorous quality control. There are two hundred 1-800 Radiator distribution centers that on average serve 1,380 business customers in their respective metros. This network of franchisees has been extremely stable in past years, while comparable store sales have increased high-single digits. In total, these mature brands produce approximately $100 million in annual royalties for Driven Brands.
Collision Brands
Driven Brands’ collision platform is the largest franchised collision repair network in North America, and the third largest collision company overall behind Caliber Collision and Gerber Collision. This platform includes 775 Carstar locations, 194 Fix Auto locations, and 59 Abra locations. With respect to the addressable market, there are over six million passenger car accidents in North America each year, which result in more than $50 billion in annual collision repairs. In addition, as is the case across the automotive care industry, the collision repair market remains highly fragmented. There are an estimated thirty-five thousand body shops across North America, of which single-location shops and small MSOs represent nearly seventy percent of total locations.
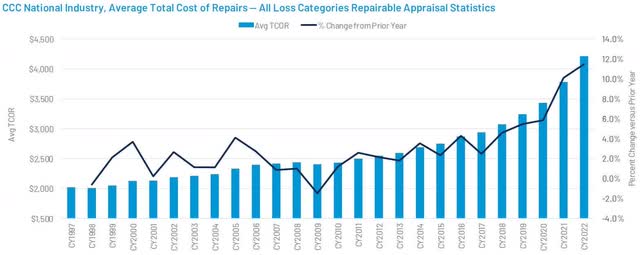
Framed another way, there are only eight collision brands that have more than one hundred locations, and Driven Brands owns two of them. While the quantum of auto accidents has remained relatively constant, the average total cost of repair (‘TCOR’) has increased steadily underpinned by structural factors such as increasing vehicle complexity and high labor inflation due to a shortage of technicians. This has driven a mid-to-high single digit growth rate in the collision repair market over the last decade.
To add to this, large national MSOs have been rapidly gaining share over the past decade as insurers favor those networks that have standardized processes, utilize state-of-the-art equipment and technology, deliver high consumer NPS scores, and offer a single point of contact. In tandem, scale allows national MSOs to enter into performance linked direct repair programs (DRPs/PBAs) that save insurers money, and often set pricing and performance standards that are not feasible for independent shops to achieve given their disadvantages in procurement and technology.
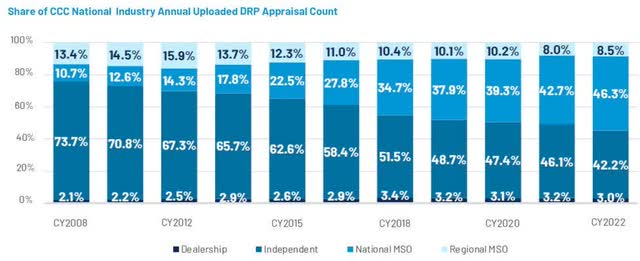
The result is that insurance carriers are actively culling their DRP programs, aiming to do more business with fewer chains, which has increased DRP participation for national MSOs and reduced or eliminated DRP participation at independent collision shops. For example, today an average national MSO collision location participates in thirteen DRPs, while independent collision locations average only three DRPs. According to data from CCC, this has led to national MSOs increasing their market share of insurance DRP volumes by more than threefold over the last decade.
Today, Driven Brands’ collision platform collectively produces more than $2 billion in annual system sales, which has been growing in the low-double digits. These brands are entirely franchised and Driven Brands, as the mothership, collects a royalty on each unit’s sales. Notably, because new franchisees are often conversions of existing collision shops, the royalties are structured with a low royalty charged on preexisting site volumes, and a higher royalty on growth volumes.
For example, if a collision shop with $1 million of annual sales decides to become a Carstar franchisee, their annual royalty would be a 1.5 percent royalty on the $1 million of preexisting volumes plus a 4 percent royalty on all volumes above this base. This makes attracting franchisees easier, as fees are overwhelmingly tied to growth and because the base royalty is modest compared to the immediate advantages Carstar brings, such as enhanced insurance relationships, national fleet partnerships, and significant procurement savings.
Critically, this royalty structure also means that the royalties earned by Driven Brands grow at a structurally higher rate than system sales. For example, if the hypothetical $1 million revenue collision shop grows by five percent per annum after joining Carstar, reaching approximately $1.6 million in sales in year ten, the royalties paid to Driven Brands would grow by 2.7x, or a growth of eleven percent per annum. Today, these collision brands in aggregate produce approximately $70 million in royalties for Driven Brands.
Take 5 Oil Change
Take 5 Oil Change is Driven Brands’ marquee asset. The business was founded in 1984 and operates in the stay-in-your-car, quick serve oil change market. In the United States, there are approximately 470 million oil changes that happen annually in the DIFM segment, and quick serve oil change models have been rapidly gaining share. Broadly, quick serve models account for one hundred million oil changes per annum, or approximately twenty percent of the market. Of this, Take 5 accounts for twelve million oil changes per annum, making it the third largest quick serve operator behind Valvoline and Jiffy Lube and the fastest growing company in the segment.
The business has grown from only sixty-five units when Driven Brands acquired the company in 2016, to now having over one thousand locations nationwide. Until recently, these locations have been primarily corporate owned, which has made Take 5 an outsized financial contributor to the Driven Brands platform relative to their other highly franchised verticals. Driven Brands expects to double the location count to two thousand Take 5 units over the next five years, which is underpinned by exceptional new location cash-on-cash returns.
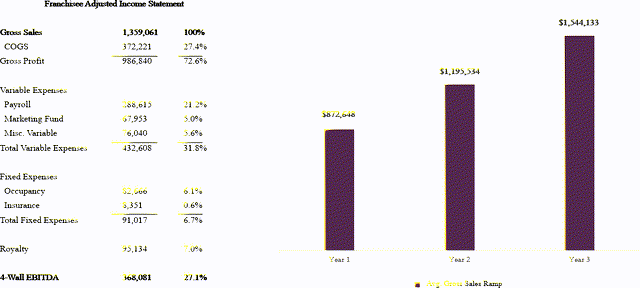
According to the 2023 franchise disclosure document, an average Take 5 Oil Change location has a natural sales ramp period of three years, over which time a location will scale from approximately $850 thousand in revenue in year one to $1.5 million in revenue in year three. In the first year of operation, on a sales base that is only slightly more than half of mature location revenues, a Take 5 Oil Change will reach twenty percent 4- wall EBITDA margins.
As the location matures, 4-wall EBITDA margins approach thirty percent. Consider the figures above, which detail the representative income statement from all Take 5 Oil Change franchisees in operation for more than twelve months. These units are on average two and a half years old and show sales of $1.36 million and twenty-seven percent 4-wall EBITDA margins, or $368 thousand in store level EBITDA.
The average investment to open a new location is $1.1 million, and so a typical franchisee, after having recouped nearly forty percent of their investment within the first two years of operation, would be headed into year three generating in excess of thirty percent cash-on-cash returns. This is highly attractive to potential franchisees given Take 5’s seventeen year track record of consecutive annual same store sales growth.
For corporate owned locations, we add back the seven percent royalty and another four percent of incremental franchisee operating expenses to arrive at thirty-eight percent 4-wall EBITDA margins, or approximately $500 thousand in store level EBITDA. Against an identical investment cost of $1.1 million, the result is that Driven Brands is building new corporate owned Take 5 locations at a forty-five percent cash-on-cash return.
However, in practice the results are even better. Instead of building new construction on a ground lease, Driven Brands will often purchase the real estate for a location outright and subsequently finance ninety percent of the capital expenditure back out in a sale and leaseback transaction. For example, Driven Brands will spend an additional $700 thousand to acquire the land up front, increasing the total land and construction cost to $1.8 million, and will later enter into a $1.6 million sale and leaseback transaction once the unit is in operation.
At a seven percent cap rate, this would add approximately thirty thousand in annual occupancy costs; however, the net capital outlay drops to only $200 thousand. Therefore, on locations where it is able to purchase the real estate, Driven Brands is generating in excess of two hundred percent cash-on-cash returns on new build corporate owned Take 5 locations. Turning back to the franchise side, the uptake has been incredibly strong, and the company is still in the early innings of growth.
There are currently 350 franchised Take 5 locations and an existing pipeline of 750+ committed franchisee openings that secures several years of very strong growth. Under the standard area development agreement, a Take 5 franchisee signs an agreement to develop and pays all the franchise fees upfront for an average of nine stores in a territory over a five-year period. This pipeline of 750+ stores simply consists of the units remaining on the 110+ area development agreements in place, thus providing upside as new territory development agreements are signed.
Moreover, although this franchisee expansion is inflecting in scale, there are several factors that have led the royalties earned from Take 5 to be de minimis up until this point. As mentioned previously, there is a natural sales ramp to new unit openings. In addition to this, the royalty percentage paid by franchisees also ramps during the three year maturation period. On average, franchisees pay a one percent royalty in year one, a five percent royalty in year two, and a seven percent royalty in year three and beyond.
Given that half of all new franchised locations have opened in the last two years, and more than seventy percent have opened in the last three years, the latent earnings are substantial. Today, Driven Brands earns approximately $20 million in annual royalties from Take 5, which is expected to grow to nearly $90 million in annual royalties in five years’ time.
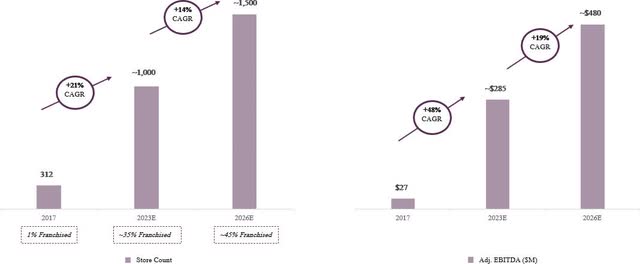
Taking the franchisee and corporate side together, Take 5 Oil Change today produces $285 million in EBITDA for Driven Brands, which is expected to grow to $480 million by 2026. Critically, this EBITDA converts to free cash flow at a high rate. As noted above, an increasing proportion of EBITDA is coming from franchisee royalties, which require no capital expenditure. In addition, as a simple ~1,500 square foot box with concrete floors, garage doors, and almost no equipment of any kind, the maintenance capital expenditure needs for corporate owned Take 5 locations are very low.
For example, Valvoline guides to maintenance capital expenditure needs of two percent of unit sales, or ~$30 thousand per unit. Take 5’s historical spend is even less than this number. However, even if one were to assume $50 thousand per unit in annual maintenance capital needs, this would still be less than ten percent of average store level EBITDA. In regard to the addressable market, Valvoline today has 1,850 locations and has a goal of reaching 3,500+ locations in time.
Take 5 is roughly half the network size as Valvoline, but is opening the same number of new units each year, leading to a growth rate that is two times higher. If Valvoline and Take 5 collectively reach six thousand units, they would account for around seventy-five million oil changes annually, or approximately sixteen percent of the total DIFM oil change market. This would likely require the quick serve oil change market to grow cumulatively by fifty percent to 150 million oil changes annually, a target that is highly attainable.
For instance, forty percent of oil changes are happening at a dealership, and another thirty-five percent of oil changes are still happening at generic auto repair shops or tire shops, where a customer either has to schedule an appointment to drop their car off or wait in a lobby where they don’t want to be. When examining sources of new customers for quick serve oil change, these two categories of competitors stand out as structural long-term share donors.
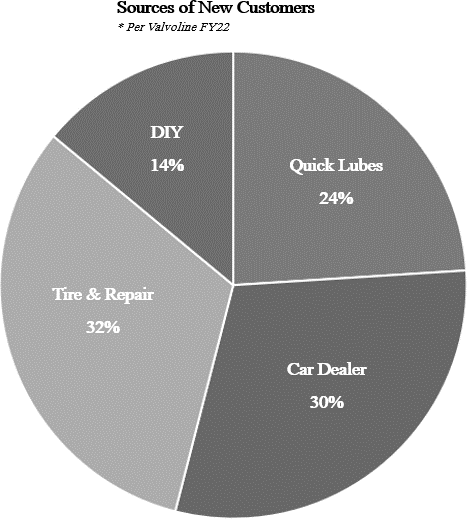
Finally, a topic that inevitably comes up when talking about the oil change business is the transition to electric vehicles (EVs). Many investors simply turn the page on Driven Brands for fear that EVs render quick serve oil change a dying business. I believe this is wrong for several reasons.
There are 285 million vehicles on the road in the United States, which has been growing in line population growth for many years. In addition, over the past decade new car sales have averaged approximately sixteen million units annually. Of this, battery electric vehicles (BEVs) as a percentage of new car sales in 2022 was 5.4 percent. Thus, at the outset we can note that even while a change in new car sales mix may be occurring rapidly, this translates to a very moderate change in the car parc in aggregate given that incremental units themselves are a small percentage.
For example, in 2022 the increase in EV penetration of the car parc would be 5.6 percent multiplied by 5.4 percent, or roughly 0.3 percent. This is less than the growth in the total vehicles in operation, which means internal combustion engine vehicles (ICEs) on the road are still growing. Assuming BEVs as a percentage of new car sales approaches fifty percent in a decades time, this would then result in an aggregate car parc that is twelve percent BEVs, and on an absolute basis there would still be 265 million ICEs on the road, or only an eight percent decline over ten years.
However, BEV penetration of new car sales is a very geographically diverse figure. In 2022, the statistic was 5.4 percent nationwide, but in California it was 16.1 percent, in Texas it was 3.5 percent, and in Louisiana it was only 0.9 percent. Therefore, if the car parc in aggregate is twelve percent BEVs, then many states, including those in the Gulf Coast where Take 5 has its largest concentration of company owned stores, will still be in the mid-single digit penetration of BEVs.
In these states, ICEs on the road would very likely be higher, not lower, in ten years’ time. To add to this, cars generally do not come to Take 5 or Valvoline until they are at least three years old when the warranty or pre-sold maintenance packages that are bundled with new car sales roll off. These vehicles are going to a dealership facility for oil changes. So, as it relates to the impact on oil change revenue by provider, the dealers will be the first tranche to take a hit as more new EVs are sold, and the impact to quick serve oil change will be roughly three to five years lagged to where the car parc is broadly.
When considering all these factors together, in conjunction with continued market share growth, I believe it is realistic that Take 5 could see fifteen years plus of growth before EV related declines begin to occur, at which point the business would begin declining from a profit base that is significantly higher than today.
Auto Glass Now
Auto Glass Now is the second largest company in the U.S. automotive glass repair and replace (AGRR) industry and is Driven Brands’ newest growth platform. This market shares several characteristics with Driven Brands’ other successful auto verticals. Namely, the industry is large and remains highly fragmented, there are significant benefits to scale including enhanced insurance relationships, the operating model is simple and does not require specialized labor, and it is a needs-based service.
Moreover, the auto glass segment is highly strategic for Driven Brands, as it provides a large corporate owned store platform in a category that is EV-neutral. Safelite Auto Glass is the definitive market leader in the U.S. with approximately $2.5 billion in annual sales, or approximately fifty percent market share. For context, prior to Driven Brands beginning its consolidation efforts, Safelite was approximately twenty times larger than the next largest U.S. auto glass retailer.
In 2022, Driven Brands executed a bold acquisition campaign, which brought together twelve disparate auto glass companies and established a nationwide presence with 176 retail locations. In 2023, these assets were united under Auto Glass Now, and the platform expanded with an additional ninety-four brownfield locations, giving the group an approximate five percent market share.
Other than Safelite and Auto Glass Now, there are only two companies that hold more than a one percent market share in the U.S. AGRR industry. Turning to future growth, Driven Brands aims to use the existing platform to continue new brownfield openings, which have exceptional unit economics. There is a very large pool of automotive repair shops that can be repurposed into auto glass locations with minimal capital expenditure.
For instance, on average Auto Glass Now will spend $200 thousand renovating an existing auto repair facility that they expect to ramp to $1 million in revenue with twenty-five percent 4-wall EBITDA margins. In other words, greater than a one hundred percent cash-on-cash return. Auto Glass Now currently has 270 retail locations and plans to build an additional 125 locations over the next three years. Looking forward, there is also a unique structural tailwind in the auto glass market.
Over ninety percent of new cars produced today come standard with advanced driver assistance systems (ADAS) that utilize a windshield mounted camera system to provide safety features like autonomous emergency braking, adaptive cruise control, and lane keep assist. For these vehicles, not only is the windshield itself more expensive, but the ADAS sensors must be recalibrated as well. This often more than doubles the repair cost.
For example, Safelite’s online system quotes $350 to replace a windshield on a 2010 Lexus RX and $1,100 to replace the windshield on a 2023 Lexus RX. The delta is a more technology dense, and thus expensive, windshield glass and approximately $300 on average in calibration costs. Notably, calibration revenue is highly margin accretive. Upfront equipment costs to perform ADAS calibration are marginal, approximately $20 thousand, after which point the only variable cost associated with a calibration job is forty-five minutes of labor, or approximately $15.
Today, an estimated twenty percent of the U.S. car parc has an ADAS system with a front facing camera, which is expected to reach more than fifty percent by 2030, and only ten percent of Auto Glass Now windshield repairs have calibration attached. As the car parc rolls to newer and newer vehicles, the calibration attachment rate will continue increasing, which alone will drive long term mid- single digit same store sales growth. This dynamic also has important ramifications on the channel mix for auto glass repairs. A substantial portion of the U.S. auto glass market is out-of-pocket cash customers.
However, as the average repair cost increases significantly, this will push most jobs beyond the average consumer’s insurance deductible, which makes insurance relationships essential. This favors scaled operators like Safelite and Auto Glass Now that have breadth and technological capability to meet the demands of national insurers. In fact, an immense advantage that Driven Brands has is the ability to leverage its longstanding relationships with top insurance carriers from its collision segment.
Even prior to entering the auto glass industry, Driven Brands had strong indications from its insurance partners that there was a desire for a second nationwide auto glass retailer. Finally, while Safelite is the dominant auto glass retailer in the U.S., it is also the third-party administrator (‘TPA’) for nearly all of the national auto insurers for glass- only claims. For instance, when a GEICO customer files a claim for a damaged windshield, either online or by calling a 1-800 number, they are actually routed to Safelite Solutions where they manage the claim end- to-end.
While consumers legally have a right to their choice of repair facility, occupying this critical customer touchpoint allows Safelite to preach the benefits of choosing a Safelite Auto Glass repair location. Driven Brands has the opportunity to introduce itself as one of the only TPA alternatives to Safelite. As mentioned previously, although Driven Brands began its push into the U.S. AGRR market in 2022, they entered the Canadian auto glass market in 2019 with the purchase of Clairus Group.
This included 240 franchised auto glass retail locations, one of the largest wholesale glass distribution businesses, and, critically, the largest TPA in Canada that has eighty percent of Canadian glass insurance claims under management. Through Clairus, Driven Brands has functioned as a leading TPA in Canada since 2005, which gives the group a running start in both the know-how and technology for its U.S. platform. Belron, the parent company of Safelite, was recently valued at $24 billion, and Driven Brands is doing all the right things to follow in its footsteps in building a highly valuable, scaled auto glass business.
Take 5 Car Wash
Driven Brands owns more than 1,100 express tunnel car washes, making it the largest car wash company in the world, and the second largest car wash company in the U.S. IMO Car Wash (‘IMO’), the group’s international segment, was founded in Germany in 1965 and has grown to become the world’s largest express tunnel car wash brand with 715 car washes across thirteen countries in Europe and Australia. This estate is concentrated in Germany, where IMO has 280 locations, and in the United Kingdom, where IMO has 250 locations.
In both markets, IMO is multiples the size of the next largest conveyor car wash operator, and the primary competition is from in-bay rollover car washes found at gas stations. Somewhat similar to a franchise model, IMO operates under an independent operator model. In this structure, IMO builds and owns the physical carwash infrastructure, and a third-party operator is responsible for site-level labor and receives commissions based on a percent of site revenue.
This results in high margins and predictable free cash flow for Driven Brands, which has averaged approximately $40 million per annum. In the U.S., Driven Brands’ car wash platform is earlier in its development and is significantly more growth oriented. There are an estimated 15,000 express tunnel car washes in the U.S., which account for half of the $16 billion annual domestic car wash revenue. In addition, in keeping with the broader automotive care industry, this market remains highly fragmented.
For example, the largest operator, Mister Car Wash, accounts for less than three percent of industry units, and seventy percent of car wash operators own either one or two locations. ICWG, prior to being acquired by Driven Brands, acquired 199 car wash locations in the U.S. split amongst twenty- five separate brands. This activity was then accelerated under Driven Brands’ leadership, as another 168 car wash locations across more than fifteen brands were acquired.
On the organic growth front, Driven Brands also invested heavily in building a significant greenfield pipeline and has opened sixty new build car wash locations to date. Following much of this whirlwind in activity, in 2022, Driven Brands began the process of converting all car wash locations across its U.S. platform to the “Take 5 Car Wash” branding. As the second largest car wash operator in the U.S., consolidating under one banner would allow the platform to leverage Take 5’s already strong consumer recall, while also solidifying competitive advantages, such as enhanced network value for car wash subscribers and a greater ability to cross-sell.
All of that said, in its relatively short tenure as owner, the U.S. car wash platform has been fraught with problems for Driven Brands. The segment is on its third leadership change in three years, and it has become evident that day-to-day operations at many locations have been neglected. This has led to same store sales declines and a widening gap in unit performance relative to industry benchmarks. For instance, across its more than 400 U.S. locations Take 5 Car Wash averages $1 million in revenue per location compared to $2.1 million in revenue per location for Mister Car Wash. With respect to membership programs, the disparity in performance is even more stark.
Mister Car Wash has upwards of 4,000 car wash subscribers per location, which has driven their revenue from subscriptions to seventy percent. On the other hand, Take 5 Car Wash has only 1,700 car wash subscribers per location and is at approximately fifty percent of revenue from subscriptions. There are several reasons for this poor uptake, some of which are as simple as employees not being properly trained to sell subscriptions to incoming car wash customers.
However, at bottom, the key to driving car wash member growth is delivering a consistent, high-quality wash experience. Even while seventy percent of an average Mister Car Wash location’s revenues are from subscribers, seventy-five percent of unique cars that visit that location each year are non-members. By selling a small percentage of those customers on converting to monthly subscribers, Mister Car Wash and others are able to effectively grow their membership bases.
However, if a consumer pays for a $25 single wash, and a piece of equipment in the tunnel is clearly not working, the car comes out dirty and wet, and half of the free vacuums are out of service, then there is effectively no chance that consumer is going to sign up for a membership. To remedy these ongoing issues, the COO of Driven Brands, Danny Rivera, who formerly lead Take 5 Oil Change, has now taken on personal responsibility for fixing the U.S. car wash platform.
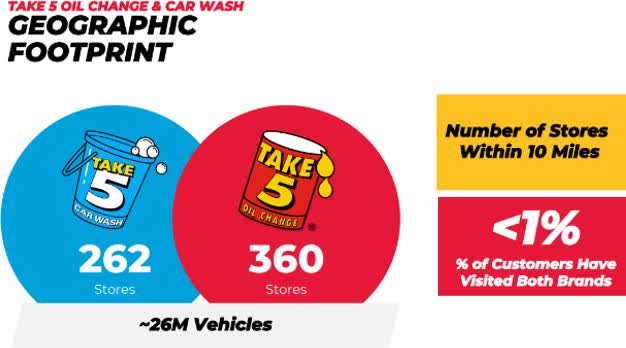
Critically, there are several reasons why the economics of the U.S. car wash platform should fix itself in time with proper execution. First, Take 5 Car Wash has an asset that no one else in the industry does, which is the ability to cross-sell more than twelve million and growing cars that visit a Take 5 Oil Change each year. Approximately seventy percent of Take 5 Car Wash’s network, or 262 locations, are located within ten miles of a Take 5 Oil Change.
However, Driven Brands estimates that less than one percent of customers have visited both brands. Recall that the vast majority of Driven Brands’ U.S. car wash locations have been branded as Take 5 Car Wash for less than a year. With the rebranding now complete, the group is primed to lean heavily into cross-selling. On average, a Take 5 Oil Change location will see fifty cars per day, or roughly eighteen thousand cars per year.
As a result, the Take 5 Oil Change locations that are within ten miles of a Take 5 Car Wash see approximately six million cars per year. If Driven Brands can convert one percent of this oil change customer base to car wash subscribers each year, then over a three year period, net of churn, this would add 400 car wash subscribers per location. In other words, $120 thousand in additional annual revenue per unit on a base of $1 million per unit, or mid-single digit same store sales growth from cross-selling alone.
Second, of the more than 400 U.S. car wash locations, one hundred locations are less than three years old, and approximately fifty of those locations are less than one year old. Driven Brands underwrites its car wash locations to ramp from $750 thousand in sales in year one to roughly $1.2 million in sales in year three. Therefore, as these greenfield units mature, this will add an additional $35 million in annual revenue to the U.S. car wash platform, or a headline increase of $87 thousand per unit.
Third, management has identified twenty-nine structurally underperforming car wash locations that it intends to close. These locations were on average thirteen years old and had suboptimal real estate, negative same store sales, and negative site level EBITDA contribution. These selective closures will increase headline revenue figures by $40 thousand per unit. Thus, across these items that are largely within Driven Brands’ control, there is line of sight to an additional $250 thousand in revenue per unit in the coming years, or a twenty-five percent uplift.
This incremental revenue flows through to profitability at a high rate, and will go a long way toward fixing the economics of the U.S. car wash platform. Finally, Driven Brands recently launched a new loyalty program and app called Take 5 Rewards. While the car wash business has long had a membership offering, this new program will create a subscription offering for Take 5 Oil Change and also a dual subscription for Take 5 Oil Change + Car Wash.
This is Driven Brands’ first formal foray into bundling services and building cross-brand loyalty. The initial program will be focused only on oil change and car wash; however, there will be future opportunities to include other platform brands, such as Auto Glass Now and Carstar.
Driven Advantage
In 2017, Driven Brands launched Spire Supply, a distributor of consumable products, such as oil filters and wiper blades, to serve all Take 5 Oil Change locations as well as some third-party auto repair facilities. This was an effective way to insource the distributor margin that was being paid away by Take 5’s rapidly growing store base. Similarly, there are other areas where Driven Brands, as the mothership, benefits from controlling the procurement of their system stores, such as in a group oil purchasing contract for Take 5 or in centralized purchasing of paint for Maaco and the collision brands.
In 2023, Driven Brands organized its effort to penetrate deeper into the $2.5 billion annual spend of its five thousand plus and growing system stores by launching Driven Advantage, an online platform that would fulfill all procurement needs for corporate and franchised stores. Instead of only focusing on the large categories (oil, paint, tape, etc.), Driven Advantage has dramatically increased category coverage and SKUs available through centralized procurement so that stores can have a one stop shop for their needs, and so they can be assured that they are getting the best prices.
Indeed, at present there are more than eighty thousand SKUs available through Driven Advantage, which cover a broad range of categories including automotive parts and supplies, tools and equipment, office supplies, electronics, and more. There is a several billion dollar opportunity of unaddressed spend across the Driven Brands network alone, and as the marketplace owner, Driven Brands receives an eight to ten percent commission on all products sold without taking inventory risk.
Procurement activities generated $50 million in EBITDA in 2022 for Driven Brands, and as the new Driven Advantage platform is rolled out it expects to earn an additional $35 million in EBITDA by 2026. However, beyond this, the long-term opportunity for Driven Advantage is immense. Recall that there are more than eighty thousand general automotive repair shops and more than thirty thousand auto body shops in the U.S., of which the majority are small chains or single store operators.
While the Driven Advantage platform is currently only available to Driven Brands’ network stores, the group plans to extend the offering to third- party automotive locations in the coming years. Indeed, Driven Brands has a running start at this expansion. Since 2019, it has owned the Automotive Training Institute (‘ATI’), the largest business coaching and consulting company in the automotive repair and collision industry. ATI works with 1,600 automotive shops, and Driven Brands plans to begin by offering the Driven Advantage platform to these affiliate partners.
Valuation
On August 2nd 2023, Driven Brands’ share price fell more than forty percent in a single day as the company announced headwinds in its U.S. car wash business, integration delays in its U.S. auto glass business, and the need, as a result, to adjust guidance down for the year. The company revised EBITDA guidance down by nine percent, or $55 million, and the shares lost $1.8 billion in market capitalization.
However, not all news was negative. In the same report, the maintenance segment, which principally consists of Take 5 Oil Change and is the size of all the other segments combined, announced nearly forty percent EBITDA growth and double-digit same store sales growth. Likewise, the collision segment reported double-digit growth, and Driven Brands reiterated its confidence in achieving its five year plan of $850 million in EBITDA by 2026.
And so, while nine of the company’s eleven automotive brands were unaffected, at the new $2.4 billion market capitalization and 9x EV/EBITDA multiple, Driven Brands was now valued at a forty percent discount to peer automotive retailers and a fifty percent discount, with double the growth, versus other highly franchised retail concepts. In fact, the headline enterprise multiple itself understates the dislocation because as a shareholder what matters is the return on equity capital, not the return on all capital.
At a now lower price, Driven Brands’ capital structure is fifty percent equity and fifty percent debt, versus peers that are eighty percent equity and twenty percent debt. In other words, in addition to the company on the whole being underpriced, every dollar of growth is worth sixty percent more to Driven Brands equity owners versus equity owners of the comparable companies. While the business may appear optically levered with $2.6 billion in net debt, there are several reasons why this is not the case.
First, given the capital-light nature of Driven Brands’ seventy percent franchised store network and the substantial embedded earnings growth from maturing stores, Driven Brands is able to grow earnings more than twenty percent per annum while simultaneously directing seventy percent of its free cash flow to paying down debt. Said differently, it is among the very rare businesses that can compound without incremental capital. Second, this leverage is very attractively structured.
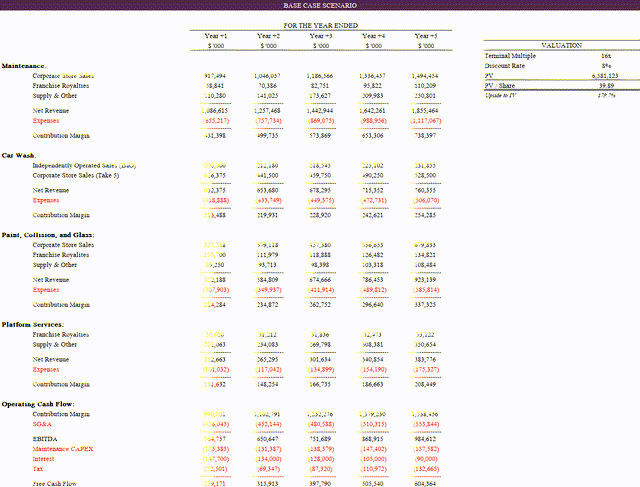
Eighty percent of Driven Brands’ debt is fixed rate at 4.3 percent with a duration of four years. In addition, more than $2 billion of the debt does not come due until 2027 or later, and Driven Brands has $390 million of current liquidity and more than $750 million of liquidity if one includes owned real estate within the car wash and oil change businesses that is held for sale. Consider the base case scenario modeled below, which indicates a value of $39.89 per share, or approximately 179 percent upside to intrinsic value based on the year end share price of $14.26.
This forecast models relatively little contribution from the U.S. carwash segment, shows the auto glass segment scaling slower than company expectations, includes no acquisition activity, and has management opting to paydown low cost debt over highly accretive share repurchases. Even still, Driven Brands is expected to ramp to over $600 million in free cash flow in five years’ time, after which point the company would be growing mid-teens from embedded growth and deleveraging.
Conclusion
We own a collection of businesses that are priced, in my estimation, very unreasonably. I do not know when, or if, perception will change in our favor. However, I do know that as these businesses continue to compound their earnings on our behalf – as new oil changes are built, private equity dollars are raised, legal claims are resolved, and flights and hotels are booked – the duration risk of our invested capital is falling precipitously.
We have, by design, elected to invest in situations where an untenable chasm in valuation is in line of sight, not decades away. And in doing so, we have gifted ourselves with multiple ways to win, irrespective of the market’s opinion. As always, I am happy to speak with you at length about any of our companies, and I remain grateful for your trust and partnership.
Appendix A: Realized Investments
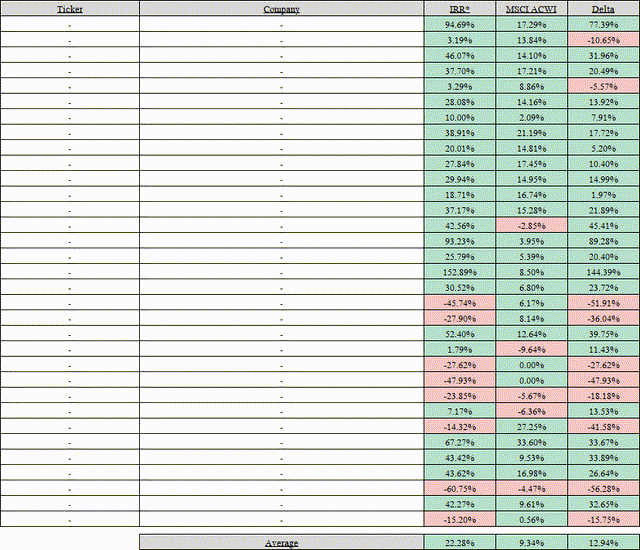
| *Table above reflects the IRR of realized portfolio investments (unannualized if < 1 Year), and the equivalent IRR that would have been achieved had each invested dollar been allocated to MSCI ACWI. |
Appendix B: Unrealized Investments
| *Table above reflects the IRR of unrealized portfolio investments (unannualized if < 1 Year), and the equivalent IRR that would have been achieved to date had each invested dollar been allocated to MSCI ACWI. |
|
Disclosures Investment in Emeth Value Capital are subject to risk, including the risk of permanent loss. Emeth Value Capital’s strategy may experience greater volatility and drawdowns than market indexes. An investment in Emeth Value Capital is not intended to be a complete investment program and is not intended for short term investment. Before investing, potential clients should carefully evaluate their financial situation and their ability to tolerate volatility. Emeth Value Capital, LLC believes the figures, calculations and statistics included in this letter to be correct but provides no warranty against errors in calculation or transcription. Emeth Value Capital, LLC is a Registered Investment Advisor. This communication does not constitute a recommendation to buy, sell, or hold any investment securities. Performance Notes Net performance figures are for a typical client under the standard fee arrangement. Returns for clients’ capital accounts may vary depending on individual fee arrangements. Net performance figures for Emeth Value Capital, LLC are reported net of all trading expenses, management fees, and performance incentive fees. Reported returns prior to January 1st, 2021 reflect the personal account performance of Emeth Value Capital, LLC’s sole managing member, and therefore represent related performance. All performance figures are unaudited and are subject to change. Contact Emeth Value Capital welcomes inquiries from clients and potential clients. Please visit our website at Emeth Value Capital or contact Andrew Carreon at acarreon@emethvaluecapital.com |
Editor’s Note: The summary bullets for this article were chosen by Seeking Alpha editors.
