
Ildo Frazao
The contrarian bet on EEM
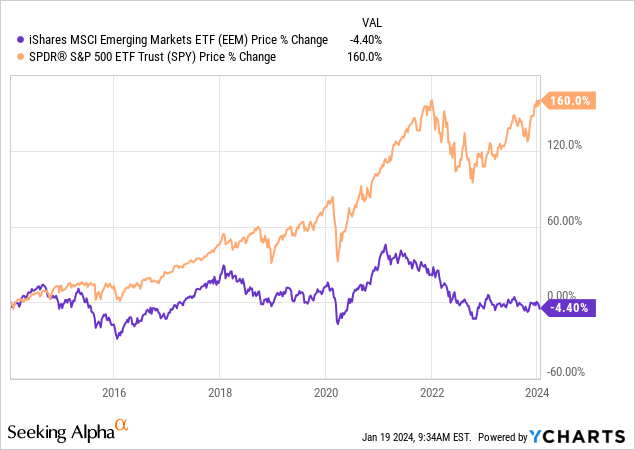
The ETF that tracks iShares MSCI Emerging Markets (NYSEARCA:EEM) has started the year horribly, already down by 6% YTD. In fact, this has been one of the worst investments over the last 10 years. EEM is down around 7% over the last 12 months, down around 8% over the last five years, and essentially flat over the last 10 years, down by 4%. Just for comparison, the S&P 500 (SPY) is up by 160% over the last 10 years.
Thus, investors who put their money into emerging markets have been “burned” over and over again. Furthermore, investors who are thinking about buying EEM at this point understand that it is a contrarian bet – something has to change fundamentally for EEM to break out of the range and stage a significant bounce.
What are the reasons behind the EEM underperformance?
On a macro level, the performance of emerging market stocks is related to the value of the US dollar (UUP). A weakening US Dollar is generally considered to be positive for commodity prices, and thus for the commodity exporting countries, and many emerging markets are still heavily dependent on commodity exports.
Similarly, a weak USD reflects a relatively stronger global economic growth compared to the US economic growth, and that’s positive for the emerging market stocks.
So, the Euro (FXE), the second largest global currency behind the US Dollar, should have a positive correlation with the emerging market stocks. Specifically, Germany is the largest Euro-area economy and heavily dependent on global exports, particularly to China. Thus, a strengthening Euro reflects a strong global economic growth, particularly in emerging markets, which is obviously positive for emerging market stocks.
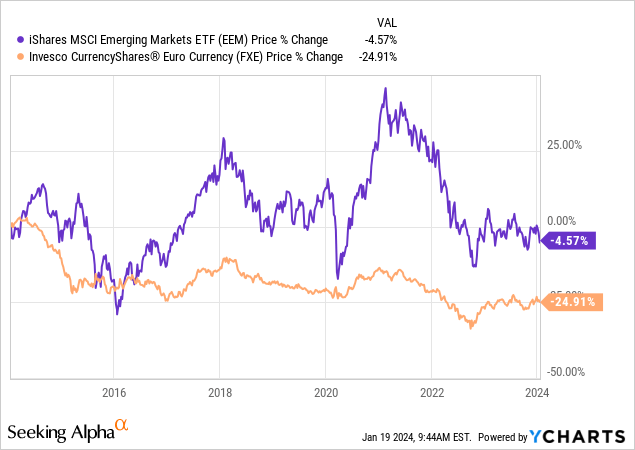
The chart below compares the return on EEM and FXE over the last 10 years. The Euro is down by almost 25% versus the US Dollar since 2014, while EEM is down by 4.5%. Thus, a weakening Euro has reflected weak global economic growth relative to US growth, and this has not been positive for emerging market stocks.
More importantly, there has been an almost perfect correlation between the cycles in the Euro and the EEM – EEM was falling as the Euro was depreciating, and generally rising during the periods of Euro appreciation. See for example, a sharp depreciation in the Euro in 2015 and similarly a large selloff in EEM. The current selloff in EEM has also been associated with a significant Euro depreciation.
So, the next question is, what has been the cause of the Euro depreciation? Now we come to the most important driver of the emerging market stock market performance – the Fed.
The recent depreciation of the Euro, since mid 2021 has been accompanied by the aggressive monetary policy tightening by the Fed, and the sharp increase in US interest rates across the curve, from short term to longer term rates. This has strengthened the US Dollar versus the Euro and other currencies.
The US monetary policy tightening is also known to cause the currency outflows out of emerging markets into US Treasuries in a flight to safety. Obviously, this is negative for emerging market stocks.
The positive catalyst
Based on the same argument and logic, emerging market stocks should outperform when the Fed eases monetary policy and lowers interest rates. This should cause a depreciation in the US dollar, and cause inflows into emerging markets with the risk-on sentiment.
The US Fed is about to enter the interest rate normalization cycle, and significantly lower interest rates over the next two years. In fact, the market consensus expectation is that the Fed will start lowering interest rates as early as in March, and more likely in May, and decrease the Federal Funds rate from currently 5.33% to 4% by the end of 2024 and 3.3% by the end of 2025.
More importantly, the interest rate normalization policy is designed to engineer a soft landing in the US economy – to remove the monetary policy restriction before it causes a recession. A US recession is usually very negative for emerging market stocks because commodity prices usually drop, and US imports decrease. However, a soft-landing scenario, where the Fed lowers interest rates without a recession is a positive catalyst for emerging market stocks. The USD is likely to depreciate, while commodity prices could slightly appreciate. Overall, global economic growth could accelerate.
What’s in the EEM?
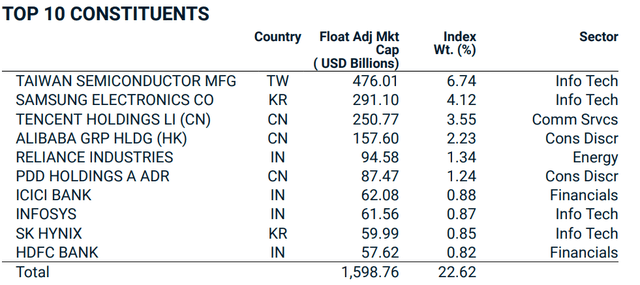
EEM tracks the iShares MSCI Emerging Markets Index. There are 1441 stocks in the index with an average market cap of $5B. The top 10 holdings account for 22.62% on the Index, and the largest holding is Taiwan Semiconductors with 6.74% of the total index.
MSCI Factsheet
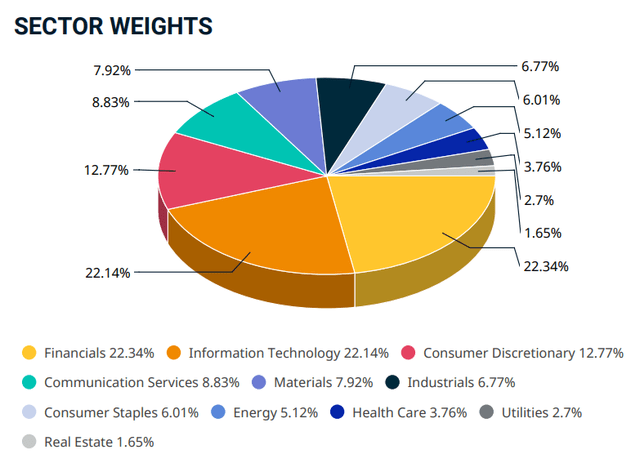
EEM is also well diversified, and Financials and Technology are the largest sectors represented with 22% of total weight each. Consumer discretionary is third with a 13% weight.
MSCI Factsheet
On a country basis, China represents 26% of the Index and India and Taiwan represent 16% of the Index each. Thus, almost 60% of the Index is in these three countries.
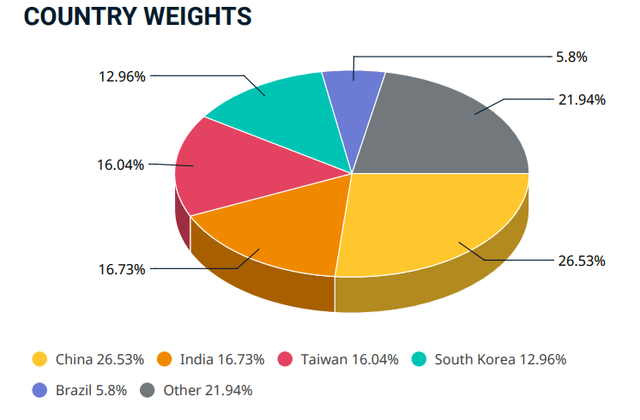
MSCI Factsheet
As previously mentioned, the MSCI Emerging Market Index has been underperforming global stocks over the last 10 years. Thus, it has a valuation multiple that is relatively and absolutely cheap – the PE ratio is 14, while the PE ratio for MSCI World is 20. The forward PE ratio for MSCI Emerging Markets is 11.7, while it’s 17.4 for MSCI World.

MCSI Factsheet
Implications
In summary, the Fed is about to enter the interest rate normalization policy, and this should be a positive catalyst for Emerging Markets. EEM is cheap and “beaten down”. Thus, long EEM is a near-term contrarian play with major positive macro catalysts.
Longer term, emerging markets, and especially China, are facing the headwinds of deglobalization. Thus, this is not a long term buy-and-hold investment, at least not for now.


