DigiPub/Moment via Getty Images
When it comes to making buy-and-sell decisions informed by style factors, investors have roughly two strategic options. The first one is for fervid supporters of a certain style. It is to stick with their factor of choice both during the ups and downs, regardless of how painful their portfolios’ decline might be. Certainly, it requires a lot of patience. A perfect example of what could happen in that case is the consistent underperformance of tech-light and value-heavy portfolios during the 2010s. Or the 2021 moment for maximalist growth, innovation, and disruption equity portfolios, when they, for the most part, fell out of favor with investors abruptly, with a meaningful share of them remaining underwater until the broad growth style recovery of 2023.
Another approach is less orthodox and more flexible, though also much more complicated to implement. Its essence is to actively rotate between factors, with the trigger for the style change being, for example, a certain economic indicator exiting a target zone. For investors who are ready to test that approach without spending too much time on individual company selection, there are a few exchange-traded funds that offer multi-factor strategies. The BlackRock U.S. Equity Factor Rotation ETF (NYSEARCA:DYNF), an actively managed investment vehicle that I previously discussed in April 2022, is one of them.
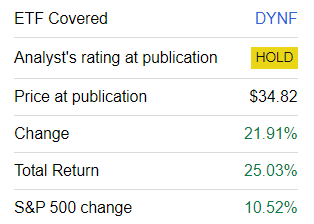
There are a few reasons why I am presenting a fresh note on DYNF today. First, the ETF has solidly surprised to the upside since the previous article as it confidently navigated both the bear market and the massive 2023 stock recovery, with the question being whether I was unjustifiably skeptical about the name when I assigned a Hold rating to it. Second, its portfolio has seen a major overhaul, now being substantially leaner than when I dissected it almost two years ago, with factor exposure shifts deserving a closer look.
DYNF strategy basics
As said on the DYNF website, the ETF
seeks to outperform the investment results of the large- and mid-capitalization U.S. equity markets by providing diversified and tactical exposure to style factors via a factor rotation model.
In the prospectus, the following factors the model is based on are mentioned:
The proprietary model uses commonly-used equity style factors such as momentum, quality, value, size and minimum volatility and dynamically allocates the factors, and seeks to emphasize those factors with the strongest near-term return prospects.
Regarding the proportions of factor ingredients, the prospectus says that
The model may allocate a maximum of 40% of the Fund’s assets in securities solely assigned to any single style factor but this allocation may fluctuate and exceed 40% due to market movement.
DYNF has surprised to the upside, yet there is something to dislike anyway
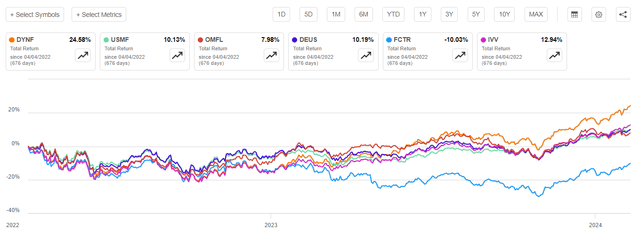
Since the previous note, DYNF has had a fantastic run, confidently outpacing the S&P 500 index.
Seeking Alpha
Moreover, since April 4, 2022, the ETF has beaten a few of its counterparts that focus on multi-factor strategies, including the following:
- Invesco Russell 1000 Dynamic Multifactor ETF (OMFL),
- WisdomTree U.S. Multifactor (USMF),
- Xtrackers Russell US Multifactor ETF (DEUS),
- First Trust Lunt U.S. Factor Rotation ETF (FCTR).
However, there are a few other questions worth addressing here, with the major one being how this streak of outperformance impacted its longer-term annualized returns and risk metrics. As of the previous article, they were far from great. The answer here is that metrics did improve, yet in this group, also including the iShares Core S&P 500 ETF (IVV) as a U.S. market proxy I typically use, DYNF is only in 3rd place, while OMFL, one of my favorite multifactor ETFs, is the leader.
| Portfolio | DYNF | IVV | OMFL | USMF | DEUS | FCTR |
| Initial Balance | $10,000 | $10,000 | $10,000 | $10,000 | $10,000 | $10,000 |
| Final Balance | $17,968 | $18,507 | $18,688 | $15,975 | $15,788 | $13,880 |
| CAGR | 12.89% | 13.58% | 13.81% | 10.18% | 9.91% | 7.02% |
| Stdev | 18.61% | 18.57% | 20.52% | 17.45% | 19.70% | 22.05% |
| Best Year | 36.26% | 28.76% | 28.96% | 21.24% | 25.56% | 30.15% |
| Worst Year | -20.27% | -18.16% | -13.97% | -8.83% | -11.19% | -20.41% |
| Max. Drawdown | -25.91% | -23.93% | -22.11% | -22.89% | -27.31% | -34.67% |
| Sharpe Ratio | 0.64 | 0.68 | 0.64 | 0.53 | 0.48 | 0.33 |
| Sortino Ratio | 0.99 | 1.05 | 1.1 | 0.81 | 0.72 | 0.51 |
| Market Correlation | 0.99 | 1 | 0.92 | 0.95 | 0.96 | 0.91 |
The period is April 2019–January 2024. Data from Portfolio Visualizer
Next, investors should also take notice that, when it comes to upside/downside capture, historical data suggest DYNF has a relatively small potential to benefit from the market moving higher (though it is still stronger than OMFL’s or DEUS’), while during softer periods, it might be less afflicted with bearish forces, as the downside capture ratio illustrates.
| Metric | IVV | OMFL | USMF | DYNF | FCTR | DEUS |
| Upside Capture Ratio (%) | 100.43 | 96.83 | 78.42 | 97.21 | 88.35 | 89.38 |
| Downside Capture Ratio (%) | 97.12 | 91.9 | 82.56 | 95.83 | 107.46 | 97.59 |
Data from Portfolio Visualizer
Tectonic shifts in factor exposures
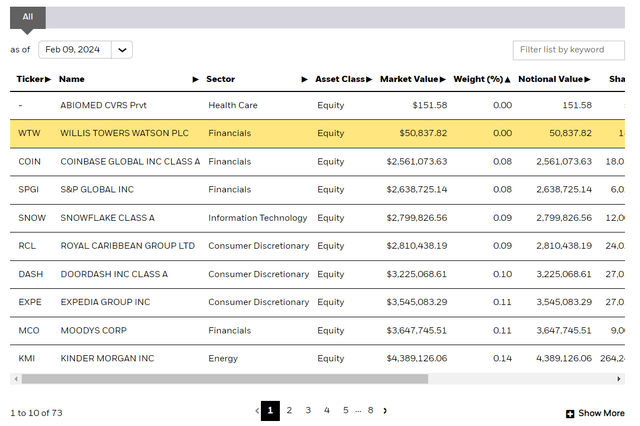
Since March 2022, the portfolio has seen profound changes, with most positions eliminated. More specifically, as of March 31, 2022, there were 446 stocks in its portfolio. As of February 8, 2024, that number shrank to just 70, with the nuance being that DYNF also holds contingent value rights in Abiomed. Acquired by Johnson & Johnson (JNJ), Abiomed has been private since December 2022.
iShares website. The screenshot taken on February 10 (Eastern Time)
These 70 companies had only 37% weight in the portfolio previously. How has the factor story changed? It is entirely different now. In my opinion, DYNF now favors momentum (and also growth) and quality, while underweighting value and low volatility, while it had a slight value tilt (by the large-cap echelon standards) as of the previous analysis. Let me give a bit more color on that:
- As of April 2022, 64.4% of the holdings were mega-caps; at this point, the ETF is even more bullish on these names, with an almost 86% allocation and a $971 billion weighted-average market cap as a consequence.
- Its value exposure has been meaningfully reduced. In April 2022, DYNF had about 57% of its net assets allocated to companies with a Quant D+ Valuation grade or lower. At this juncture, the share is at 84%.
- At the same time, stocks with a B- Growth grade or higher now account for almost 67% vs. only 22.3% previously. Please take notice that the ETF does not target the growth factor; the mix includes only “momentum, quality, value, size and minimum volatility”.
- So the most likely reason why its exposure to growthier stocks is so large now is that these players are in the limelight, so their momentum characteristics look alluring. So, DYNF has approximately 83% allocation to stocks with an at least B- Quant Momentum grade.
- Less volatile stocks are underrepresented, with a WA 24-month beta at 1.27 and 81% of the holdings having that coefficient above 1.
- The ETF remains heavy in top-quality stocks (almost 99% allocation to firms with a B- Profitability grade or higher).
-
In sum, assuming the current factor mix, I surmise the ETF is preparing to benefit from dovish monetary policy and the lasting momentum of longer-duration equities.
Additional factor data for a better context are presented below:
| Metric | Holdings as of February 8 |
| EY | 4.03% |
| EY Fwd | 3.38% |
| P/S | 9.43 |
| EPS Fwd | 13.24% |
| Revenue Fwd | 10.54% |
| ROE | 108.7% |
| ROA | 15.14% |
Calculated by the author using data from Seeking Alpha and DYNF; financial data as of February 10
Investor takeaway
At this juncture, DYNF is heavy in high-quality mega-caps with robust growth characteristics. Most holdings are momentum stocks; low-beta names are underrepresented. Even though I am impressed by its massive alpha delivered since the previous article, I remain neutral on DYNF’s active factor-rotation strategy. In fact, its history of outperformance is too short, as 2023 was just the first year when DYNF managed to beat the S&P 500 index. Triple-digit turnover is another issue investors might not be comfortable with. Nevertheless, I acknowledge that DYNF is one of the strongest factor-rotation ETFs, so it is worth shortlisting that name.


