LeoPatrizi
Emerging themes present themselves as we venture closer to the second quarter. The momentum trade has begun to sag while value and high-dividend stocks have returned to favor. So far in 2024, the Energy sector leads while Materials, another resource-heavy niche, is the best-performing group of the S&P 500 in the last month. Sneaking up under the market’s surface are mid-caps.
Often left out of the discussion between strategists and pundits, mid-sized companies often feature a healthy balance of growth and value; they are also generally less risky compared with, say, the Russell 2000 small-cap index. Elsewhere, keep your eye on dividend payers. Last week, it was reported that global corporations paid out a record $1.66 trillion in dividends to shareholders last year.
Hitting on many of these themes, I have a buy rating on the WisdomTree U.S. MidCap Dividend Fund ETF (NYSEARCA:DON). The ETF has a sound process of identifying mid-cap dividend stocks at a reasonable cost.
Mid-Caps Best In Size Since Mid-February
Seeking Alpha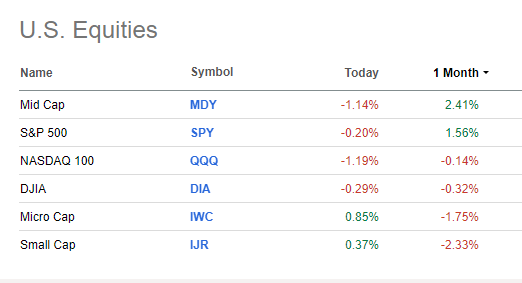
Value & High Dividend Yield Stocks Strongest In The Past Month
Seeking Alpha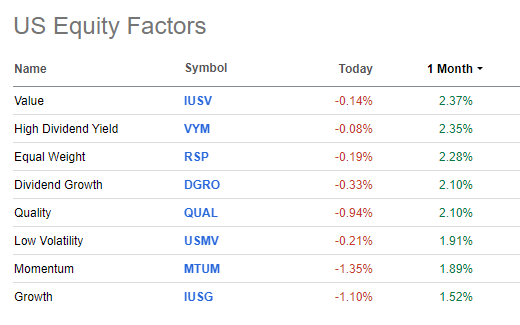
According to WisdomTree, DON seeks to track the price and yield performance, before fees and expenses, of the WisdomTree U.S. MidCap Dividend Index. The ETF is used to gain exposure to core U.S. mid-cap equities from a broad range of dividend-paying companies and can complement or replace midcap value or dividend-oriented active and passive strategies. DON has a focus on both growth and income.
If you don’t know DON, the ETF sports a solid B share-price momentum grade, and the annual expense ratio is low to moderate at 0.38%. The trailing 12-month dividend yield is a full percentage point above that of the S&P 500, currently at 2.49%.
At more than $3.5 billion in assets under management as of March 15, 2024, DON is near all-time highs on both an absolute and total return basis with moderate risk metrics. Liquidity indicators are solid – average daily volume is not all that high at just 168,000 shares but its median 30-day bid/ask spread is tight at just two basis points, according to WisdomTree.
Like many of the issuer’s dividend factor ETFs, DON generally aims to own so-called “quintile 2” stocks. That means it does not go for the absolute highest-yielding companies. Rather, the second-highest tier has historically provided the best risk-adjusted returns.
Dividend Investors Should Focus on “Quintile 2”
WisdomTree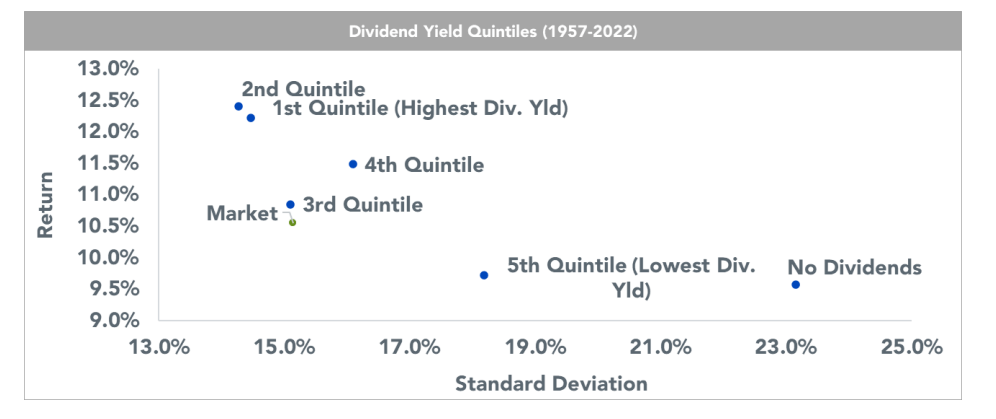
Mid-caps are indeed often that happy middle ground for investors. According to Bank of America Global Research, mid-caps have produced the strongest long-run returns in data going back to the 1970s.
Don’t Overlook The Mid-Caps: Best Long-Run Returns
BofA Global Research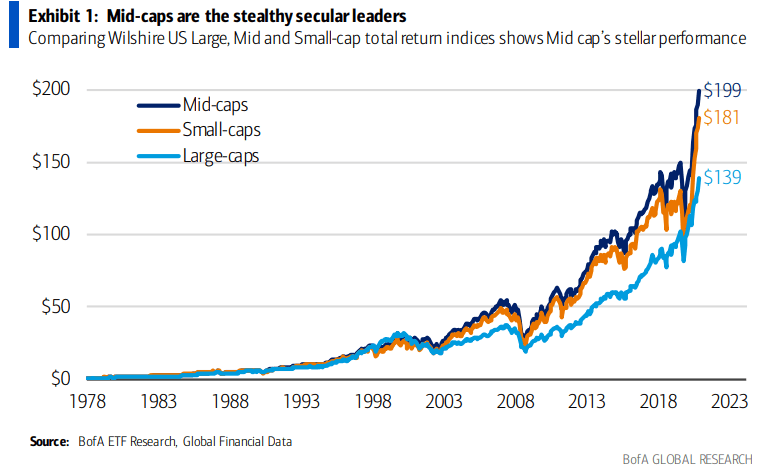
WisdomTree is then sure to point out that mid-caps about 60% of Russell Midcap Index components pay dividends, and that rate has been about steady over the past 30 years.
Russell MidCap Index Features Many Dividend-Paying Companies
WisdomTree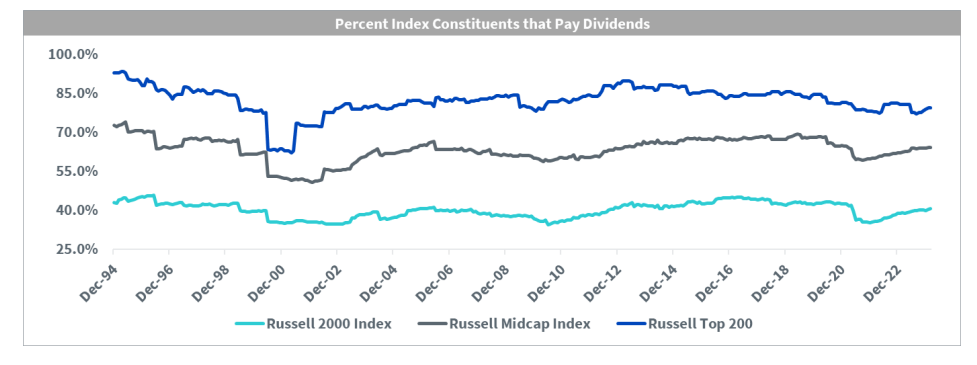
Holding 334 securities with 9.4% of total portfolio in its top 10 assets, DON is essentially an equal-weight ETF. Sector-wise, Financials is the biggest position followed by the cyclical Industrials sector. Information Technology, 29% of the SPX, is just 3.5% of DON. So, prospective investors should expect the ETF’s returns to vary significantly from the broad domestic large-cap market. Moreover, so long as interest rates don’t shoot higher, an improved economic outlook would benefit DON given its value tilt.
DON: Value & Cyclical Sector Exposure, Light On TMT Sectors
WisdomTree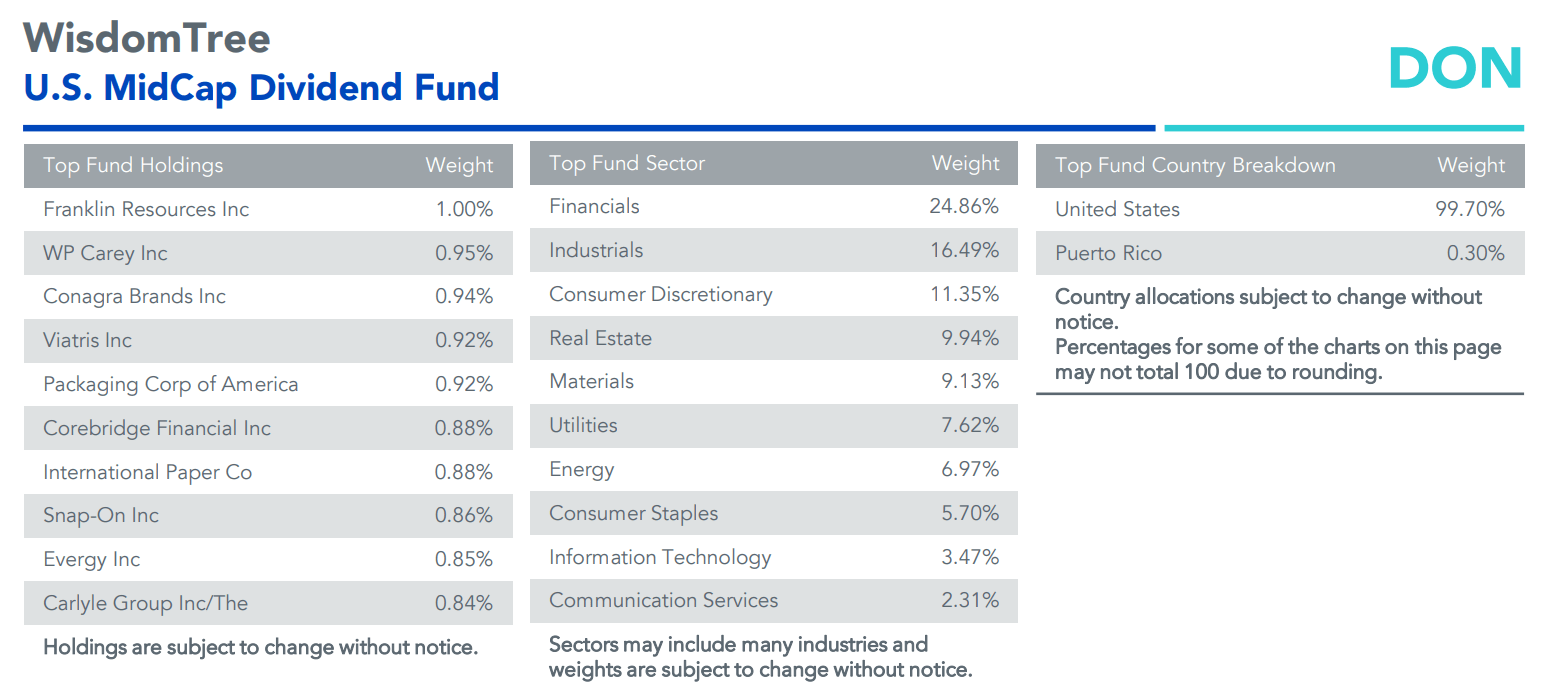
What’s also appealing about DON is that its forward price-to-earnings ratio is just 13.1x. That is more than seven turns cheaper compared with the S&P 500. If you tack on the net buyback yield to the dividend yield, then the portfolio returns 4.0%.
DON: Some Large-Cap Exposure, Low P/E Multiple
WisdomTree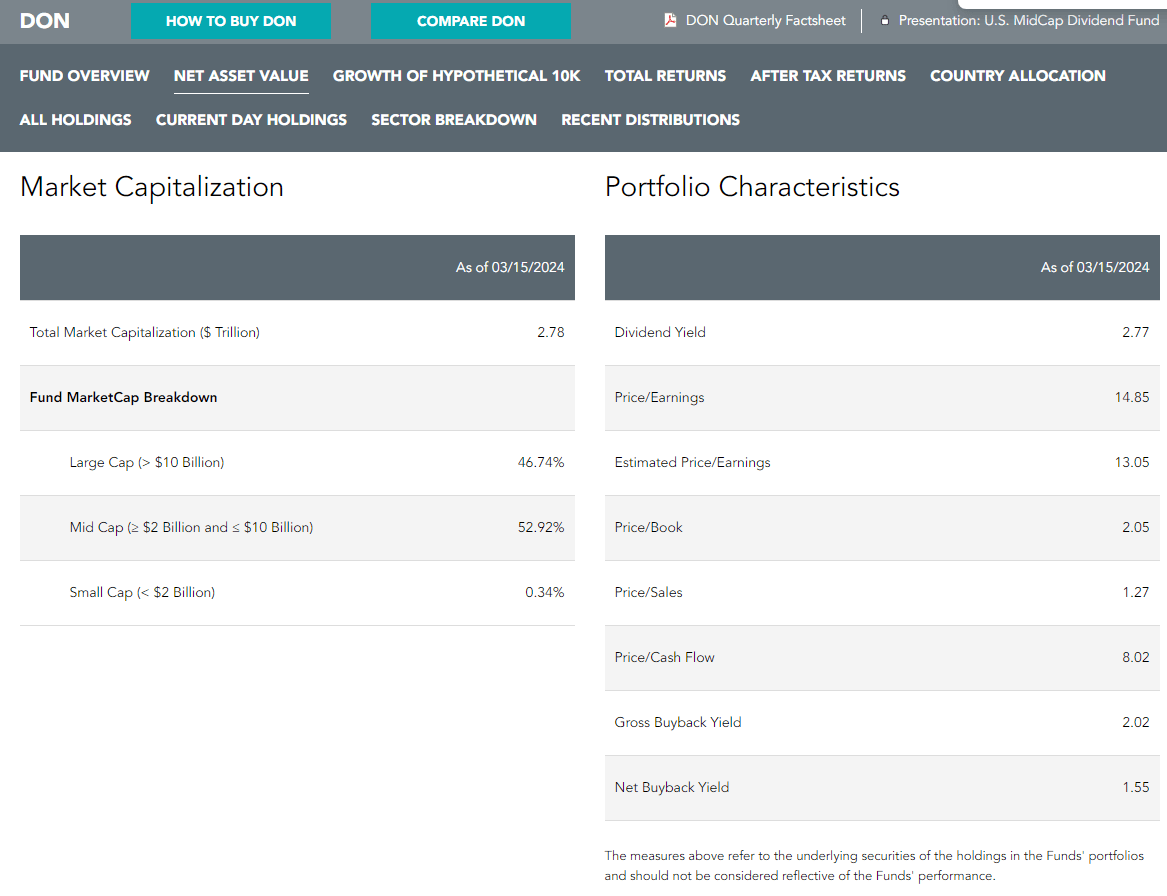
Seasonally, according to Seeking Alpha, DON tends to shine best from April through July. Those four months have cumulatively produced nearly 5% in total holding period return over the past 10 years.
DON: Bullish Seasonal Trends April-July
Seeking Alpha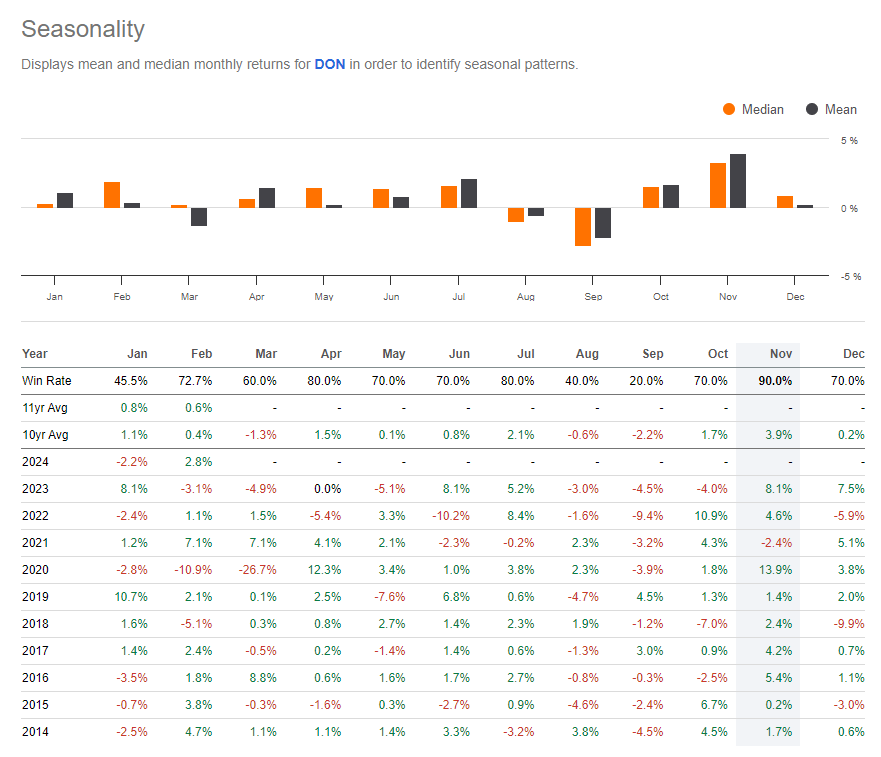
The Technical Take
With a diversified portfolio and low valuation, DON has recently broken out from an area of long-term resistance. Notice in the chart below that the bogey for the bulls and bears was the $45 to $46 zone. The ETF encountered selling pressure on a number of occasions from late 2021 through the turn of this year. Then, after a bull flag pattern from December and January, DON broke out, though volume was not all that impressive. Along with the lack of conviction in the number of shares traded on the upside move, the RSI momentum oscillator at the top of the graph has printed a modest negative divergence. I would like to see an equal or higher high in the RSI gauge compared to the high from late 2023.
Still, we can calculate a price target based on the height of the previous trading range. Support was near $38, so an $8 height added on top of the former resistance area yields an upside measure move price objective to about $54 in the near term. On the downside, $45 is supported, but there is also a significant amount of volume by price from the mid-$40s down to $40, so there should be ample support if we see a more material selloff.
Overall, with a rising long-term 200-day moving average, DON’s chart looks poised for higher prices based on the breakout from a multi-year consolidation.
DON: Upside Breakout, Some Bearish RSI Divergence To Monitor
Stockcharts.com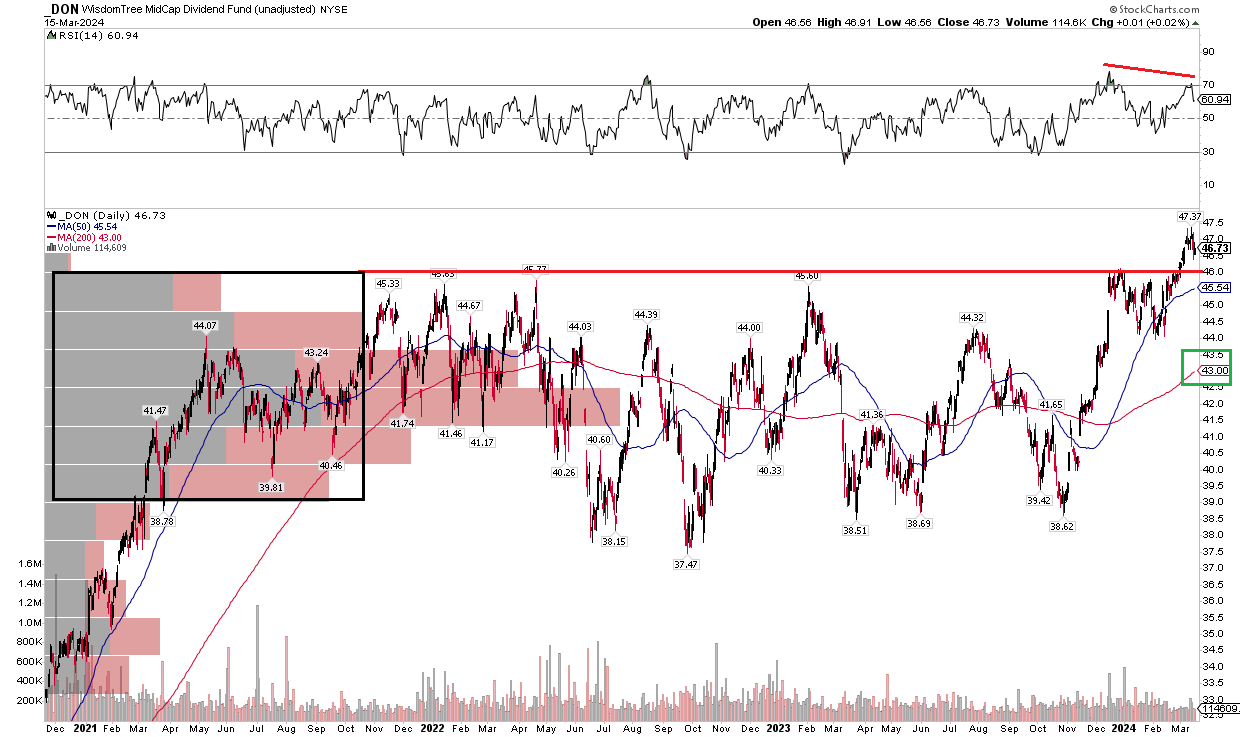
The Bottom Line
I have a buy rating on DON. Its compelling valuation and emerging momentum as the value, yield, and mid-sized factors all seem to be coming together. Adding to the tailwind is the potential for technical upside as bullish seasonality is set to ensue.

 Q2 2024 Earnings Call Transcript")

