
Guido Mieth
The S&P 500 equal weight ETF (RSP) has significantly underperformed the S&P 500 Trust ETF (SPY) since the beginning of 2023. After posting a solid stretch of alpha dating back to the middle of 2020, tech and tech-related equities commanded the attention of investors last year, highlighted by the proliferation of the Magnificent Seven stocks. For now, RSP is holding its relative lows against SPY.
The iShares Core Dividend Growth ETF (NYSEARCA:DGRO) moves closely with RSP. I have a hold rating on the yield-focused fund. While I like its diversification and low cost, price action has become more mixed as the market’s momentum appears to have stalled as we venture further into the second quarter.
The More Diversified EW SPX Pacing With the Cap-Weighted S&P 500 Since February As the Equity Rally Broadens
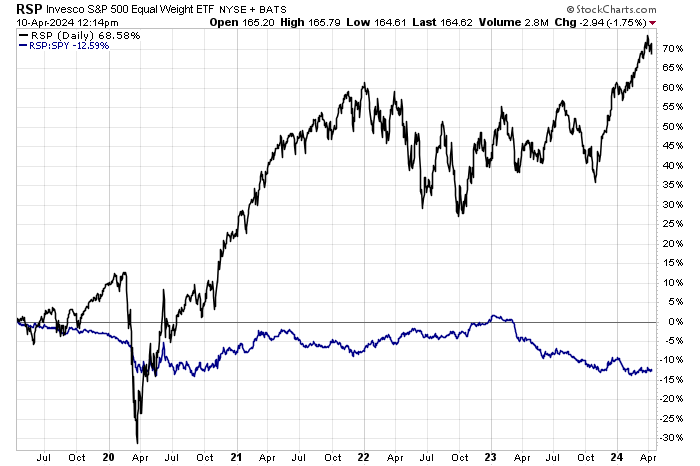
Stockcharts.com
According to iShares, DGRO seeks to track the investment results of an index composed of U.S. equities with a history of consistently growing dividends. The ETF offers investors low-cost exposure to U.S. stocks focused on dividend growth and is broadly diversified across industries.
DGRO is a large ETF with more than $26 billion in assets under management as of April 9, 2024, and it pays a yield a full percentage point above that of SPY at 2.32% on a trailing 12-month basis while its annual expense ratio is low at just eight basis points. Share-price momentum has been decent lately, but it has slowed modestly compared to earlier this year, according to Seeking Alpha’s ETF Grading system.
The fund is considered lower on the equity risk spectrum given the diversified portfolio and somewhat low volatility over the last year-plus. Finally, DGRO’s liquidity grade is best-in-class since volume is high while its 30-day median bid/ask spread is narrow at just two basis points, so using market orders during the trading day is just fine in my view.
The 5-star, Gold-rated ETF by Morningstar has an allocation that plots in the upper-left area of the style box, indicating that the focus is on large-cap value. Thus, there is a risk that if mega-cap growth stocks resume outperforming as Q2 presses on, then prospective investors should expect relative underperformance, much like the ETF endured in 2023.
But notice DGRO’s price-to-earnings ratio – it is more than three turns cheaper than the cap-weighted S&P 500 at 17.1. However, with long-term earnings growth under 9%, the normalized PEG ratio is not cheap on an absolute basis (1.9x).
DGRO: Portfolio & Factor Profiles
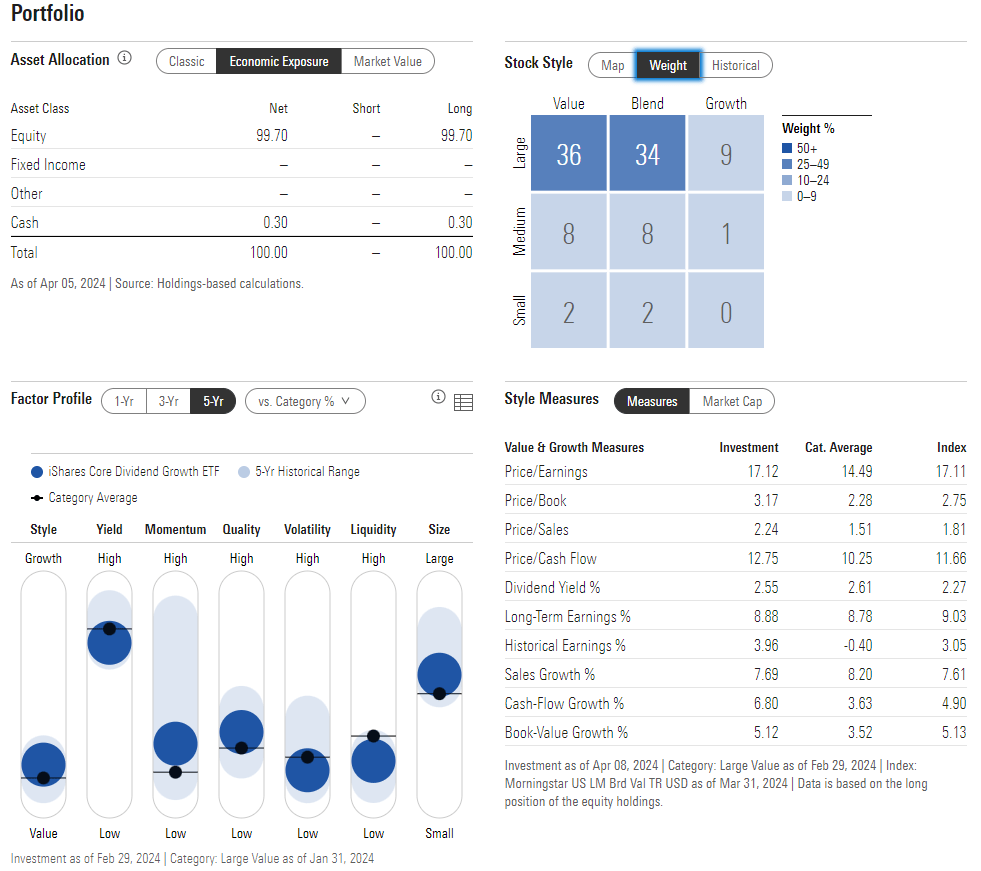
Morningstar
Looking closer at the portfolio, DGRO has significant exposure to non-growth sectors. Financials, Industrials, Consumer Staples, Energy, and Utilities are all relative overweights while the Information Technology niche is about 12 percentage points smaller in weight compared to the SPX. That has benefited DGRO in the last two months as non-TMT sectors have outperformed. Energy remains the best sector thus far in 2024.
DGRO: Holdings & Dividend Information
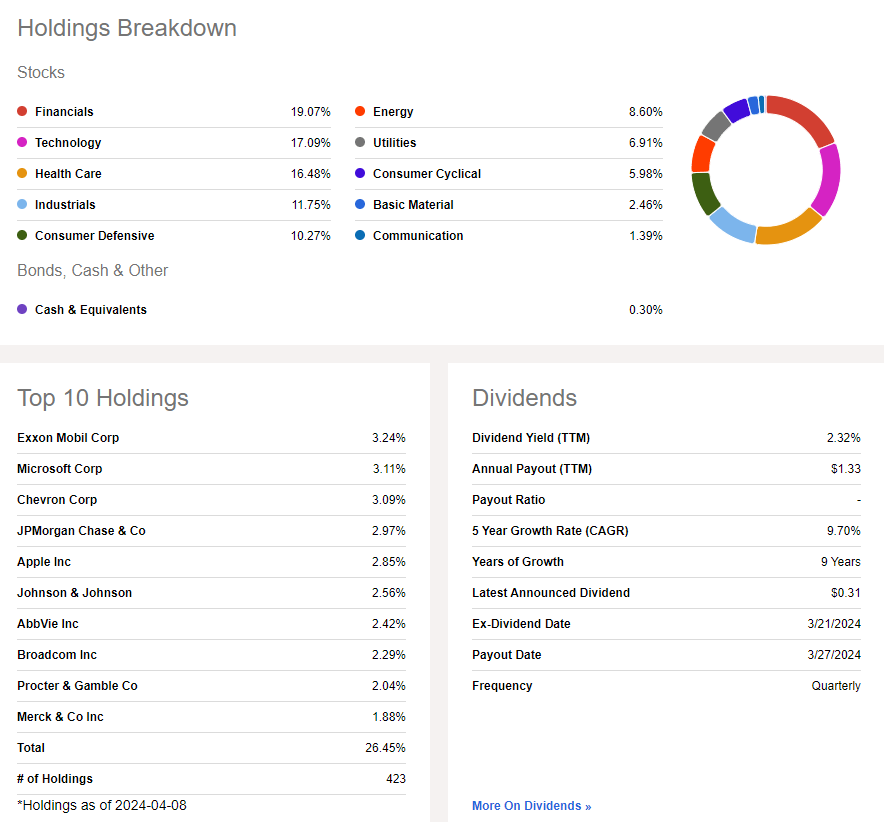
Seeking Alpha
Seasonally, DGRO tends to rally nicely in April with gains extending into May. June’s average performance has been close to flat before a strong start has typically occurred to kick off the second half. So, there are mixed seasonal tendencies at play today.
DGRO: Neutral Seasonal Trends Through June
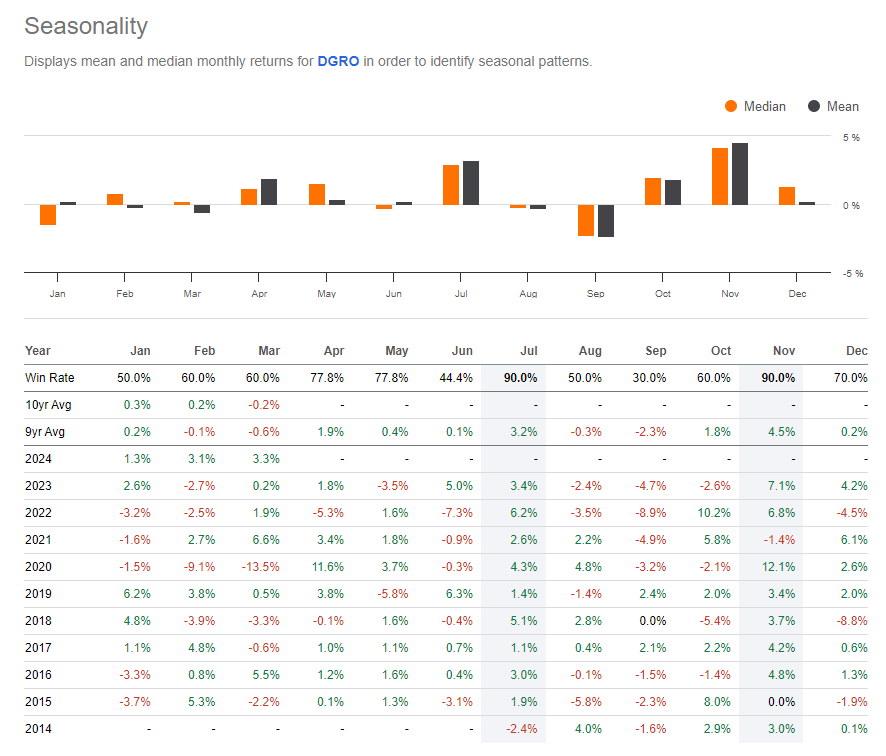
Seeking Alpha
The Technical Take
With strong diversification, low cost, and a mixed valuation, DGRO’s chart is near a critical juncture. Notice in the graph below that the dividend growth fund is right back at its early 2022 previous all-time high just below the $57 mark. Shares broke out above that level earlier this year, but a quick pullback to the 50-day moving average suggests that a potential small false breakout could be in the works. For now, the bulls are in control, and that’s evidenced by DGRO’s long-term 200-day moving average, which is currently rising and way down in the high $52s.
Also take a look at the RSI momentum gauge at the top of the chart – now in the mid-40s, the oscillator is at its lowest reading going back to early November 2023. That tells me that a correction could be in the works, but the 40 to 90 zone is typically the bullish range. On the downside, I see support in the $52.50 to $54.50 area – that was the range within which DGRO met selling pressures from the August 2022 highs to a bull flag pattern as 2023 transitioned into 2024.
Overall, DGRO’s chart is fine from a long-term perspective, but near-term indicators assert that a retreat may have room to run as we head into the first-quarter earnings season.
DGRO: Retesting Key Support, RSI Drops to a Fresh 5-Month Low
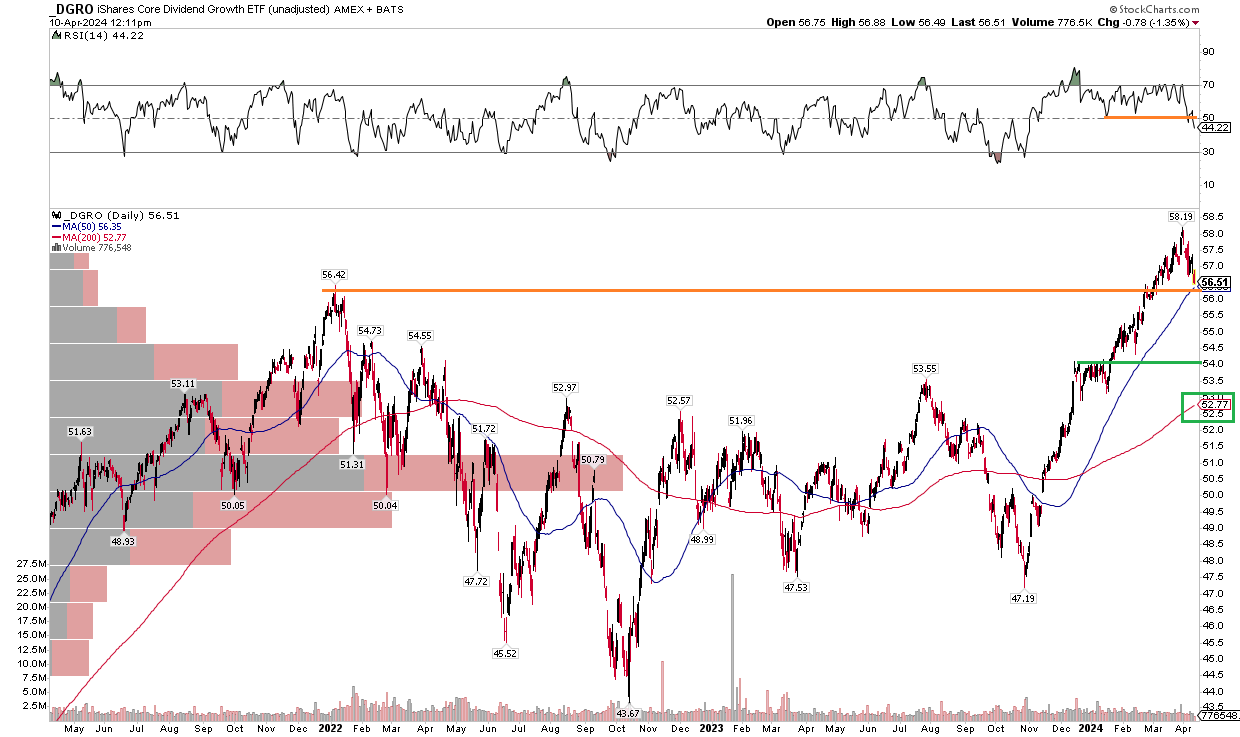
Stockcharts.com
The Bottom Line
I have a hold rating on DGRO. Its valuation is respectable, and I like its low cost, but the fund is not screaming cheap. The ETF’s momentum, meanwhile, shows some cautionary signals.

 Q2 2024 Earnings Call Transcript")

