Michael H/DigitalVision via Getty Images
What a rollercoaster of a ride in the crypto world. On Friday and Saturday, the total crypto market cap fell close to -18% on geopolitical tensions between Iran and Israel.
Excluding Bitcoin (BTC-USD) and Ethereum (ETH-USD), the total crypto market cap fell as much as -25% in these two days alone.
This liquidation / capitulation event is a good opportunity for traders / investors to get into crypto, especially for those who have sat out the rally so far, or have raised cash of late.
My focus is on Ethereum, which is trading very resiliently during this sell-off.
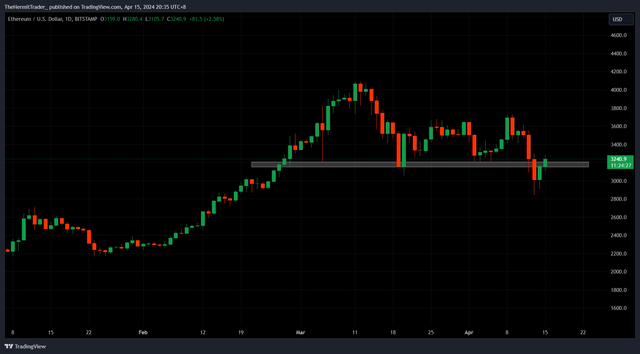
When we look at the daily chart below, we may observe that ETH briefly broke below key supports, but quickly reclaimed above.
Price sweeping below these supports likely triggered a torrent of stop losses, and if price heads higher, these bulls are now forced to chase to re-enter.
Daily Chart: Ethereum
Importantly, ETH is now trading back at levels prior to Sunday’s -7% sell-off. This implies that bulls have managed to reverse relatively heavy damage. Of course, things may change rapidly, given the uncertainty of the geopolitical situation. But as of now, the technical picture is constructive.
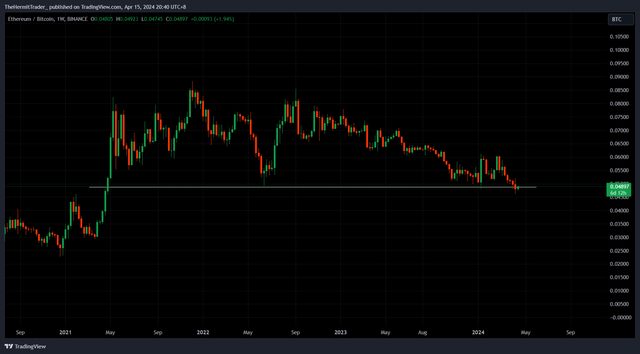
Now, when we go on to look at the ratio of Ethereum vs. Bitcoin, we may see that it is testing supports that have been in play since 2021.
Weekly Chart: ETH/BTC
The price is still holding above this support, which is impressive because:
- a rush to safe haven given the geopolitical tension should theoretically have led to sharp demand in BTC over ETH and altcoins
- Bitcoin halving event is set to take place in mid-April, where the reward for miners will be cut into half to ensure the scarcity of Bitcoin
Despite these bullish catalysts for Bitcoin, not to mention the issuance of Bitcoin ETF (IBIT), the support for ETH / BTC is still holding.
We could see a “sell the news” event after the Bitcoin halving has occurred, where Ethereum goes on to outperform Bitcoin.
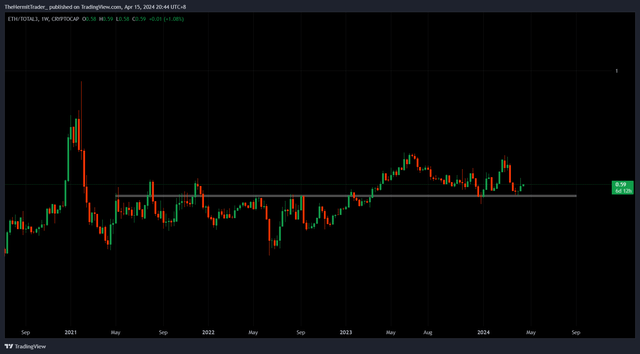
Next, when we look at the ratio of ETH / total crypto market cap excluding Bitcoin and Ethereum, we see that this ratio is also holding up at supports.
Weekly Chart: ETH/Total3
If we get bounces in these two ratios – ETH / BTC and ETH / Total3, we may see Ethereum outperform the majority of its crypto peers.
ETH has lagged considerably in the crypto rally so far. Its 1Y performance is +75%, which is meagre compared to BTC (+143%), Solana (SOL-USD) +612%, Dogecoin (DOGE-USD) +108% within the same time period.
Yes, the war is still brewing in the background, which adds a layer of uncertainty. But the best time (and hardest time) to go long is when there is capitulation.
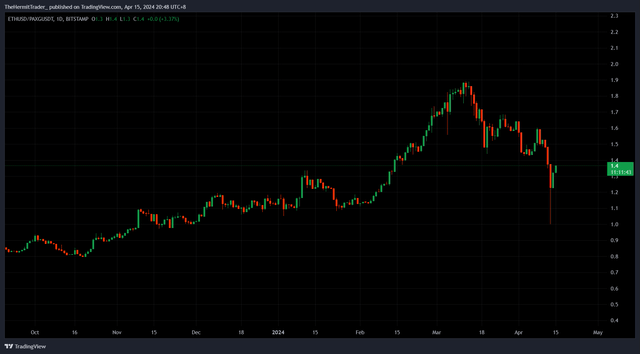
Another sign of capitulation would be when we look at the ratio of ETH/PAXG. Paxgold is an altcoin that aims to track the price of gold, as the tokens are backed 1:1 with physical gold.
This ratio fell as much as -25% on Saturday, which means gold outperformed Ethereum by a whopping 25% on one day alone. The majority of this move has since been reversed.
Daily Chart: ETH/PAXG
This tells me there was a fear-driven flood to safety over the weekend when war news broke, which led to sharp outflows from Ethereum (and other coins) into safe haven gold. The manner in which this move was quickly reversed tells me it was a knee-jerk reaction.
My target for ETH by the end of this year would be for it to make new highs at $5000 – not too wild, considering BTC has already broken out to new highs.
I see this as a good opportunity to scale into coins that you like. My focus is on ETH for the reasons mentioned. Do not go all in with leverage from the get-go. Take it easy and scale in slowly, being cognizant of the uncertain backdrop.


