AndreyPopov/iStock via Getty Images
Investment Thesis
The VictoryShares US Large Cap High Dividend Volatility Weighted ETF (NASDAQ:CDL) has a 3.62% trailing dividend yield, makes monthly distributions, and trades at 14.79x forward earnings, or about half the value of the SPDR S&P 500 ETF (SPY). These are good reasons to buy, but my analysis reveals a portfolio of stocks with low-single-digit sales and earnings growth and weak free cash flow and net profit margins. Victory Capital markets it as a solution for defensive income investors, but I think there are many risks, so I have assigned a “sell rating and will discuss the reasons why in detail below.
ETF Overview
Performance
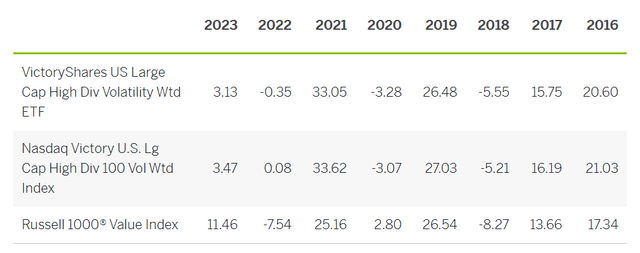
According to Victory Capital, CDL aims to outperform traditional cap-weighted Indexes by combining fundamental analysis with a volatility weighting. Since it holds high-yielding dividend stocks, CDL benchmarks against the Russell 1000 Value Index, and based on the table below, results look promising.
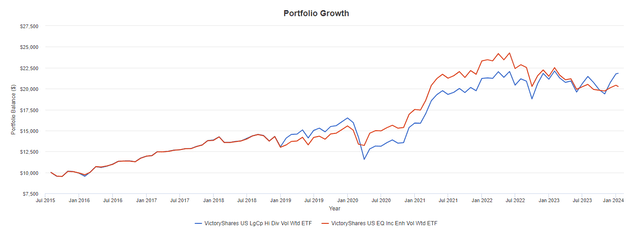
CDL tracks the Nasdaq Victory U.S. Large Cap High Dividend 100 Volatility Weighted Index, which outperformed its benchmark from 2016-2019 and 2021-2022 before giving back about 8% in 2023. Since August 2015, CDL also beat the Vanguard Russell 1000 Value ETF (VONV) by 1.45% per year.
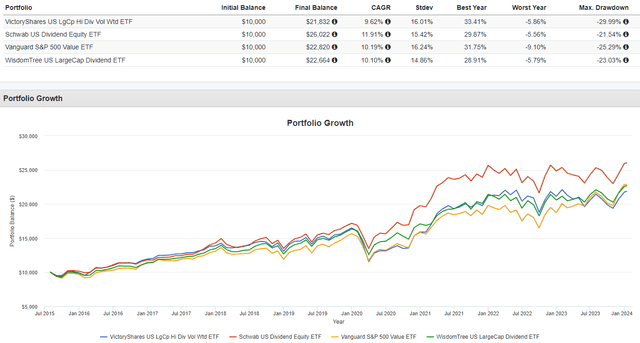
It’s impressive on the surface, but over the last eight years, VONV was a below-average-performing large-cap value ETF. To illustrate, I identified 54 large-cap value and dividend ETFs with an eight-year history, and VONV ranked #40. CDL did better at #23, but my takeaway is there are better funds available. The Schwab U.S. Dividend Equity ETF (SCHD) beat on total returns and is competitive on yield. S&P 500 Value Index ETFs like SPYV, VOOV, and IVE ranked #9-11, and WisdomTree’s DLN and DTD, which also make monthly distributions, rank #13 and #15, respectively. The chart below highlights these performance differences in greater detail.
CDL’s volatility (standard deviation) was notably higher than SCHD’s and DLN’s, and its 29.99% Q1 2020 drawdown was the worst. As a result, I’m skeptical it can succeed on its low volatility objective.
Strategy Discussion
According to this methodology document, the Index selects the 100 highest-yielding securities in the Nasdaq Victory U.S. 500 Large Cap Volatility Weighted Index. This parent Index is similar to the S&P 500 Index, but no REITs are eligible. Constituents must have positive net earnings over the last twelve months and have a minimum $3 million median daily traded value over the previous six months. Reconstitutions occur semi-annually in March and September, with sector constraints of 25%. Finally, constituents are weighted by the inverse of the daily standard deviation over the last 180 trading days.
The profitability requirement provides some comfort, but profitability widely varies across the 500 largest U.S. stocks. Using the S&P 500 Index as a guide, I calculated average net income margins and median market caps for five buckets of stocks:
- Stocks 1-100: 16.96% / $149.45 billion
- Stocks 101-200: 17.80% / $56.20 billion
- Stocks 201-300: 12.28% / $32.49 billion
- Stocks 301-400: 13.02% / $18.78 billion
- Stocks 401-500: 9.07% / $11.62 billion
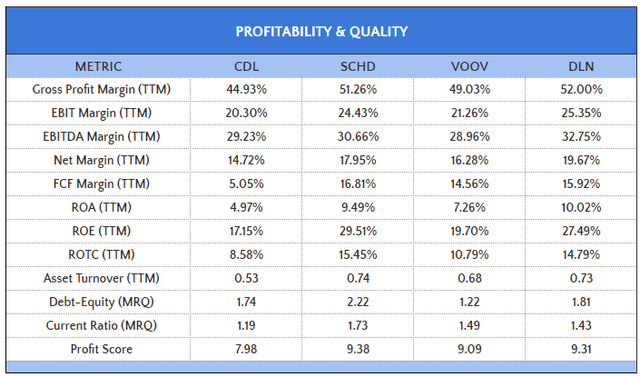
Since CDL includes 70/100 stocks with market caps below $56.20 billion, it’s no surprise its weighted average net income margin is only 14.72%, 4.66% less than SPY’s 19.38%. CDL’s deficit on free cash flow margin is even wider at 11.93% (5.04% vs. 16.97%), which is concerning for a dividend fund. With limited free cash flow, dividend growth becomes challenging, as does meeting the fund’s capital appreciation objectives.
This quality sacrifice is a feature of CDL, not a glitch. To illustrate, SCHD, DLN, and DTD manage 2-5% greater net income margins and 14-17% higher free cash flow margins because they take size into account. On its fund page, Victory Capital suggests these weighting schemes are inherently flawed, but I see them as an easy way to generate a high-quality portfolio.
To be sure, CDL offers some diversification benefits, and it does rank well on other factors, particularly valuation. However, the quality sacrifice is too large, evidenced by CDL’s #44/54 profit score ranking among the large-cap value and dividend ETFs I referenced earlier. Ultimately, readers must consider which factors matter most for their time horizon, and assuming yours is long-term, it makes sense to own the most profitable companies.
CDL Analysis
Sector Exposures and Top Ten Holdings
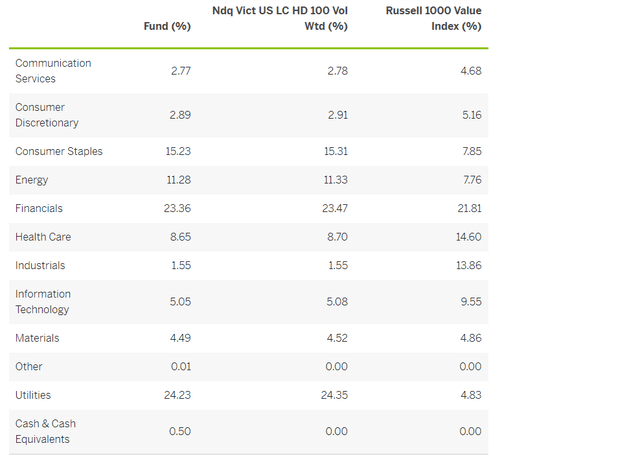
CDL’s 24% exposure to Utilities is the primary source of the fund’s poor profitability, evidenced by the ETF’s 6.56/10 profit score for this sector. In addition, although all of its Health Care selections have “A+” Seeking Alpha Profitability Grades, CDL’s 8.65% allocation is relatively small.
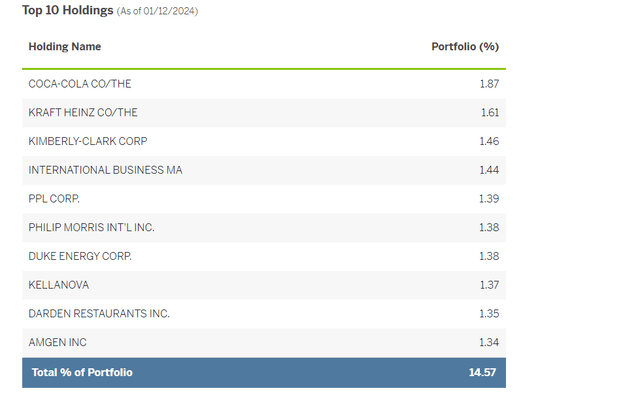
CDL’s top ten holdings, totaling 14.57% of the fund, are listed below. Since the standard deviation range for U.S. large-cap stocks is much tighter than their market caps, the result is a reasonably well-diversified portfolio at the company level. However, it’s not well-diversified at the sector level.
Coca-Cola (KO) is the top holding at 1.87%, followed by Kraft Heinz (KHC) and Kimberly-Clark (KMB). These are typically less volatile than the market, with five-year betas of 0.58, 0.68, and 0.40, respectively. The only exception in this list is Darden Restaurants (DRI), which has a beta of 1.24. However, over the last two years, it’s 0.74, and this helps highlight the potential drawbacks of only using short-term standard deviation of returns to measure volatility. For the entire portfolio, CDL’s two-year beta is 0.78, but its five-year beta is higher at 0.89 and in line with what most large-cap dividend and value ETFs feature. It also explains why CDL hasn’t succeeded in delivering a low-volatility portfolio compared to its peers.
Fundamentals By Sub-Industry
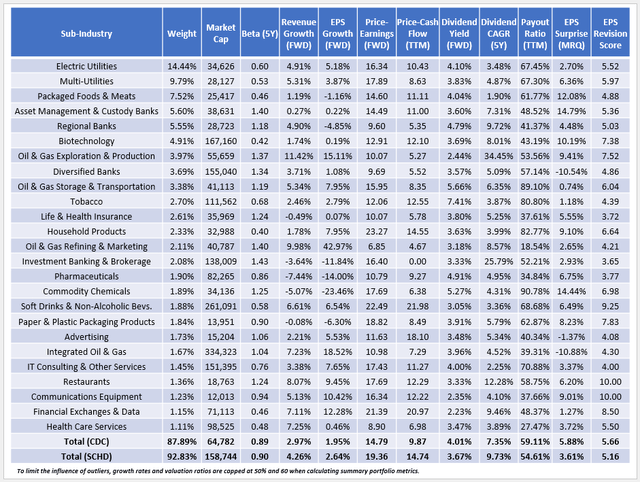
We’ve looked at CDL’s sector exposures and top holdings. Next, I’d like to present selected fundamental metrics for its top 25 sub-industries. This covers 88% of the fund, with most sub-industries on a small size based on their weighted average market cap figures. As a comparison, I’ve also included summary metrics for SCHD.
A few observations:
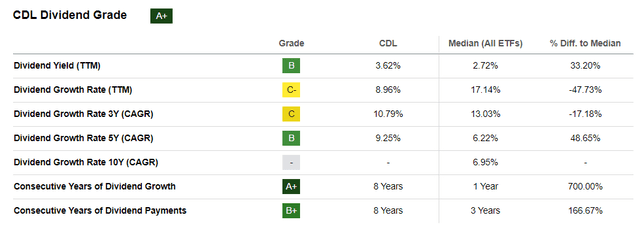
1. CDL’s constituents yield 4.01%, but after deducting the fund’s 0.35% expense ratio, shareholders should receive 3.66%, close to the fund’s 3.62% trailing dividend yield. The Utilities sub-industries improve the yield, while Oil & Gas stocks drive it down. CDC’s net payout ratio is 59.11%, which is high but mainly attributed to its Utility holdings. Since most companies have regulated rates of return, the dividends are safe, though dividend growth is limited. On the plus side, CDC’s five-year dividend growth rate is excellent at 9.25%, so the ETF might rotate into high-dividend-growth stocks later.
2. Since dividend yield and price are inversely correlated, it’s unsurprising to see CDC with an attractive 14.79x forward earnings valuation. That’s 4.57 points cheaper than SCHD, with most attributed to a high allocation to sub-industries in the Financials sector like Regional Banks (9.60x) and Diversified Banks (9.69x). CDL has a 5.18/10 value score, which is sector-adjusted, compared to SCHD’s 4.39/10 value score, so it’s certainly a better value play.
3. A huge tradeoff for CDL is growth, as its constituents have estimated sales and earnings per share growth rates of 2.97% and 1.95%. To put this in perspective, I identified 382 diversified U.S. Equity ETFs with market caps above $50 billion, and CDL’s earnings growth ranked #369. Therefore, CDL is an extreme value play that should substantially underperform if growth stocks keep their momentum in 2024. To be sure, SCHD’s earnings growth ranking is similar at #364, but at least it’s a high-quality fund. You can count on it to bounce back and eventually succeed.
Comparison With CDC
Finally, I want to highlight how CDL has the results advantage again over CDC, which has the same underlying equity portfolio but can allocate up to 75% to U.S. Treasuries, according to its rules-based system. This aligns with my previous finding that CDC’s long/short strategy was essentially a guessing game, and it’s revealing how CDC was the worst-performing dividend fund in 2023. Successful market timing led to outperformance in 2020, but CDC lagged CDL by 7-8% in 2022 and 2023.
Investment Recommendation
I don’t recommend CDL due to its poor quality and growth features. Its expected 3.66% dividend yield is attractive but achievable with SCHD, a higher-quality fund with a superior total return and dividend growth track record. Furthermore, CDL’s historical volatility is only comparable to most other large-cap value ETFs, so there’s no extra value added on that factor. Ultimately, CDL is a value play, and while that might work in some years, I’m not convinced it will over the long run. Thank you for reading, and I look forward to your questions and comments below.
