ClaudineVM
The earnings of Cathay General Bancorp (NASDAQ:CATY) will likely decline this year because of non-interest expense growth. On the other hand, loan growth will support earnings. Meanwhile, the net interest margin will likely trend upwards this year, but the average margin will still be lower in 2024 compared to 2023. Overall, I’m expecting the company to report earnings of $4.28 per share for 2024, down 12% year-over-year. The year-end target price is close to the current market price. Hence, I’m downgrading Cathay General Bancorp to a Hold Rating.
Better Days Ahead for the Margin
In my last report, which was issued before the first quarter of 2023’s results, I estimated that the margin’s expansion would slow down in 2023. I clearly underestimated the interest-rate environment and its effect on the margin, as the net interest margin actually declined by a hefty 60 basis points during the year. The margin’s decline was mostly attributable to the shifting of the funding mix towards costly time deposits and borrowings, as shown below.
4Q 2023 Earnings Release 4Q 2023 Earnings Release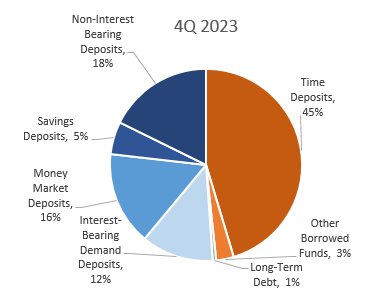
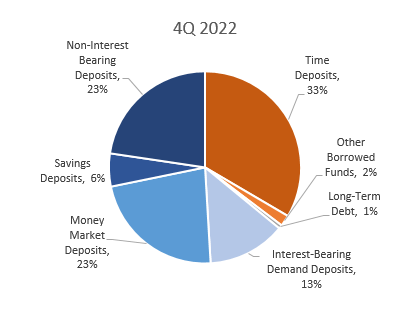
What’s more, the rate of time deposits and borrowings increased sharply.
| Funding Rates | |||||
| 4Q 2023 | 3Q 2023 | Change | 4Q 2022 | Change | |
| Interest-Bearing Demand Deposits | 2.14% | 1.98% | 16 bps | 0.78% | 136 bps |
| Money Market Deposits | 3.33% | 2.98% | 35 bps | 1.63% | 170 bps |
| Savings Deposits | 1.11% | 1.17% | -6 bps | 0.09% | 102 bps |
| Time Deposits | 4.21% | 3.91% | 30 bps | 2.13% | 208 bps |
| Other Borrowed Funds | 5.46% | 5.32% | 14 bps | 3.70% | 176 bps |
| Long-Term Debt | 5.86% | 5.75% | 11 bps | 4.09% | 177 bps |
| Source: 4Q 2023 Earnings Release |
I’m expecting the margin to fare better this year compared to last year because interest rates are likely to start declining in 2024. Approximately two-thirds of loans are fixed, while two-thirds of deposits are floating, as mentioned in the conference call. Therefore, the margin should benefit when rates are declining because more deposits than loans will re-price downwards.
The management expects the margin to slip further in 2024 to a range of 3.15%-3.25%, down from 3.27% in the fourth quarter of 2023, as mentioned in the earnings presentation.
Considering the interest-rate outlook and management’s guidance, I’m expecting the margin to grow by eight basis points in 2024. Despite the margin improvement in the next few quarters, the average margin for 2024 will likely still be lower than the average margin for last year. This is because this year’s recovery will be less steep than last year’s fall.
Loan Growth Likely to Decelerate
Cathay General Bancorp’s loan portfolio grew by an impressive 2.8% in the last quarter of 2024, leading to full-year growth of 7.1%, which exceeded my expectations. After this impressive performance, the management expects loan growth to slow down. As mentioned in the presentation, the management expects loan growth of 4% to 5% in 2024. To put this guidance in perspective, CATY’s loan portfolio has grown at a compounded annual growth rate of 6.9% over the last five years. This means that the management expects loan growth in 2024 to be below the historical average.
Cathay General caters to high-density Asian-populated urban areas across the country, especially in California and New York. Most labor markets in urban California have high unemployment rates compared to the rest of the country, but the unemployment rates are still better than in previous years.
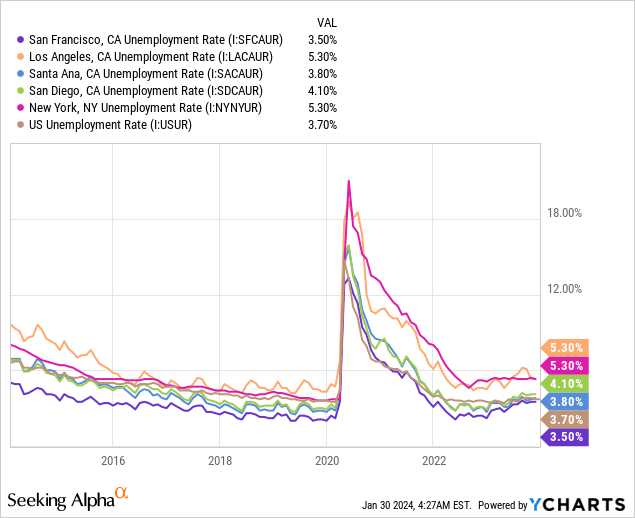
Considering the economic health of CATY’s markets and the management’s guidance, I’m expecting the loan portfolio to grow by 4% in 2024. Further, I’m expecting other balance sheet items to grow mostly in line with loans. The following table shows my balance sheet estimates.
| Financial Position | FY19 | FY20 | FY21 | FY22 | FY23 | FY24E |
| Net Loans | 14,952 | 15,475 | 16,202 | 18,101 | 19,383 | 20,170 |
| Growth of Net Loans | 7.8% | 3.5% | 4.7% | 11.7% | 7.1% | 4.1% |
| Other Earning Assets | 1,914 | 2,343 | 3,443 | 2,462 | 2,300 | 2,393 |
| Deposits | 14,692 | 16,109 | 18,059 | 18,505 | 19,325 | 20,110 |
| Borrowings and Sub-Debt | 844 | 293 | 193 | 627 | 675 | 672 |
| Common equity | 2,294 | 2,418 | 2,446 | 2,474 | 2,737 | 2,849 |
| Book Value per Share ($) | 28.6 | 30.3 | 31.1 | 33.1 | 37.6 | 39.1 |
| Tangible BVPS ($) | 23.9 | 25.6 | 26.3 | 28.0 | 32.3 | 33.9 |
| Source: SEC Filings, Author’s Estimates (In USD million unless otherwise specified) | ||||||
Expense Growth to Drag Earnings
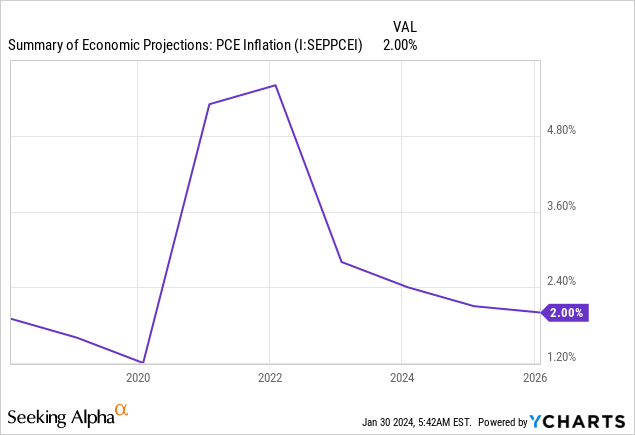
The management mentioned in the presentation that it expects non-interest expenses to grow by just 3.0% – 3.5% in 2024. This guidance appears to be too ambitious considering the company showed a remarkable lack of cost discipline last year. Non-interest expenses actually surged by 17.6% in the last quarter alone. Moreover, although the Fed anticipates further disinflation this year (see below), the inflation rate will be still high relative to the pre-pandemic average.
As a result, I’ve decided to assume that non-interest expenses will grow by a low double-digit rate this year. I’m expecting an efficiency ratio (calculated as non-interest expenses divided by total revenue) of 50% for 2024, which is higher than the efficiency ratio of 47% for 2023.
Expense growth will likely be the biggest contributor to an earnings decline this year. It will most probably undermine the anticipated loan growth. Overall, I’m expecting the company to report earnings of $4.28 per share for 2024, down 12% year-over-year. The following table shows my income statement estimates.
| Income Statement Summary | FY19 | FY20 | FY21 | FY22 | FY23 | FY24E |
| Net interest income | 575 | 552 | 598 | 734 | 742 | 760 |
| Provision for loan losses | (7) | 58 | (16) | 15 | 26 | 16 |
| Non-interest income | 45 | 43 | 55 | 57 | 68 | 84 |
| Non-interest expense | 277 | 283 | 287 | 303 | 380 | 423 |
| Net income – Common Sh. | 279 | 229 | 298 | 361 | 354 | 312 |
| EPS – Diluted ($) | 3.48 | 2.87 | 3.80 | 4.83 | 4.86 | 4.28 |
| Source: SEC Filings, Author’s Estimates (In USD million unless otherwise specified) | ||||||
Risks are Moderate in General
In the following two areas, Cathay General’s risk level is low:
- According to details given in the presentation, Commercial Real Estate office loans make up around 4% of total loans, which isn’t too bad.
- Unrealized losses on the available-for-sale securities portfolio amounted to $176 million at the end of September 2023, which is just 7% of the total equity balance. (Note: the value for December 2023 hasn’t been released yet).
However, the deposit book has a high-risk level. Uninsured deposits made up a whopping 40.9% of total deposits at the end of 2023, as mentioned in the presentation. Overall, I think Cathay General’s risk level is low to moderate.
Downgrading to a Hold Rating
Cathay General is offering a dividend yield of 3.1% at the current quarterly dividend rate of $0.34 per share. The earnings and dividend estimates suggest a payout ratio of 32% for 2024, which is in line with the five-year average of 32%. Therefore, the negative earnings outlook does not threaten the dividend payout.
I’m using the historical price-to-tangible book (“P/TB”) and price-to-earnings (“P/E”) multiples to value Cathay General. The stock has traded at an average P/TB ratio of 1.35 in the past, as shown below.
| FY19 | FY20 | FY21 | FY22 | FY23 | Average | |
| Tangible BVPS ($) | 23.9 | 25.6 | 26.3 | 28.0 | 32.3 | |
| Average Market Price ($) | 35.9 | 27.2 | 40.4 | 42.9 | 36.5 | |
| Historical P/TB | 1.50x | 1.06x | 1.54x | 1.53x | 1.13x | 1.35x |
| Source: Company Financials, Yahoo Finance, Author’s Estimates | ||||||
Multiplying the average P/TB multiple with the forecast tangible book value per share of $33.9 gives a target price of $45.8 for the end of 2024. This price target implies a 4.9% upside from the January 29 closing price. The following table shows the sensitivity of the target price to the P/TB ratio.
| P/TB Multiple | 1.15x | 1.25x | 1.35x | 1.45x | 1.55x |
| TBVPS – Dec 2024 ($) | 33.9 | 33.9 | 33.9 | 33.9 | 33.9 |
| Target Price ($) | 39.1 | 42.4 | 45.8 | 49.2 | 52.6 |
| Market Price ($) | 43.7 | 43.7 | 43.7 | 43.7 | 43.7 |
| Upside/(Downside) | (10.6)% | (2.8)% | 4.9% | 12.7% | 20.5% |
| Source: Author’s Estimates |
The stock has traded at an average P/E ratio of around 9.4x in the past, as shown below.
| FY19 | FY20 | FY21 | FY22 | FY23 | Average | |
| Earnings per Share ($) | 3.5 | 2.9 | 3.8 | 4.8 | 4.9 | |
| Average Market Price ($) | 35.9 | 27.2 | 40.4 | 42.9 | 36.5 | |
| Historical P/E | 10.3x | 9.5x | 10.7x | 8.9x | 7.5x | 9.4x |
| Source: Company Financials, Yahoo Finance, Author’s Estimates | ||||||
Multiplying the average P/E multiple with the forecast earnings per share of $4.28 gives a target price of $40.1 for the end of 2024. This price target implies an 8.2% downside from the January 29 closing price. The following table shows the sensitivity of the target price to the P/E ratio.
| P/E Multiple | 7.4x | 8.4x | 9.4x | 10.4x | 11.4x |
| EPS 2024 ($) | 4.28 | 4.28 | 4.28 | 4.28 | 4.28 |
| Target Price ($) | 31.5 | 35.8 | 40.1 | 44.4 | 48.6 |
| Market Price ($) | 43.7 | 43.7 | 43.7 | 43.7 | 43.7 |
| Upside/(Downside) | (27.8)% | (18.0)% | (8.2)% | 1.6% | 11.4% |
| Source: Author’s Estimates |
Equally weighting the target prices from the two valuation methods gives a combined target price of $43.0, which implies a 1.6% downside from the current market price. Adding the forward dividend yield gives a total expected return of 1.5%.
In my last report on Cathay General, I determined a target price of $46.7 per share for the end of 2023 and adopted a buy rating. Since the issuance of that report, CATY’s stock price has rallied leaving a small downside to the target price for the end of 2024. As a result, I’m downgrading Cathay General to a hold rating.

 Q2 2024 Earnings Call Transcript")

