With motor thefts on the rise due to criminals using a host of new technologies and techniques, a new study has revealed which areas are most at threat.
Cleveland Police in the North East reported one of the lowest volumes of car thefts across 36 different forces who responded to the recent study, at 793 vehicles stolen in total in 2022.
However, with just 76,807 cars registered in the region, drivers living there have the highest likelihood of having their vehicle pinched, with 12.67 stolen for every 1,000 registered motors, the report calculated.
Find out how high up the rankings your area sits for car crime as we exclusively list the results from every police force below.
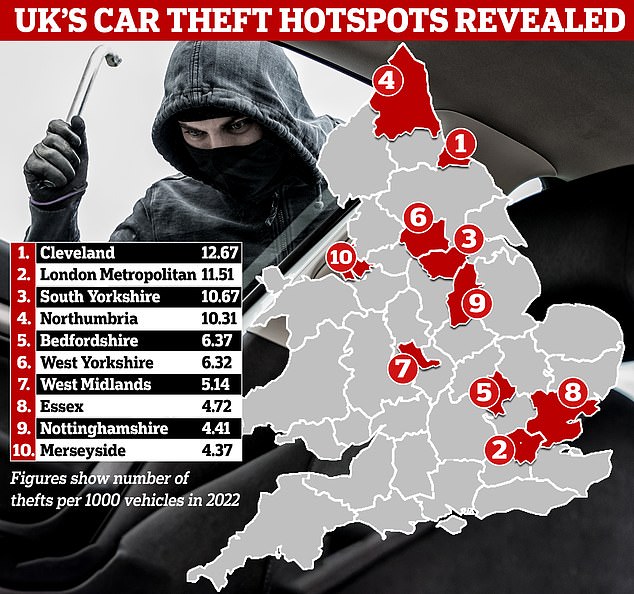
These are the 10 parts of the country worst hit by the rise in motor theft. The ratio is based on car thefts per 1,000 vehicles registered in each area
The numbers reveal Cleveland has a higher theft ratio than London, despite Met Police receiving 35,220 reports of stolen vehicles last year.
However, with over three million (3,060,988) cars registered in the capital, its theft ratio per 1,000 vehicles was lower at 11.51.
This was enough to be second in the rankings, ahead of South Yorkshire, which has a 2022 motor theft ratio of 10.67 vehicles per 1,000 registered in the region.
The research looking into the nation’s car theft hotspots has been carried out by comparison website Go Compare.
It sent a Freedom of Information requests to all 45 police forces across the UK, with 36 coming back with figures.
Those that failed to provide data include City of London Police, Thames Valley Police, Sussex Police, Hampshire and Isle of Wight Constabulary, Devon and Cornwall Police, Humberside Police, Greater Manchester Police, South Wales Police, and Police Scotland.
Using Department for Transport data on the number of registered motors in each region, it then calculated what the theft ratio for each is based on the number of cars – then ranked the areas by risk.
Meanwhile, at the opposite end of the scale, the police force area with the lowest ratio of car thefts was Dyfed-Powys in Wales, with only 0.49 thefts for every 1,000 registered cars.
Gloucestershire, Cumbria, Suffolk and Norfolk also all had a car theft ratio below one in every 1,000 vehicles.
Cleveland Police reported one of the lowest volumes of car thefts across 36 different forces who responded to the recent study, at 793 vehicles stolen in total in 2022. Yet this is a theft rate of 12.67 cars stolen per 1,000 registered in the area

Almost half of all police forces reported the Ford Fiesta has the most stolen model in their areas
The study also supported exclusively data provided to This is Money that shows the Ford Fiesta was the UK’s most stolen model last year.
A massive 3,392 Fiestas were reported as stolen by owners in Britain in 2022, which is unsurprisingly, given it’s the most-owned car in Britain.
Go.Compare’s own research found that the incredibly popular supermini was named the most stolen car in 2022 by almost half (48 per cent) of all police forces it contacted, compared to less than a third (30 per cent) in 2019.
Fiestas have become increasingly targeted by thieves since Ford announced a year ago that its volume-selling small car was to be axed this summer.
With production eventually ceasing in July, a massive second-hand parts market has been created because new parts for these vehicles are also no longer being produced.
And with over 1.5 million licenced Fiestas on our roads today, there is likely to be big demand for used parts.
‘Criminals have been quick to jump on this opportunity, lucratively selling on stolen Ford Fiesta parts on the black-market,’ Clive Wain, a former detective chief superintendent and now head of police liaison at Tracker, told This is Money in September.
Tom Banks, motoring expert at Go Compare, said: ‘Car theft is always a concern for car owners. Although you can take precautions, it’s not an event that can be fully predicted or avoided.
‘Knowing which locations bring the biggest risk of theft can help drivers take extra safety measures, especially for those with more coveted cars.
‘Ensuring your vehicle is properly covered by your insurance can also help reduce anxiety surrounding car theft.’
He added: ‘If you have the misfortune of having your car stolen, you should immediately contact the police to file a report. Remember to ask for the crime reference number, as you’ll need this to begin a claim with your insurer.’
Below is the list of the 36 police forces who responded and the order of vehicle theft risk:
| Police force | Number of reported thefts in 2022 | Car registrations per area in 2022 | 2022 Ratio (number of thefts per 1000 vehicles) |
|---|---|---|---|
| Cleveland | 973 | 76,807 | 12.67 |
| London Metropolitan | 35,220 | 3,060,988 | 11.51 |
| South Yorkshire | 7,747 | 726,017 | 10.67 |
| Northumbria | 2,054 | 199,201 | 10.31 |
| Bedfordshire | 1,247 | 195,825 | 6.37 |
| West Yorkshire | 8,009 | 1,267,620 | 6.32 |
| West Midlands | 15,300 | 2,977,895 | 5.14 |
| Essex | 4,592 | 972,361 | 4.72 |
| Nottinghamshire | 2,203 | 499,872 | 4.41 |
| Merseyside | 2,918 | 668,236 | 4.37 |
| Leicestershire | 1,942 | 476,033 | 4.08 |
| Staffordshire | 2,320 | 575,897 | 4.03 |
| Gwent | 880 | 252,629 | 3.48 |
| Lancashire | 2,479 | 723,373 | 3.43 |
| Durham | 965 | 292,106 | 3.30 |
| Cambridgeshire | 1,349 | 429,769 | 3.14 |
| Derbyshire | 1,736 | 592,620 | 2.93 |
| Warwickshire | 1,198 | 410,699 | 2.92 |
| Dorset | 795 | 283,565 | 2.80 |
| Hertfordshire | 2,046 | 743,688 | 2.75 |
| Cheshire | 1,233 | 489,207 | 2.52 |
| Kent | 2,338 | 968,548 | 2.41 |
| Surrey | 1,890 | 794,241 | 2.38 |
| West Mercia | 1,458 | 784,887 | 1.86 |
| North Yorkshire | 695 | 435,915 | 1.59 |
| Northamptonshire | 779 | 506,005 | 1.54 |
| Lincolnshire | 766 | 513,843 | 1.49 |
| Wiltshire | 542 | 370,202 | 1.46 |
| Avon and Somerset | 2,545 | 2,000,291 | 1.27 |
| Northern Ireland | 1,298 | 1,207,743 | 1.07 |
| North Wales | 492 | 462,330 | 1.06 |
| Norfolk | 491 | 610,828 | 0.80 |
| Suffolk | 378 | 529,246 | 0.71 |
| Cumbria | 234 | 336,506 | 0.70 |
| Gloucestershire | 363 | 540,658 | 0.67 |
| Dyfed-Powys | 54 | 109,406 | 0.49 |
| Source: Go.Compare Car Insurance using car theft data provided by 36 police forces and vehicle registration figures published by the DfT at the end of 2022 *The data used excludes the following UK police forces, due to a lack of information provided: City of London Police, Thames Valley Police, Sussex Police, Hampshire and Isle of Wight Constabulary, Devon and Cornwall Police, Humberside Police, Greater Manchester Police, South Wales Police, and Police Scotland. |
|||
Catalytic converter crime is falling but vehicle thefts are on the rise due to parts shortage, says Admiral
Separate research conducted by insurer Admiral has revealed how criminals are changing their behaviour and tactics to car theft in recent months.
Catalytic converters – particularly on older hybrid cars – have been the target for criminals for several years due to the high-value metals they contain, but new research suggests thieves have turned their attention to stealing cars and stripping them down as the cost and scarcity of car parts continues.
Analysis of its own claims data has found that catalytic converter thefts are down 76 per cent year-on-year but keyless vehicle thefts are on the rise.
It estimates that nine in 10 (93 per cent) of all cars that were stolen and recovered in 2022 were taken without the keys present.
And once a car is pinched, there is little chance of it being recovered.
Figures attained from 39 UK forces via a freedom of information request by Nextbase last month showed that between 2019 and 2022 just 6.7 per cent of 396,000 reported car crimes resulted in someone being charged, let alone vehicles being returned.
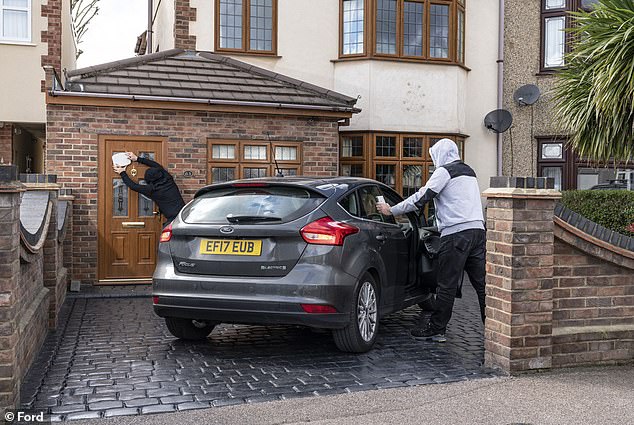
Criminals usually go in pairs to steal keyless cars. One holds a transmitter and stands next to the vehicle while the other stands close to the house holding an amplifier
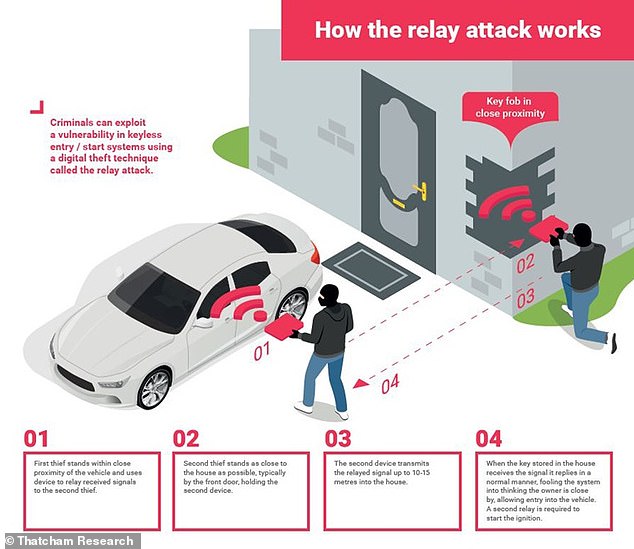
This graphic shows the four-step explanation for how criminals use relay attacks to steal motors
And Admiral’s own data shows the recovery rate for vehicles is between 45 per cent and 50 per cent, with pinched cars often quickly moved to illegal ‘chop shops’ across the country for dismantling for their lucrative parts or if stolen to order, shipped abroad.
Clive Wain, adds: ‘There has been a boom in chop shops over the last few years due to the increased demand for car parts.
‘Historically we saw most chop shops set up near UK ports as cars were stripped and their parts shipped overseas.
‘However, the increased value and scarcity of car parts in the UK has meant more cars are taken to chop shops in other parts of the UK.
‘Last year we located 44 chop shops nationally and have seen them springing up in the West Midlands, South Yorkshire, Greater Manchester and Nottinghamshire, it’s easy to become a target as a car can be stolen and moved at speed.’
Some links in this article may be affiliate links. If you click on them we may earn a small commission. That helps us fund This Is Money, and keep it free to use. We do not write articles to promote products. We do not allow any commercial relationship to affect our editorial independence.
