tadamichi
Written by Nick Ackerman, co-produced by Stanford Chemist.
John Hancock Financial Opportunities (NYSE:BTO) is a closed-end fund that provides equity exposure to the financial sector. That includes both large, too-big-to-fail banking institutions and regionals; even some asset management and REIT exposure is thrown in there as well. The fund currently trades at an ever so slight premium, though a premium is not unusual for this fund. In fact, historically speaking, the current valuation is right near its longer-term level.
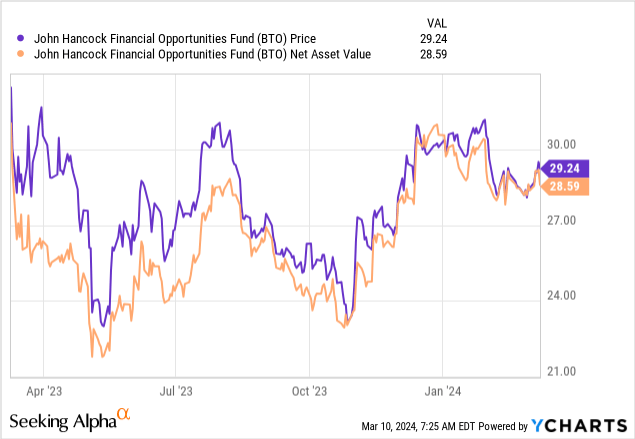
Since our last update, BTO has performed poorly. That said, it has been quite some time since we’ve given this fund a look. Since then, we had the banking crisis hit in March 2023, and even more recently, there have been some questions about financial stability popping back up again. Even despite the added volatility in this space, the fund was trading at a slight discount the last time we touched on this name. That means performance would have been even worse if it hadn’t been for the fund moving to trade at a bit of a premium to its NAV per share.
BTO Performance Since Prior Update (Seeking Alpha)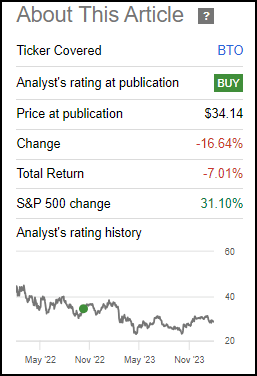
BTO Basics
- 1-Year Z-score: -0.75
- Premium: 2.27%
- Distribution Yield: 8.89%
- Expense Ratio: 1.60%
- Leverage: 17.91%
- Managed Assets: $698.06 million
- Structure: Perpetual
BTO’s investment objective is “capital appreciation and current income.” To achieve this, they simply “invest at least 80% of assets in equity securities of U.S. and foreign financial services companies.” While they mention foreign financials, they are nearly 94% invested in U.S. institutions, which has been fairly consistent over the fund’s history.
The fund also employs leverage, with rising interest rates, which has seen the fund’s total expenses rise. As of the latest fiscal year-end 2023, the total expense ratio came in at 3.16% – with expense reductions, it has taken it down to a still high of 2.96%. That’s up from the 1.93% in the prior FY 2022. The fiscal year-end for this fund is the same as the calendar year.
However, the fund has utilized interest rate swaps. So, while the income of the fund has taken a hit, and that meant a higher expense ratio, this was hedged through the fund seeing gains on its interest rate swaps. The latest outstanding borrowings came to $125 million, and the notional value of their interest rate swaps came to $85 million. Meaning that roughly 68% of their borrowings were hedged.
Performance – Persistent Premium
This fund is currently trading at a bit of a discount. That would often be considered ‘expensive’ for a closed-end fund, but on a relative basis, this fund isn’t trading too richly based on its own historical averages. That’s why we actually see a negative 1-year z-score.
It wasn’t just the last year either; it has been trading at or near a premium consistently for the last decade. The last few years were a bit of an outlier as since around Covid, the fund’s premium had started to climb.
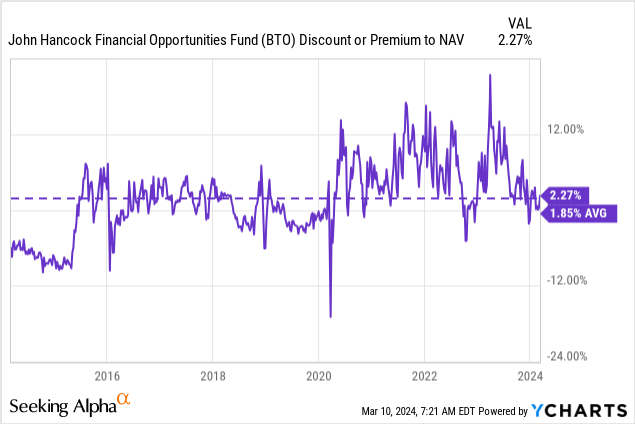
The fund has a long history, going back to its inception in 1994. That provides a long track record to look back on this fund in terms of a track record. Past performance isn’t any guarantee of future results, but it’s still worth taking a look at. In this case, the fund’s total return on a NAV basis has put up quite respectable returns against its benchmark over the last 3, 5 and 10 years.
BTO Annualized Returns (John Hancock)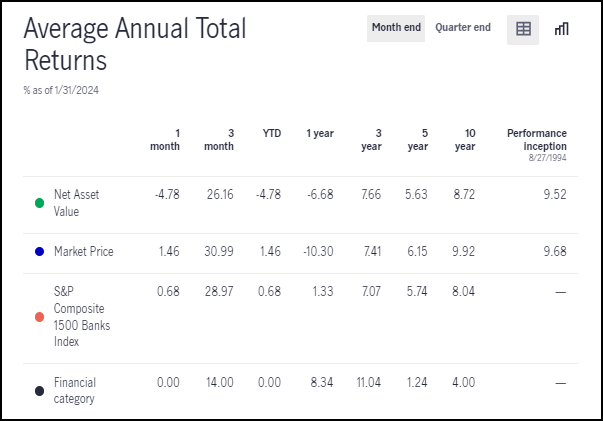
Unfortunately, over the last 1 year, the fund has begun to struggle on a relative basis against its benchmarks.
Another comparison that investors are apt to make is against the Financial Select Sector SPDR ETF (XLF). That is an ETF that provides exposure to the equity positions of financial institutions as well. It comes with a much lower expense ratio, and that’s likely a big draw on investing in XLF rather than BTO.
Over the last decade, XLF has been able to outperform significantly as well. However, that outperformance primarily came in during the last year as well when BTO has been seemingly starting to struggle. This is in contrast to the last time we gave BTO a look. It had BTO, which was the outperformer at that time.
Ycharts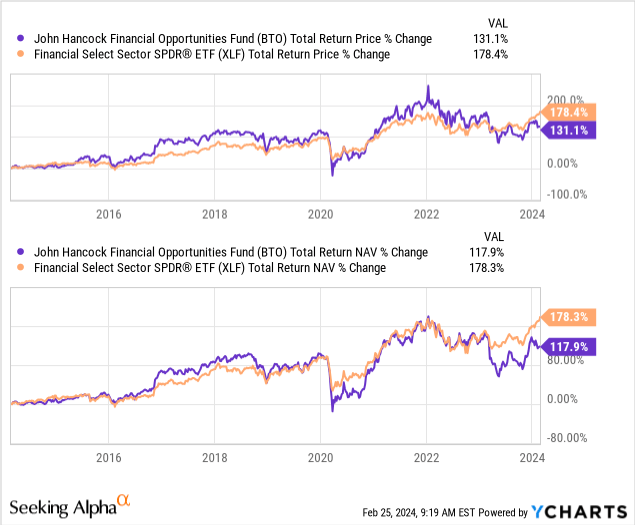
Besides a higher expense ratio, portfolio selection and leverage utilization are other driving factors causing this. BTO started to underperform during two notable periods, COVID-19 and the banking crisis. Leverage amplifies the downside and adds risks, so clearly, this is a reflection of that.
Further, BTO and XLF, despite focusing on the financial sector, are carrying quite different portfolios. The largest position in XLF is actually Berkshire Hathaway Class B (BRK.B) at over a 13.5% allocation. The fund also holds mostly only large institutions – those that aren’t as economically sensitive relative to their regional counterparts.
We can see that playing out when we take a look at the performance comparisons, but this time, we are adding SPDR S&P Regional Banking ETF (KRE) to the mix.
Ycharts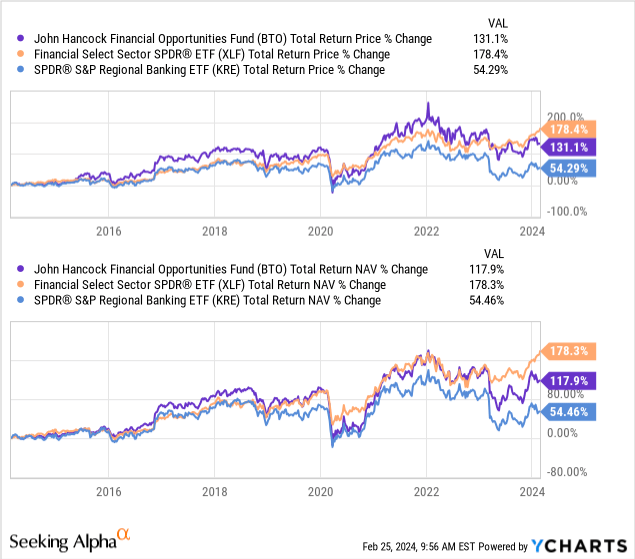
For that reason, it could be argued that BTO provides more diversified and broader exposure relative to XLF. Instead, it is more of a hybrid between XLF and KRE, which is why the fund’s benchmark of the S&P Composite 1500 Banks Index would be more appropriate.
If the fund can return to a higher premium once again, that could also drive some outperformance on a total share price return basis, even if the underlying portfolio does continue to lag a bit. Those are just something investors could consider and would be the primary selling points of BTO.
Distribution Looking Enticing
Of course, another selling point for BTO is the significantly higher distribution that it offers to investors. The fund’s latest distribution rate comes to 8.89%, and that’s compared to the 9.09% for the fund’s NAV rate. The NAV rate being a touch higher due to the slight premium that the fund is trading at.
BTO Distribution History (CEFConnect)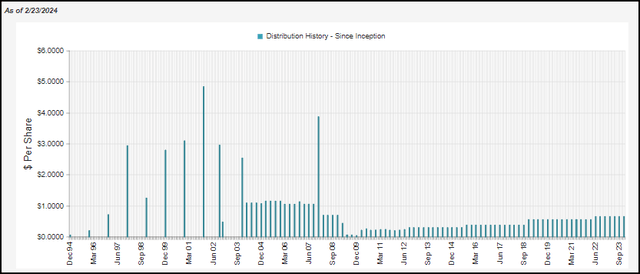
That said, this comes directly from paying out capital gains along with the income generated on the portfolio, not just the income alone like XLF. So, one could just sell shares of XLF or KRE to fund a higher distribution, in a sense, if they wanted. With BTO, they are doing this for you along the way, and whether you reinvest or not then becomes your choice. After all, you pay a higher management fee because they are actively managing these sorts of things for you.
In the last year, the fund’s NII decreased in part due to the higher interest costs on the borrowings. This was even as the fund enjoyed issuing new shares due to trading at a premium. One of the added benefits of a CEF trading at a premium is that when shares are issued through an at-the-market offering and DRIP, it is accretive to NAV.
BTO Annual Report (John Hancock)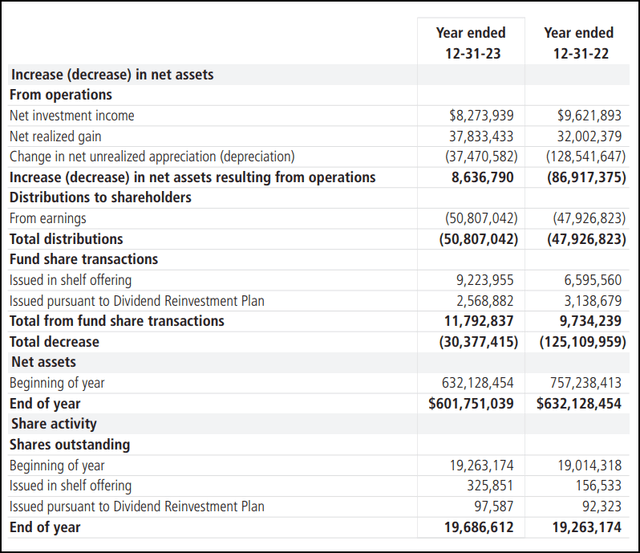
On a per-share basis, NII went from $0.50 to $0.42. Based on the current quarterly distribution of $0.65, that does mean that NII coverage is sitting only around 16.2%. Lower interest rates from the Fed, whenever that should come, could see this coverage increase.
A significant portion of the rest of the distribution will have to be covered through gains in the portfolio. The current distribution rate of just over 9% also suggests that coverage has been a bit of a problem now as they aren’t earning that sort of rate on an annualized basis.
Since they are able to sell new shares at the same time, they may choose to continue paying the current distribution rate even with coverage looking rather weak. The managers may also be optimistic that the fund can recover going forward as well. Once it slumped last March, it started an initial recovery, but it has been a bit of a struggle as regionals still remain a bit precarious.
New York Community Bancorp (NYCB) is the latest regional bank to take a massive hit and provide uncertainty to the space.
For tax purposes, the characterizations have mostly followed along with the coverage we saw above. That is some ordinary income but primarily long-term capital gains.
BTO Distribution Tax Classifications (John Hancock)
BTO’s Portfolio
The fund is primarily invested in banks, but there are a number of other sectors the fund is invested in as well. That includes some REITs in the industrial, retail, hotel and even office space.
BTO Industry Exposure (John Hancock)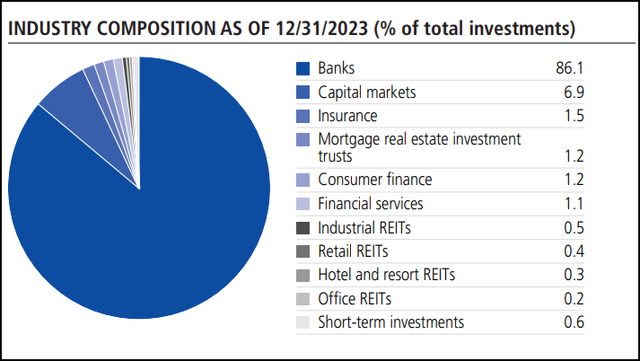
The office exposure is only one position. It is the Hudson Pacific Properties (HPP), and it isn’t the common equity. Instead, it is the 4.75% preferred (HPP.PR.C). They aren’t making a bet that HPP will perform well; they are just looking to make the bet that it survives and continues paying the preferred dividend. The current yield on that preferred is up to 8.67% as of writing.
Going back to NYCB, this is a position in BTO. At least, it was as of their last annual report. It was also a very small position for the fund at around 0.77% of total net assets. With the bank’s shares plunging, the position would have become even smaller for the fund. Overall, the fund isn’t too concentrated either, and that seems fortune given how fast some banks can collapse.
BTO Top Ten Holdings (John Hancock)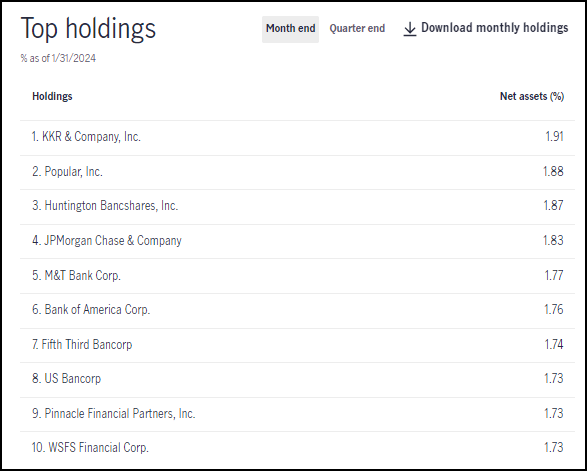
In total, the top ten make up around 18% of the fund’s net assets. The percentage weights here are all relatively close and provide some good balance and diversification. It is essentially not making a bet on any one position performing well in the future, but for the financial sector and regionals from now on to perform better.
Conclusion
BTO is invested heavily in banks, including the largest financial institutions, but also the regionals-the fund trades at around parity with its NAV per share. While we usually like to see some significant discounts before investing in CEFs, BTO’s valuation is actually relatively fair based on its historical levels. It certainly doesn’t seem like a steal, but it doesn’t look expensive either.
Instead, this fund is more of a bet on the financial sector not falling apart going forward. This likely will require the Fed to get their interest rate levels just right. They can’t leave rates too high for too long, but conversely, they can’t cut too soon only to see inflation start to get out of control again (i.e., getting the soft landing scenario.)
With all that being said, I have owned a position in BTO for a couple of years now and bought more during the March banking crisis. For now, I’m happy to be patient at this time before considering adding further to my position. Ideally, I’d like to see a 5%+ discount, and that could come from more volatility in the market.


