Justin Sullivan
Thesis
In my previous article about Broadcom Inc. (NASDAQ:AVGO), I explained how the stock had a significant upside after the 26% rally that preceded my article. The reason for this was that throughout two DCF models, the worst scenario was that this stock was fairly valued, but the most optimistic model suggested a fair price which was 34.8% above the stock price at that time. This model was released after Q4 2023 earnings, which were released on December 7, 2023. Since then, the stock has climbed by 14.87%.
In this article, I will update my models with the newly available Q1 2024 earnings data, which was released on March 7 from the present year. After conducting the valuation process, I concluded that Broadcom’s fair price stands at $2,006.62, a 53.3% upside from the current stock price of $1,308.72, and a future price for 2029 of $3,676.77, which in other words means 30.2% annual returns throughout 2029. I also compared this with the average consensus and I observed that my EPS estimates are way lower. Furthermore, I also hypothesized about what could happen if networking operations didn’t grow at a 38% annual rate, and the result was that the stock was fairly valued. These results mean that Broadcom is a decent risk-rewards opportunity, and because of this, I will increase my rating on Broadcom from buy to strong buy.
Seeking Alpha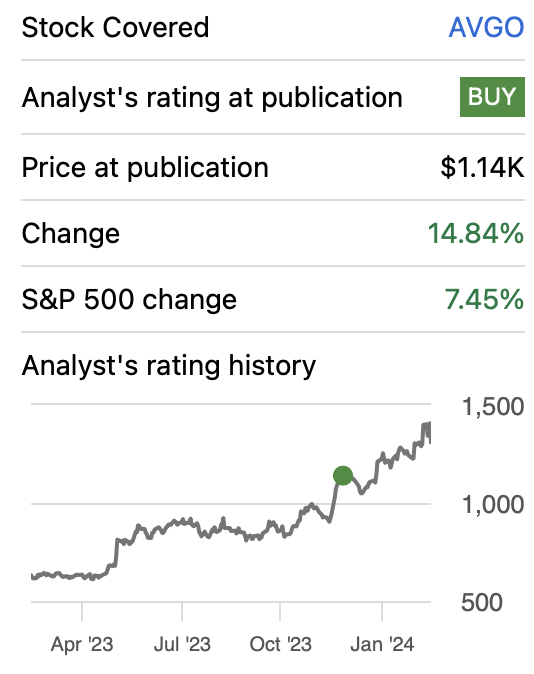
Overview
Growth Plans
Broadcom is focused on huge companies to which then it offers complimentary solutions tied to its main solutions. Regarding M&As, Broadcom is famous for acquiring companies to later dramatically cut expenses. With this, they plan to build one of the world’s leading enterprise software businesses.
How does Broadcom Compare against Peers?
Broadcom is a diverse conglomerate because of its many acquisitions throughout the years. For this reason, I will concentrate on the most important ones: Networking, Wireless, and broadband. I acknowledge that the software division of Broadcom is important but it has 5 divisions inside and each division represents 5% of revenues.
In the enterprise networking market, Broadcom has a market share of 14.54%. The leader here is Cisco Systems, Inc. (CSCO) which has a market share of around 47.6% as of the year 2023. Another huge competitor is Dell Technologies Inc. (DELL), with a market share of 29.35%. CISCO, Dell, and Broadcom jointly dominate around 91.49% of the market.
These figures were calculated by dividing the networking revenue of the respective companies by the total market size of $61.2 billion in 2023.
Author’s Calculations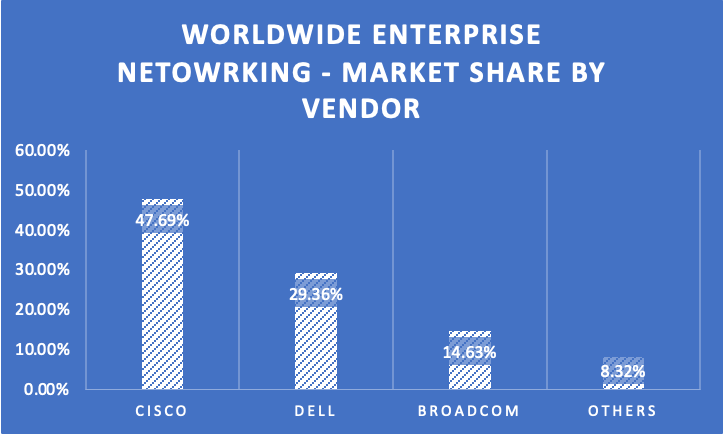
The global network equipment market was valued at $174.81 billion in 2023. From this, we can deduce that Broadcom’s market share stands at around 4.71%. The largest players are Huawei, 28.23%, and Cisco, 19.64%. It’s important to clarify that in the table below, you will see Nokia Oyj (NOK), Samsung Electronics Co., Ltd. (OTCPK:SSNLF), and Broadcom as the third, fourth, and fifth by market share respectively, however, this is mainly because I didn’t search for all the companies manufacturing wireless network equipment. This means that Broadcom could be way back in the ranking, as well as Nokia and Samsung. Nevertheless, Huawei and Cisco remain the two largest players here.
Author’s Calculations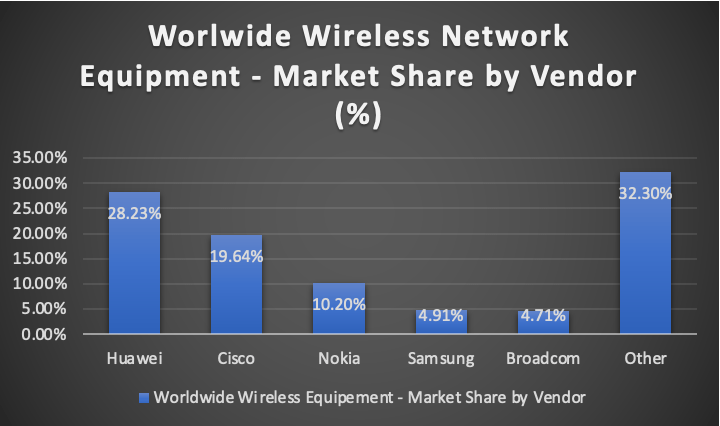
Finally, in the broadband equipment market, Broadcom holds a market share of around 14.97%. I wasn’t able to get the market share of other players because they don’t disclose their broadband revenue as explicitly as Broadcom does. Nevertheless, a 14.97% market share is already very decent. Cisco and Huawei probably have higher market shares, but again, I don’t have any means to tell the specific number.
Industry Outlook
The first market I will discuss is the worldwide network equipment market which is expected to grow at a CAGR of 9.20% throughout 2032. The market size at the end of 2023 was $32.65 billion and for 2028 it’s expected to be $50.6 billion.
Author’s Calculations Based on Allied Market Research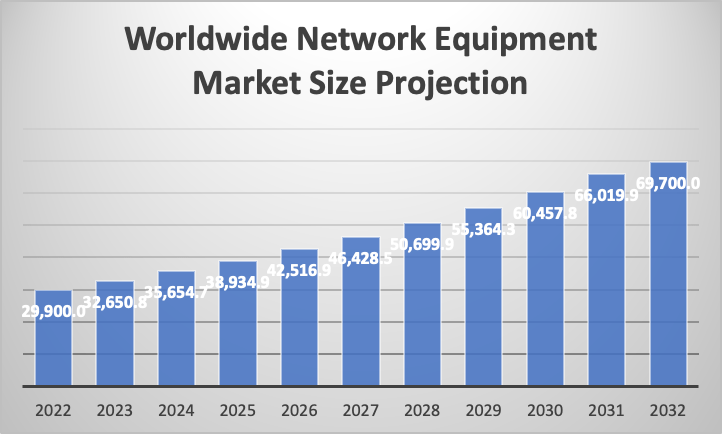
Broadcom serves all the segments of the data center market, which are networking, storage, and servers. This last one is through mainframe software which is required for the set-up of servers. Broadcom also sells distributed software, which refers to the programs that connect to multiple devices and communicate through the network. It’s categorized into the back-end, which is the servers, and the front-end, which is the software that interacts with users.
Networking is the connection of users to servers. Broadcom categorizes networking into enterprise and embedded. This last one refers to the equipment that’s needed to build the enterprise network.
The worldwide data center market is expected to generate $438.63 billion in revenue by 2028, displaying a 6.56% CAGR.
Statista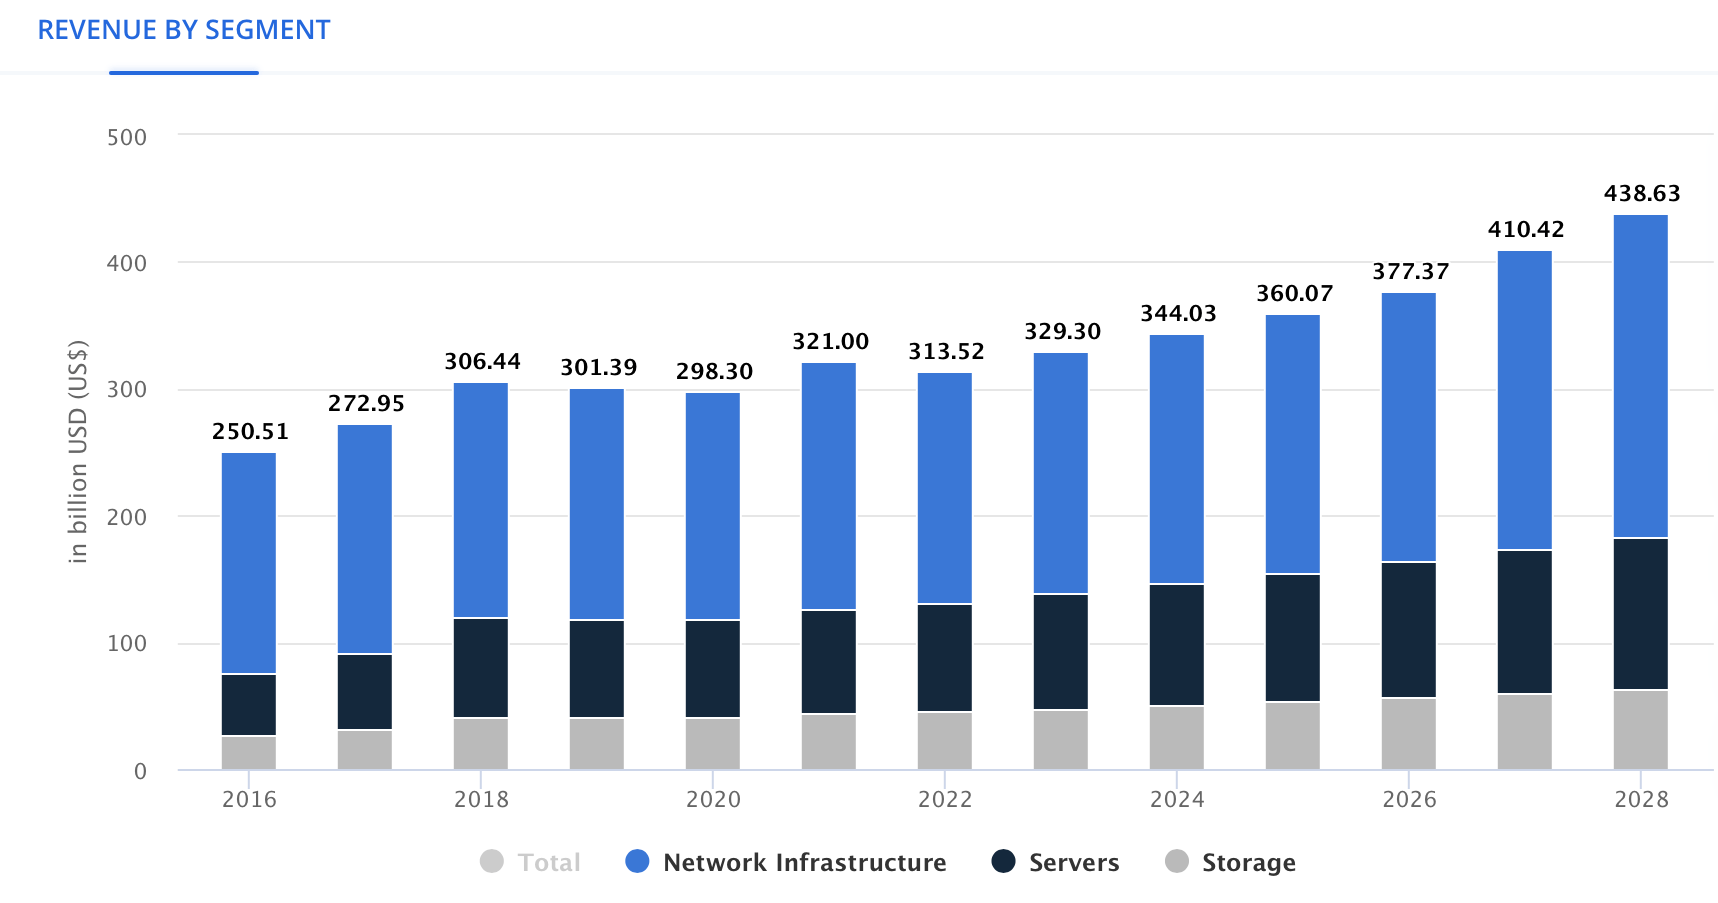
Wireless Infrastructure refers to the telecommunications equipment necessary to provide the wireless signal for mobile phones. This market is expected to reach $271.8 billion in 2028, displaying an 11% annual growth.
Precedence Research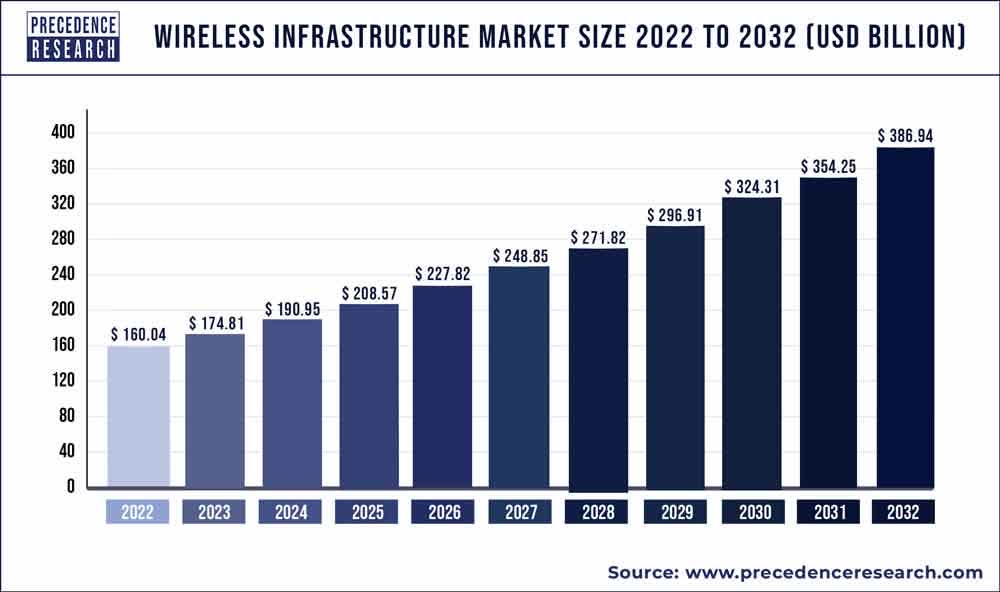
Cybersecurity is a market poised for significant growth. In 2028 the revenue of the worldwide cybersecurity market is expected to reach $273.50 billion, translating into an annual CAGR of 10.48%.
Statista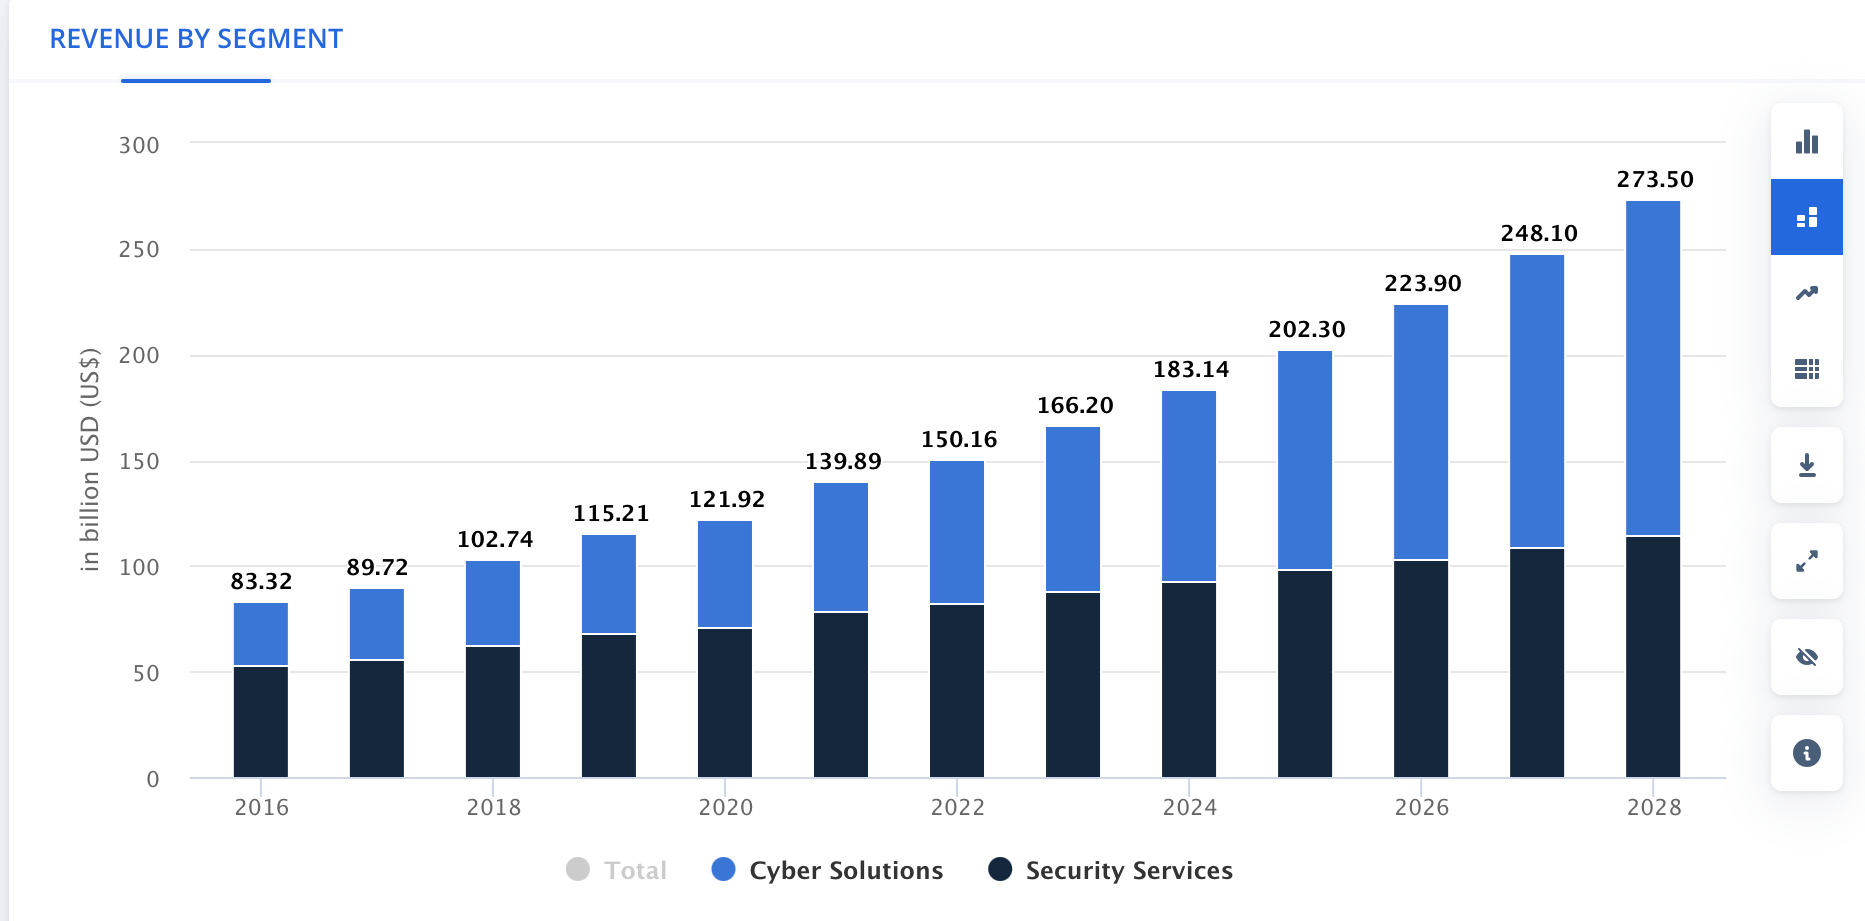
SAN (Storage Area Network) is a network of storage devices that is aimed at servers. This facilitates access to a centralized pool of data. Broadcom’s offer here is a fiber channel (FC) that enables PCs to connect to the SAN.
Available forecasts indicate that the global SAN market will grow at a CAGR of 24.7% throughout 2028 when it’s expected to reach a valuation of $56.2 billion.
Author’s Calculation based on Statsmarketresearch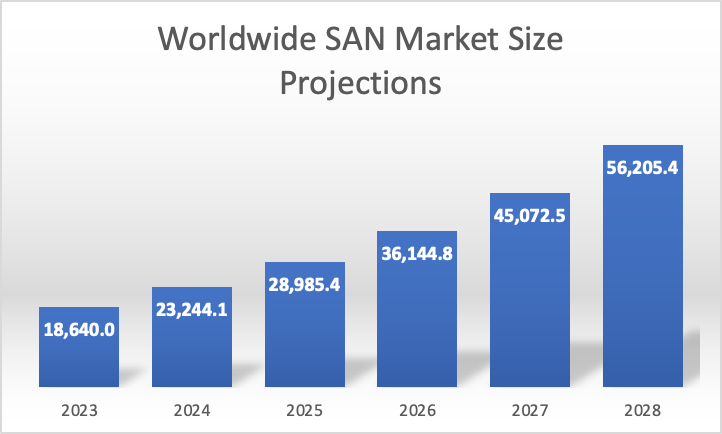
The last market in which Broadcom operates is payment security, which is anticipated to grow at a CAGR of 15.44% throughout 2028, at which it should arrive at a valuation of $48.14 billion.
Author’s Calculations Based on Mordor Intelligence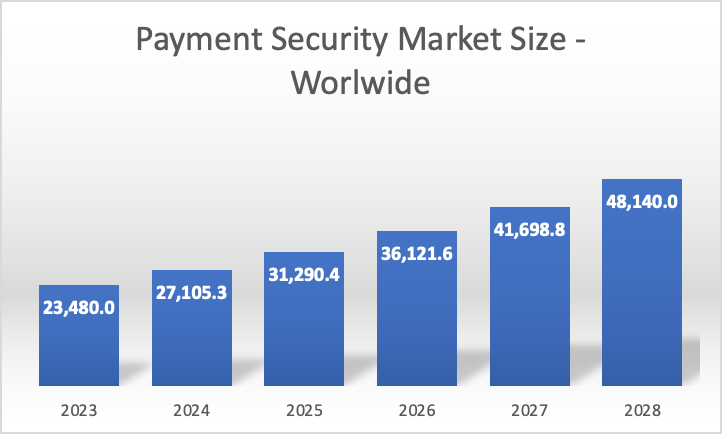
Lastly, the forecasts that I have presented mean that for 2028 the overall addressable market of Broadcom is expected to reach $1.13 trillion, which is an 8.60% annual growth from 2023’s $745.08 billion.
Headwinds
As you may have seen, Broadcom has a very diverse business, however, 75% of its revenue comes from semiconductors. As you may know, semiconductor demand is volatile and there are cycles of growth and cycles of slowdown. Nevertheless, the semiconductor shipments have expanded since they bottomed in 2022. This has been in part due to the increased demand for AI-capable chips for data centers. This means that currently, Broadcom does not have any considerable phenomenon putting at risk its financial performance.
Author’s Calculations based on WSTS
Financials
In Q1 2024, Broadcom beat EPS estimates by $0.57 and revenue by $240 million. Broadcom also provided a revenue forecast of $50 billion which is slightly lower than the consensus of $50.01 billion. Overall, nothing was interesting enough to call my attention, aside from the fact that the stock slipped even after beating estimates and forecasts coming almost in line with estimates.
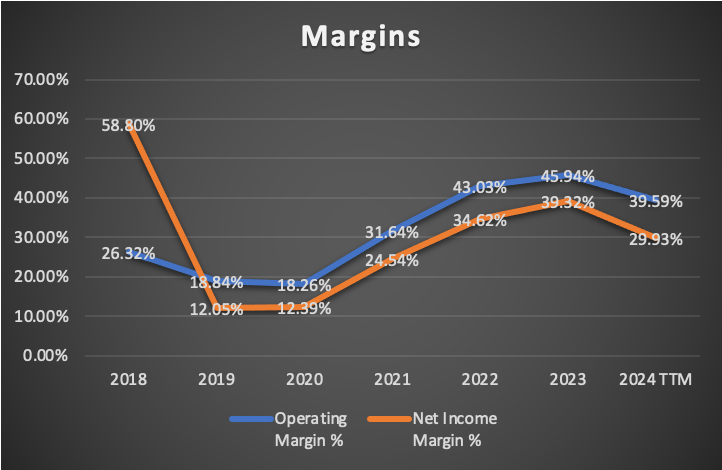
Since my previous article, which was released in Q4 2023 earnings, which were released on December 7, 2023, revenue has ticked up by 8.37% on a TTM basis. Meanwhile, operating income decreased by 6.49% and net income by 17%. This decline affected margins since operating income went down from 45.95% in Q4 2023 to 39.59%, and net income from 39.32% to 29.93%.
Author’s Calculations Author’s Calculations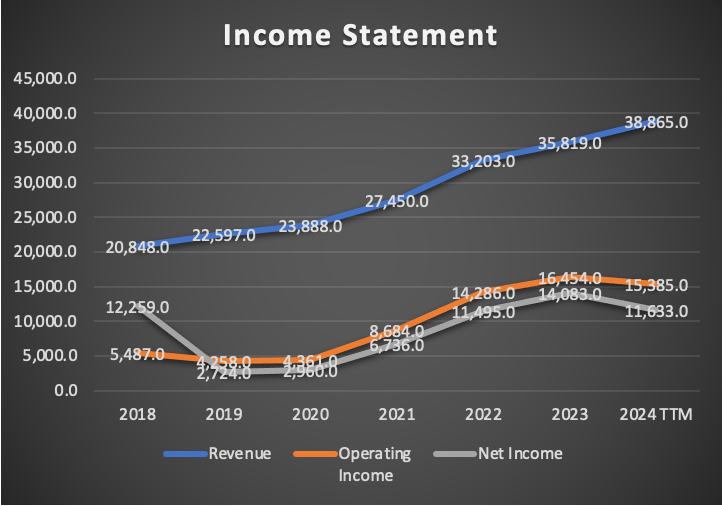
The balance sheet displayed a huge increase in long-term debt, which now stands at $73.4 billion, significantly higher than Q4 2023’s figure of $37.6 billion. Meanwhile, cash decreased by $2.3 billion. This huge increase in debt caused interest payments to increase from $1.62 billion to $2.14 billion, a 32% increase.
Author’s Calculations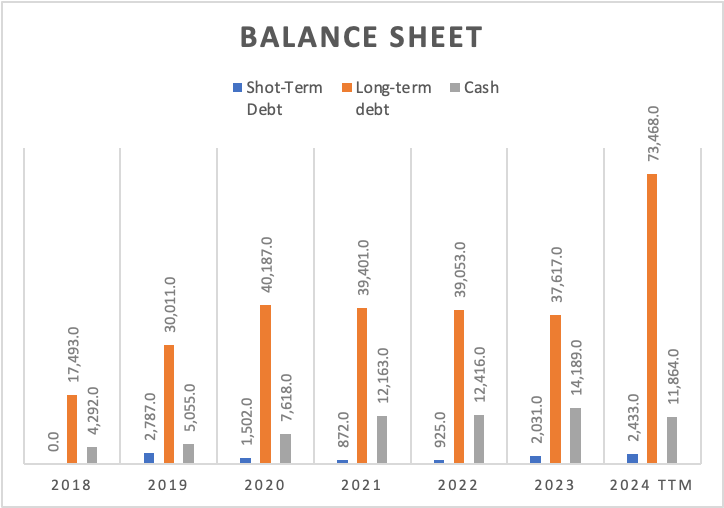
Nevertheless, despite the increase in debt and the reduction in operating & net income, free cash flow grew by 7.12%, and now it stands at $19.51 billion, up from FY2023’s $18.24 billion. However the FCF margin ticked down slightly, now it stands at 50.2%, down from 2023’s 50.9%.
Author’s Calculations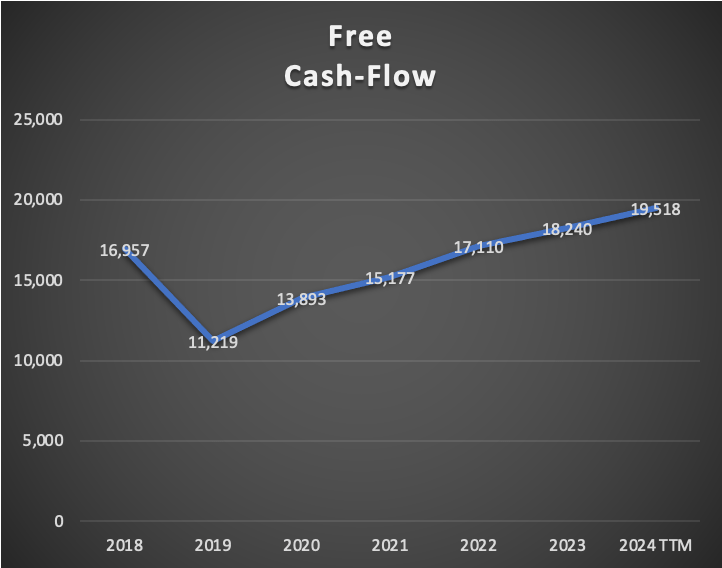
Valuation
I will value Broadcom through a DCF. In the table below, you will observe all the necessary current financial information necessary for calculating the WACC, which in this case came out at 11.63%. CapEX and D&A will be calculated with a margin tied to revenue, therefore, as revenue increases, these two variables will also increase. Meanwhile, interest expenses will grow at a pace of 26.3% annually as displayed by the average annual growth of total debt in 2018-2024 TTM.
| TABLE OF ASSUMPTIONS | |
| (Current data) | |
| Assumptions Part 1 | |
| Equity Market Price | 606,490.00 |
| Debt Value | 75,901.00 |
| Cost of Debt | 2.82% |
| Tax Rate | 8.04% |
| 10y Treasury | 4.077% |
| Beta | 1.35 |
| Market Return | 10.50% |
| Cost of Equity | 12.75% |
| Assumptions Part 2 | |
| CapEx | 471.00 |
| Capex Margin | 1.21% |
| Net Income | 11,633.00 |
| Interest | 2,142.00 |
| Tax | 1,017.00 |
| D&A | 600.00 |
| Ebitda | 15,392.00 |
| D&A Margin | 1.54% |
| Interest Expense Margin | 5.51% |
| Revenue | 38,865.0 |
The first step is to calculate the revenue for this I will concentrate on networking because here is where AI chips are mostly used and as we know, AI has recently been experiencing a boom. Broadcom’s offerings for this sector include the Jericho3-AI, which wires together supercomputers, the 112G SerDes, which enables high-data transmission between AI accelerators, and the Tomahawk 5, which is a switch that offers 51.2 terabits per second of ethernet switching. I will make this segment grow at a rate of 38%, which is in line with UBS estimates for AI chip demand. It’s also the most conservative projection I found since others suggested 40 to 50%. The other segments will be growing at their respective market CAGR, which you can see in the overview section.
Author’s Calculations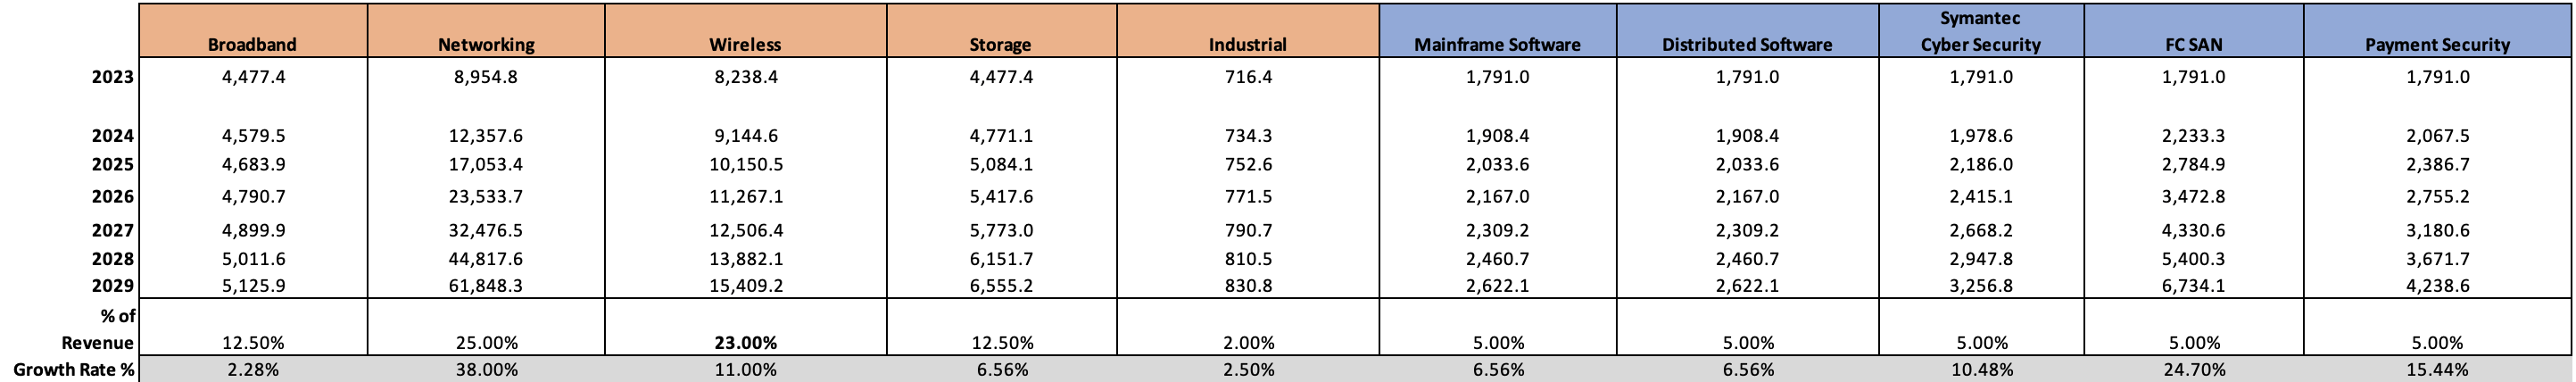
Regarding net income, the last mass layoffs were announced way back in December, when Broadcom said it would lay off 2,800 VMWare employees. Currently, there aren’t any big cost-cutting plans on the table therefore, I will imply the following net income margins: 29.93% for 2024, because currently, Broadcom has a huge debt which made interest payments jump from $1.6 billion to $2.1 billion as well as an overall increase in operating expenses. Nevertheless, for the rest of the projections, I will be optimistic and believe that Broadcom will come up with more cost-cutting, therefore for 2025 the net income margin will jump to 34.62% (which is the net income margin registered in 2022), and for 2026 onwards, the net income margin will return to its 2023 level of 39.32%.
| Revenue | Net Income | Plus Taxes | Plus D&A | Plus Interest | |
| 2024 | $41,683.3 | $12,475.81 | $13,478.80 | $14,122.31 | $16,264.31 |
| 2025 | $49,149.4 | $17,015.53 | $18,383.49 | $19,027.00 | $21,732.00 |
| 2026 | $58,757.7 | $23,103.52 | $24,960.93 | $25,868.04 | $29,284.02 |
| 2027 | $71,244.4 | $28,013.29 | $30,265.43 | $31,365.30 | $35,679.14 |
| 2028 | $87,614.7 | $34,450.11 | $37,219.73 | $38,572.33 | $44,020.01 |
| 2029 | $109,243.1 | $42,954.38 | $46,407.71 | $48,094.21 | $54,973.75 |
| ^Final EBITA^ |
Lastly, to project the future price for 2029, I will need to predict the equity value for that data. For this I will assume that long-term debt will continue to grow at the 29% pace as displayed in 2018-2024TTM, meanwhile, short-term debt will decrease at a 2.5% annual pace, marketable securities will grow by 26.9% annually, and current assets by 34.87%. All these figures were the ones displayed in the period 2018-2024TTM.
Author’s Calculations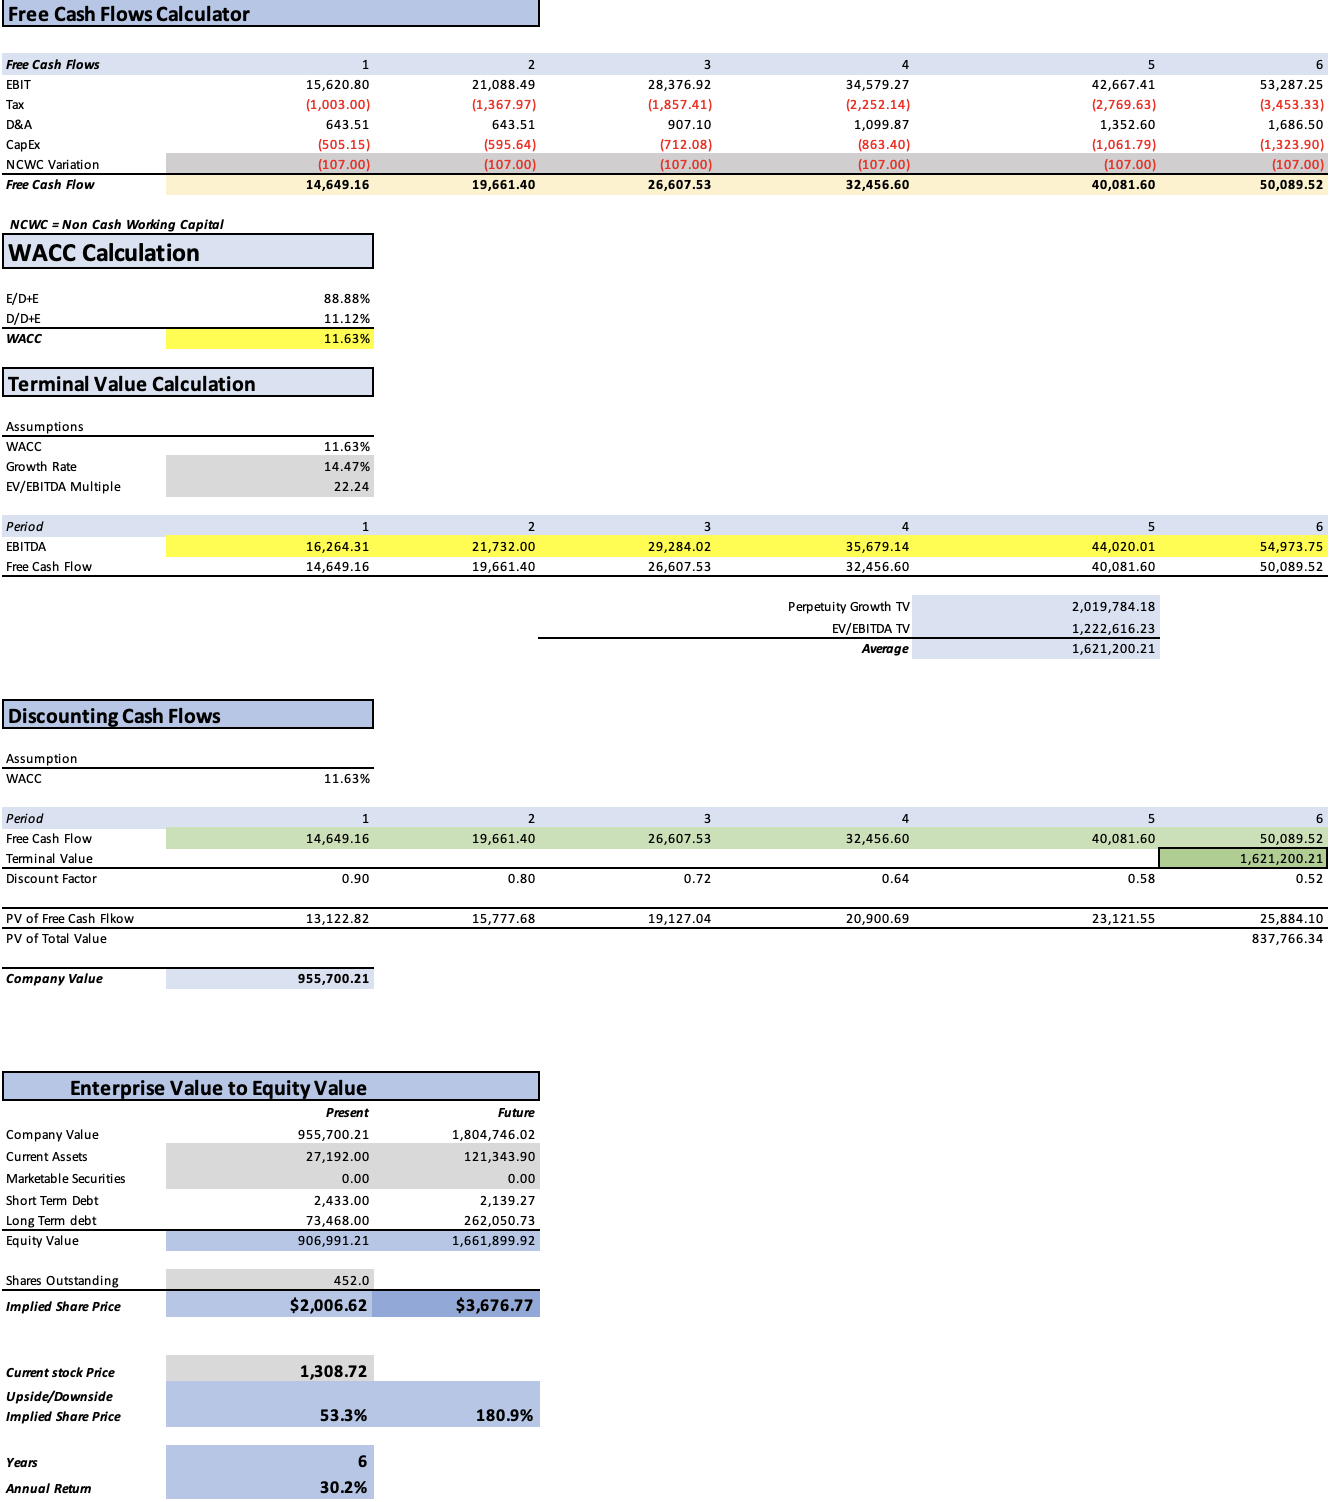
The resulting fair price suggested by this model is $2,006.62, a 53.3% upside from the current stock price of $1,308.72. The future price for 2029 is $3,676.77, which translates into annual returns of 30.2% throughout 2029.
How do My Estimates Compare with the Average Consensus?
If I were to make a model with the consensus EPS and revenues (but still implying that CapEx and D&A will rise over time) I would end with a fair price of $2,413.92, an 84.4% upside from the current stock price of $1,308.72. Furthermore, the future price would be around $4,422.33 which translates into annual returns of 39.7% throughout 2029.
Before going further, it’s important to clarify that my model is six-year projections, which means that the results may come higher than other models because logically there are more cash flows in 6 years than there are in a 3-5 years one.
Returning to my estimates, you can see that my estimates are way lower than what analysts are expecting. For instance, my 2024 EPS estimate stands at $27.80, which is 41.21% lower than the average consensus of $46.95. This trend persists throughout my projection due to a combination of lower revenue estimates and net income margins. Still, this does not mean that I am projecting a catastrophe for Broadcom, its net income will still grow for 2024, but by 7.24%.
Author’s Calculations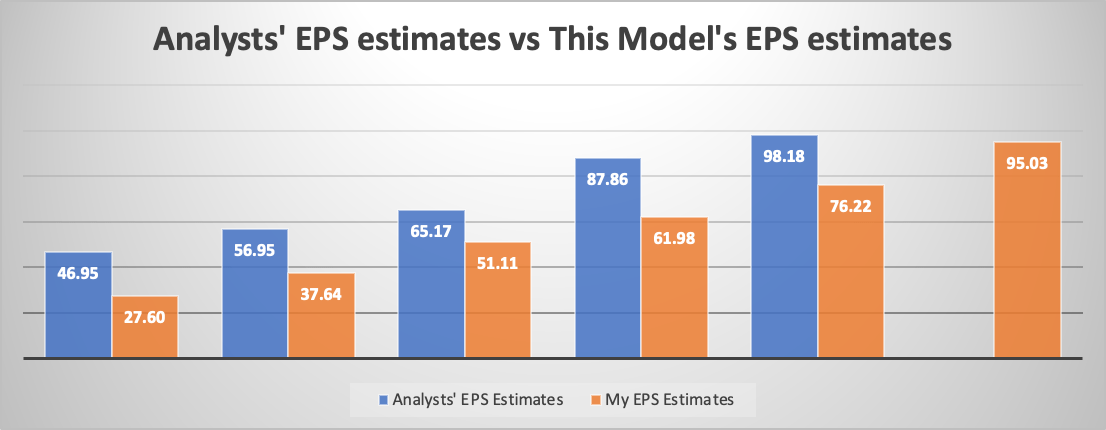
Risks to Thesis
The main risk in my thesis is that Broadcom’s playbook involves constant M&As and then cutting expenses aggressively to add value. However, this could cause Long-term debt to grow to unmanageable levels. Nevertheless, when the FED cuts interest rates, this will help the interest payments go down.
The other risk is that the major play here is AI, if it wasn’t for AI, and Broadcom performing in line with the market, this would mean that the fair price would stand at $1,224.15, a 6.5% downside from the current stock price of $1,308.72. Nevertheless, I think that if in the worst-case scenario, Broadcom is fairly valued, this should explain by itself that Broadcom is a very decent risk-reward play.
Finally, there is the risk of market sentiment because my model is estimating EPS that is significantly lower than the average consensus and yields a very favorable result, however, if Broadcom does register my EPS estimates, it’s probable that in the near-term the stock will go down.
Outlook
I expect Broadcom to register net sales of $41.68 billion for 2024 and $49.14 billion for 2025. This represents an increase of 7.21% from 2023 to 2024 and a subsequent increase of 17.8% from 2024 to 2025. My net income estimates are $12.47 billion for 2024 and $17 billion for 2025.
I expect that the net income margin for 2024 will stand at 29.93%, which will change if Broadcom announces further cost-cutting measures or the FED reduces interest rates therefore reducing the amount of interest payment Broadcom makes.
Conclusion
Broadcom is a company with enviable margins, and its past successful M&As followed by cost-cutting measures is a very important ability of the company. After valuing Broadcom through a DCF model I arrived at a fair price per share of $2,006.62 and a future price for 2029 of $3,676.77. The first one represents a 53.3% upside from the current stock price and the latter translates into annual returns of 30.2% throughout 30.2%.
Furthermore, I compared my results with the average consensus and I noticed that my estimates are way lower than available estimates. Additionally, I tested what would happen if I caped networking growth to 6.56% instead of 38%, and the result was that Broadcom was fairly valued. This demonstrates that Broadcom has a huge security margin. For this reason, I am upgrading Broadcom from buy to “strong buy”.

 Q2 2024 Earnings Call Transcript")

