
Torsten Asmus
Thesis
The Vanguard Long-Term Bond Index Fund ETF Shares (NYSEARCA:BLV) is a fixed income exchange traded fund. We have covered a couple of names in this space, the last one being the SPDR Portfolio Long Term Corporate Bond ETF (SPLB) covered here. BLV is composed of treasuries and corporate bonds and has the longest duration from the analyzed cohort, duration which stands at 14.1 years. Long duration equates to a higher volatility level, but to the potential for higher returns as well once long rates move significantly lower.
In this article, we are going to have a closer look at BLV, its composition, its analytics versus its peers, and get a better understanding of what would a good entry point into the name be.
The highest duration fund from the cohort
When compared to a peer group, BLV has the highest duration:
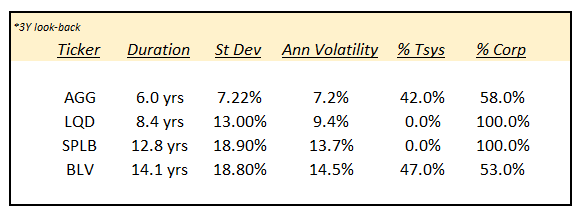
Analytics (Author)
In the above table, we summarized a number of large corporate bonds/treasuries ETFs, some with 100% corporate exposure, and some with a blended approach to their collateral pool. BLV aims to capture the long end of the curve via its duration profile, which is the highest from the cohort. Unsurprisingly, its volatility is also the highest, standing at 14.5%, double the one exhibited by the iShares Core U.S. Aggregate Bond ETF (AGG) as an example. BLV also displays the highest standard deviation from the list when measured on a 3-year look-back. A retail investor can find the ETF’s risk metrics on the respective Seeking Alpha tab here. From a collateral standpoint, AGG is the closest match, with a rough 50% treasuries and 50% corporate bonds portfolio.
Duration has dragged down the fund during monetary tightening
Given the significant move up in rates in the past three years, we can see how duration has significantly impacted BLV’s performance versus its peers:
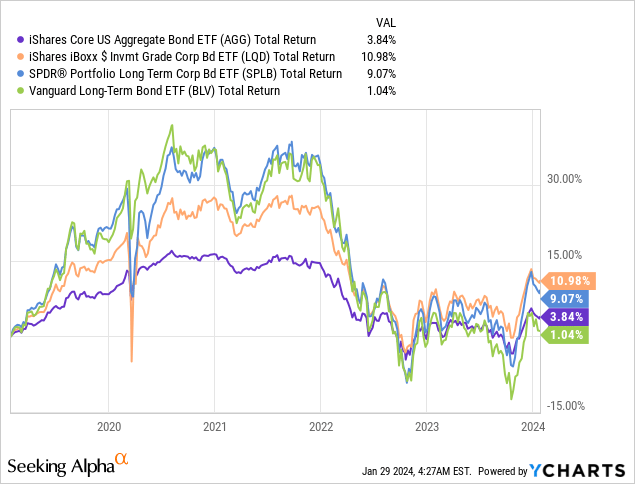
If we look at the total return performance of the cohort in the past five years, we notice BLV being the straggler, with only a 1% total return, versus more than 10% for LQD. However, do note that the green line representing BLV has been very volatile, with a massive drop from 2021 to 2023.
The opposite will occur when rates and credit spreads start falling significantly. Duration works both ways, and in the same way, it penalized the fund when rates moved higher, it will provide a back-wind when they decrease significantly.
A blended portfolio
The fund seeks to track the performance of the Bloomberg U.S. Long Government/Credit Float Adjusted Index, and it represents a diversified exposure to the long-term, investment-grade U.S. bond market:
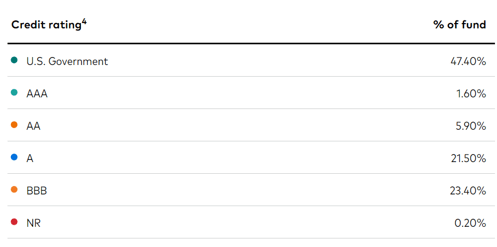
Ratings (Fund Fact Sheet)
The ETF has a 47.4% holding in U.S. Treasuries, while the rest is dispersed in corporate bonds, mainly ‘A’ and ‘BBB’ rated ones. The fund thus does take credit risk via its corporate sleeve, sleeve which is overweight lower-rated names. Industrials represent the largest sectoral concentration, coming in at 32.5% of the portfolio, followed by financial names at 7.7% of the holdings.
The fund is a true long dated ETF, with the maturity parsing of its collateral fully reflective of that:
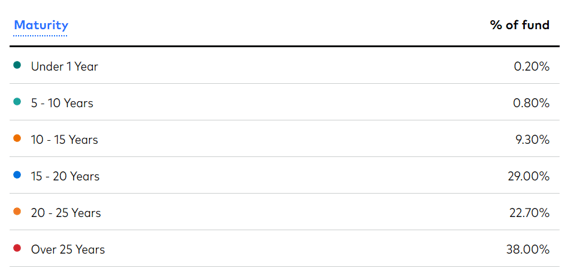
Maturity Ladder (Fact Sheet)
We can notice that virtually all of the collateral pool has maturity dates above 10 years, while the majority of the portfolio (i.e. 38%) has maturity dates above 25 years.
Risk Factors
Rates and credit spreads are the main risk factors here. Given the very long duration of the portfolio, credit spreads actually play an outsized role:
Spread duration is a measure used in fixed-income investing to estimate the sensitivity of a bond’s price to changes in its credit spread. This measure reflects the potential change in the bond’s value in response to a 100 basis point (1%) change in the credit spread, helping investors understand the associated risks.
So a 100 bps move lower in credit spreads has a +14% impact on this name. Unfortunately, the reverse is also true – a sudden risk-off mode in the market that would see credit spreads widen could potentially cause very high negative returns.
Let us have a look at what BBB corporate spreads have done as of late:
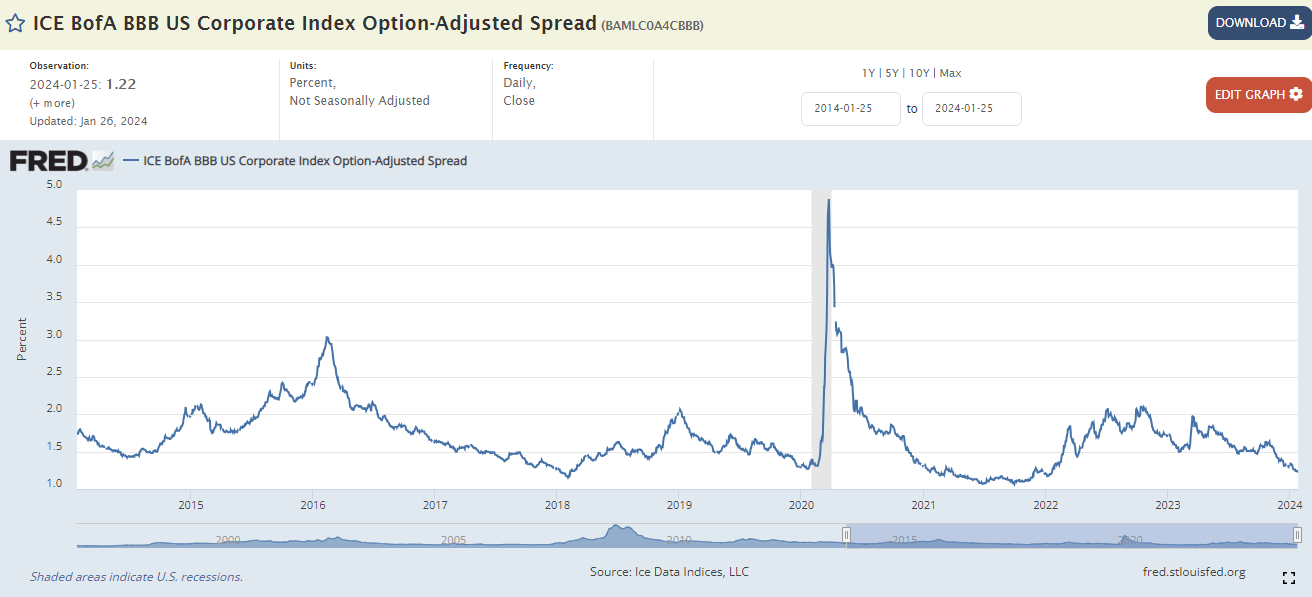
Corporate Spreads (The Fed)
After widening substantially during 2022, credit spreads have come in significantly, as measured by the ICE BofA BBB US Corporate Index Option-Adjusted Spread level. The respective index sits at 122 bps currently, near 10-year lows. During the 2022 risk-off moves, we can see this figure widen out to 200 bps. So that is roughly 78 bps higher, or a -10.9% move as a direct impact to BLV if spreads were to re-visit their wides.
We are yet to see a full return to a negative correlation environment between risk-off moves and bond yields. In the pre-2022 environment, significant market corrections (i.e., equities down, credit spreads wider) would be accompanied by a flight to safety into treasuries. Given the current inflationary environment, we have seen the opposite in the past two years, with both equities lower and bond prices lower at the same time. As we move towards monetary easing, we think we are going to see a return to the negative historic correlation, but not as strong as before.
What happens to long rates after the Fed cuts?
If we look at what history has taught us from past Fed cuts, we can extract two main narratives:
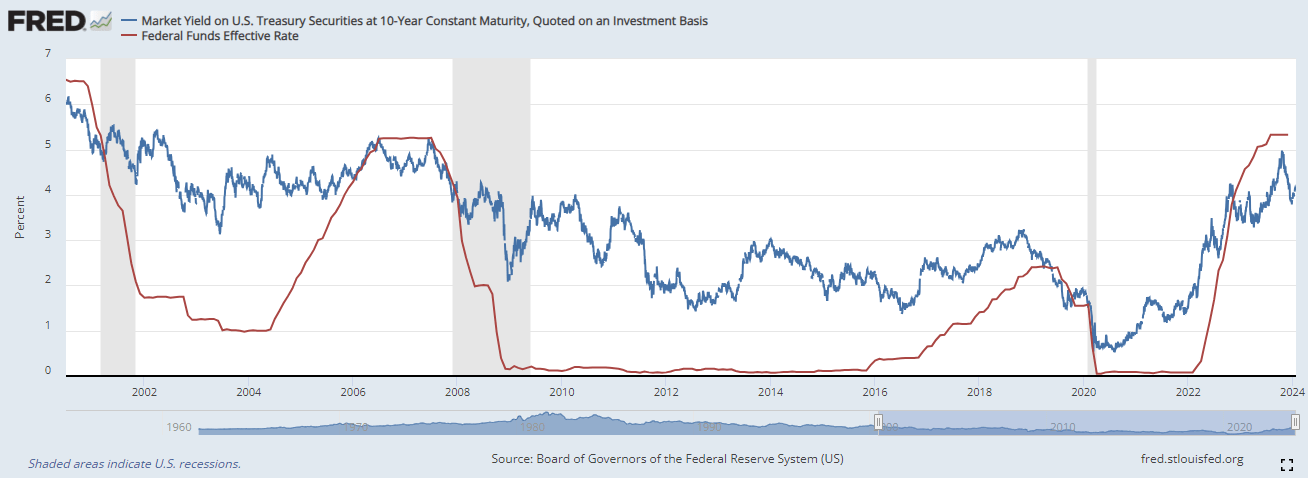
Fed Funds vs 10-year Yields (The Fed)
Long rate shifts lower abruptly close to the first Fed cut, but then they tend to establish themselves in a range irrespective of how low Fed Funds go.
If we have a look at the 2000-2002 period, we can see that initial violent move lower from 6% to 5%, and then, even as Fed Funds truly collapsed, we see 10-year yields establish themselves in a 4% to 5% range.
The story is similar for the 2007-2009 period, when 10-year yields saw a sudden move down to 4% from their 5% level, but then proceeded to establish a 3% to 4% range, even as Fed Funds went to zero.
Expect a similar path this time around. We have already seen that violent first leg down, with 10-year yields collapsing under 4% after reaching 5% in November 2023. We expect them to stay married to 4% until a very aggressive path of Fed Funds cuts is established, after which the new cycle range should be 3% to 4%.
Conclusion
BLV is a long-dated bond fund. The vehicle has a rough 50/50 split between treasuries and corporate bonds and a 14.1-year duration. The fund has a 14.5% annualized volatility and has underperformed its cohort of peers in the past three years due to the rise in interest rates and its high duration. The reverse will happen once rates and credit spreads move significantly lower. While we have already seen a 100 bps retracement in 10-year yields, the ICE BofA BBB US Corporate Index is at the bottom of its ten-year range. This is not a good entry point for BLV, and retail investors should wait for an entry point when BBB spreads are above 160bps in order to enter a true buy-and-hold position. Such a move in credit spreads translates into a price point below $70/share for the fund. We are on Hold until then.

 Q2 2024 Earnings Call Transcript")

