Win McNamee/Getty Images News
BJ’s Wholesale Club Holdings (NYSE:BJ) operates warehouse clubs in the United States. The company’s business model relies on customers’ club memberships, where customers get access to discounted items through the membership. As of Q3/FY2023, the company operates 238 stores, as told in the November investor presentation.
The business model is extremely similar to Costco’s (COST). Against Costco, BJ’s scale of operations is still quite small, and the brand is not as widely spread across the nation. BJ’s has focused on the east coast of the country, building an efficient store network. Against Costco and Sam’s Club, BJ’s prides itself in a broader assortment, smaller pack sizes & club format, convenient locations, and a full-service deli in stores.
BJ November Investor Presentation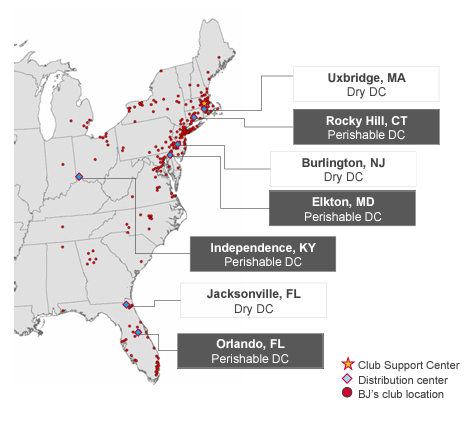
Since BJ’s IPO in 2018, the stock has performed very well. From the initial trading price, the stock has appreciated at a CAGR of around 19.4%. BJ’s currently doesn’t pay a dividend, but rather allocates capital through share buybacks.
Stock Chart From IPO (Seeking Alpha)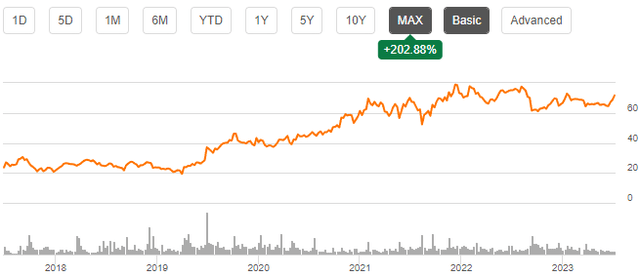
Financials: Slower Growth than Costco, but a Better Margin Trajectory
From FY2015 to current trailing revenues as of Q3/FY2023, BJ’s has had a revenue CAGR of 6.0%. The company’s underlying growth is quite minimal, as food inflation explains a good part of the growth in recent years – BJ’s store count has increased by a CAGR of 1.4% in the same period of time.
Compared to Costco, the growth is notably slower – in a similar period of time, Costco has achieved a CAGR of 10.0% despite having smaller room for growth with currently 12.6 times higher trailing revenues. While Costco’s stores are nationwide, BJ’s growth has currently been limited by the geographic concentration on the East Coast – to achieve significant growth in the future, I believe that a gradual geographic expansion is needed from BJ’s.
Author’s Calculation Using TIKR Data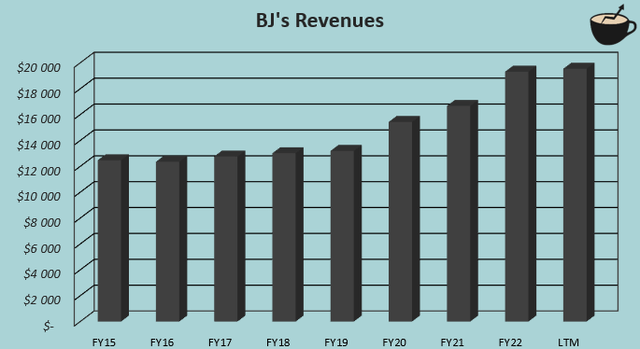
Grocery stores, and similar businesses, very often have thin margins, and BJ’s is no exception. Currently, the company’s trailing operating margin stands at 4.0%, slightly above Costco’s 3.6%. On top of a slightly better profitability than Costco, the overall profitability trend of BJ’s is more promising, as the company’s margin has quite consistently increased from only 1.5% in FY2015.
I believe that the upward trend could be a result of BJ’s improving store economics. The company has been able to drive higher membership renewal rates from 84% in FY2016 to a current 90% as a continuation of a longer-term trend. In addition, an increasing number of stores likely allows for an improved efficiency in product distribution. I believe that the margin trend could still have some room for improvement with continued store economics improvements & slight operating leverage with growth. BJ’s also has a greater trailing gross margin at 18.3% than Costco’s 12.5%, leaving room for better margins.
Author’s Calculation Using TIKR Data
BJ’s long-term targets include revenue growth in the mid single-digit percentages mainly driven by growth in comparable club sales, as well as an EPS growth target of high single-digit percentages to low double-digit percentages – the long-term financial targets reflect quite modest growth ambition, but an improving profitability or continued share buybacks, as the EPS is guided for better growth than revenues.
Valuation
A Cheap Relative Valuation
Compared to Costco and Walmart (WMT), which also operates the Sam’s Club chain similar to BJ’s, BJ’s stock seems quite cheap. Currently, BJ’s trades at a trailing GAAP P/E of 19.2, compared to Costco’s 50.3 and Walmart’s 30.6. The forward cash flow multiples also show a discount compared to Costco – BJ’s forward P/FCF of 14.0 is significantly below Costco’s P/FCF of 32.2. On the other hand, Walmart does seem to have a better estimated forward cash flow yield with a P/FCF of 12.9.
Differing growth rates could explain the gap between BJ’s valuation in comparison to Costco, as Costco has demonstrated better revenue growth. Still, the gap seems too wide in my opinion, and BJ’s seems like the clearly better pick in terms of valuation.
Moderate DCF Model Upside
To estimate a rough fair value for the stock, I modeled a DCF. In the discounted cash flow model, I estimate a revenue CAGR of 3.3% from FY2022 to FY2032, with an estimate of 5% for FY2024 that gradually slows down into a perpetual growth of 2%. While BJ’s targets a mid single-digit growth, the historical growth in my opinion currently justifies the DCF model’s estimates as a conservative base scenario. For the EBIT margin, I estimate slight leverage from the current trailing level of 4.0% as the company’s scale grows and store economics could continue to improve – as a continuation of the long-term margin expansion, I estimate BJ’s EBIT margin to reach 4.3%. The company’s store growth has required a good amount of capital, and I estimate quite a modest cash flow conversion for FY2024 with gradual improvements as growth slows down.
With the mentioned estimates along with a cost of capital of 6.73%, the DCF model estimates BJ’s fair value at $93.48, around 31% above the stock price at the time of writing – the company’s low risk profile that allows for a low WACC makes it have some upside in my opinion. Although the long-term return isn’t likely to be very great, I estimate the return to be good compared to BJ’s risks.
DCF Model (Author’s Calculation)
The used weighed average cost of capital is drawn from a capital asset pricing model:
CAPM (Author’s Calculation)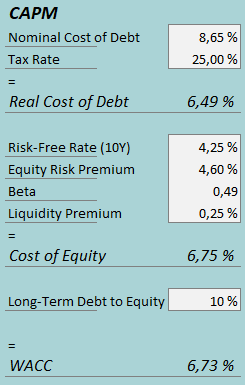
In Q3/FY2023, BJ’s had $18 million in interest expenses. With the company’s current amount of interest-bearing debt, BJ’s annualized interest rate comes up to 8.65%. The company leverages debt quite modestly, and I estimate a long-term debt-to-equity ratio of 10%.
For the risk-free rate on the cost of equity side, I use the United States’ 10-year bond yield of 4.25%. The equity risk premium of 4.60% is Professor Aswath Damodaran’s latest estimate for the United States, made on the 5th of January. Yahoo Finance estimates BJ’s beta at a figure of 0.23. I believe that the figure is reasonable to be low, but 0.23 to me seems too low, as even most larger competitors have higher betas. Instead, I use the average of three betas – BJ’s 0.23, Walmart’s 0.49 as the company owns BJ’s competitor Sam’s Club, and Costco’s 0.76, crafting a beta of 0.49. According to Zacks’ data, BJ’s beta has also historically hovered around the estimated level. Finally, I add a small liquidity premium of 0.25%, crafting a cost of equity of 6.75% and a WACC of 6.73%.
Takeaway
BJ’s operates a membership discount retailer similar to Costco, focusing on the east cost of the United States. The company has achieved modest growth, below Costco’s long-term rate, despite a smaller scale. Still, BJ’s financials compared to Costco aren’t weak – BJ’s margins are above Costco’s, and the company has been able to drive historical margin increases with some further room for margin expansion in my opinion. In terms of BJ’s valuation, the company trades at a significantly lower price than Costco, signifying an irrational gap in my opinion. As my DCF model also estimates upside for BJ’s, I have a buy rating for the time being.


