Wong Yu Liang/Moment via Getty Images
But that’s how inflation is, once out of the bottle: It serves up nasty surprises.
We’ll start with the “core services” CPI (services minus energy services) because this is so crucial, and because Powell keeps talking about it. We have been concerned here for months about the refusal of core services inflation to ease off, and we’ve found the acceleration in the fall last year “very disconcerting.” But that’s how inflation is – it tends to serve up nasty surprises. And now it did.
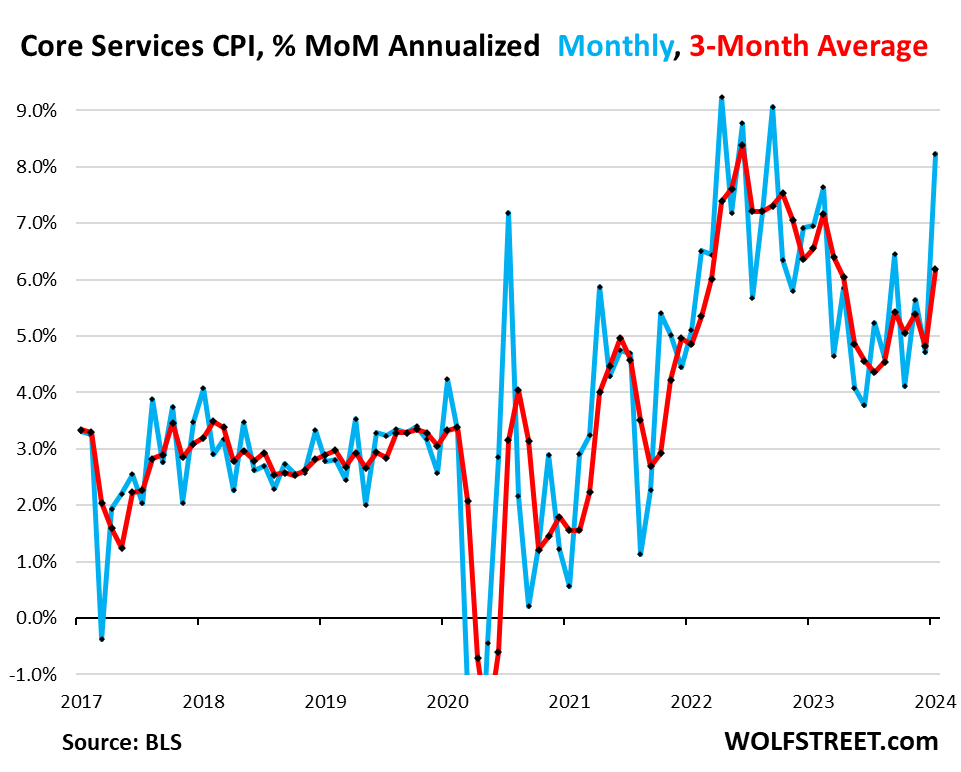
“Core services” CPI jumped by 0.66% in January from December, or by 8.2% annualized (blue). In this inflation cycle, only three months were worse (April, June, and September 2022). It includes housing, insurance, health care, subscriptions, etc., but not energy services. Core services is where consumers do the majority of their spending – and it’s re-heating from already hot levels.
The three-month moving average, which irons out the month-to-month squiggles, jumped by 0.50%, or by 6.2% annualized (red), the worst since March 2023. All this according to the CPI data released today by the Bureau of Labor Statistics.
Inflation in January boiled down to this:
- Energy prices continued their plunge (-10.4% annualized in Jan. from Dec.).
- Prices of durable goods continued their decline (-5.4% annualized in Jan. from Dec.), on a plunge in used-vehicle prices.
- But food prices rose (+4.5% annualized in Jan. from Dec.).
- And “core services” were red hot (+8.2% annualized).
“Core CPI,” a measure of underlying inflation that excludes food and energy products, accelerated to an increase of 0.39% in January from December, or 4.8% annualized (blue line), the highest since April last year. It was held down some by the decline in durable goods CPI, but pushed up more forcefully by core services CPI.
The three-month moving average of core CPI accelerated to 4.0% annualized in January from December, the worst reading since June (red line).
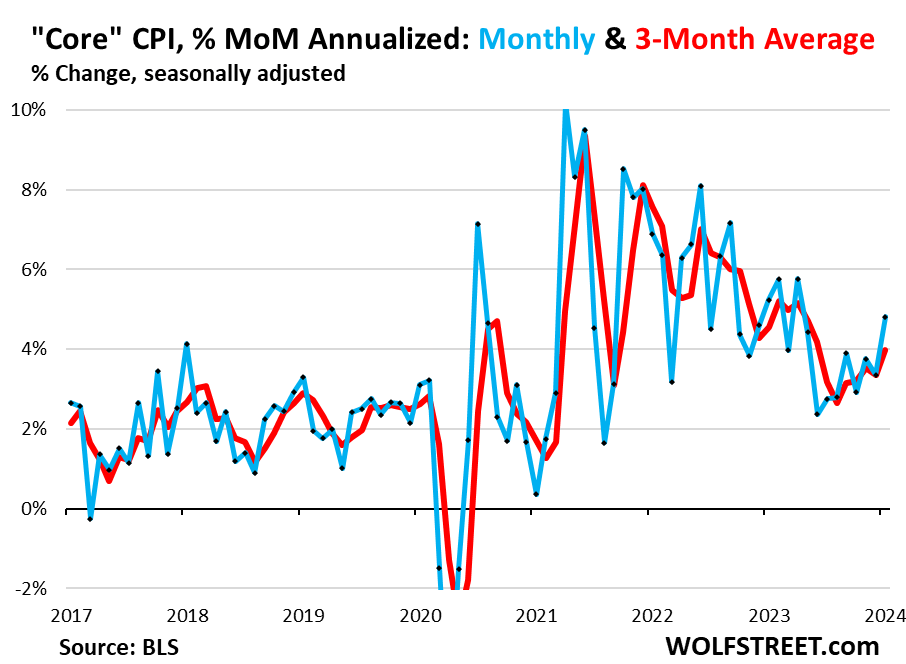
Overall CPI accelerated to an increase of 0.31% month-to-month, or 3.8% annualized, the worst reading since September.
The BLS adjusted its seasonal adjustment factors last week going back five years, as it does every year at this time. These adjustments were relatively minor, with the effect of seasonally adjusted figures getting moved up a little in some months and getting moved down a little in other months. Everything here is based on the adjusted data.
Year-over-year:
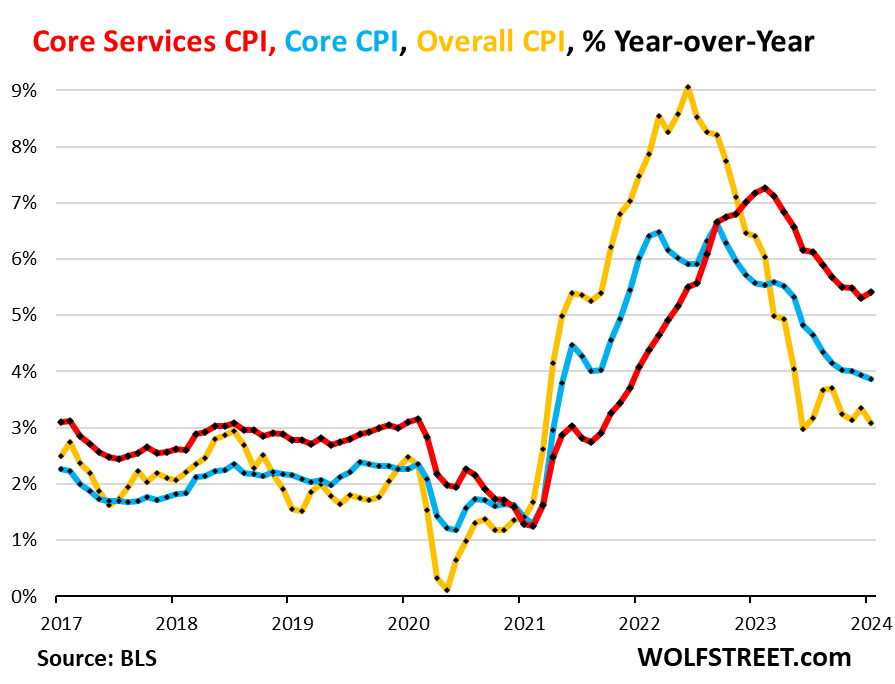
- “Core services CPI” re-accelerated to 5.4% (red).
- “Core CPI” rose by 3.9%, roughly the same as in the prior month (blue).
- Overall CPI decelerated to 3.1% (yellow), pushed down by the 4.3% plunge in energy prices and the 1.6% drop in durable goods prices:
Core CPI (blue) has hovered near the 4% line for the fourth month in a row. Core services CPI (red) has been in the same range around 5.4% for the fourth month in a row, as this inflation proves to be resilient:
Core services CPI components
Above, we discussed core services CPI’s nasty surprise spike. Here is what goes into core services CPI.
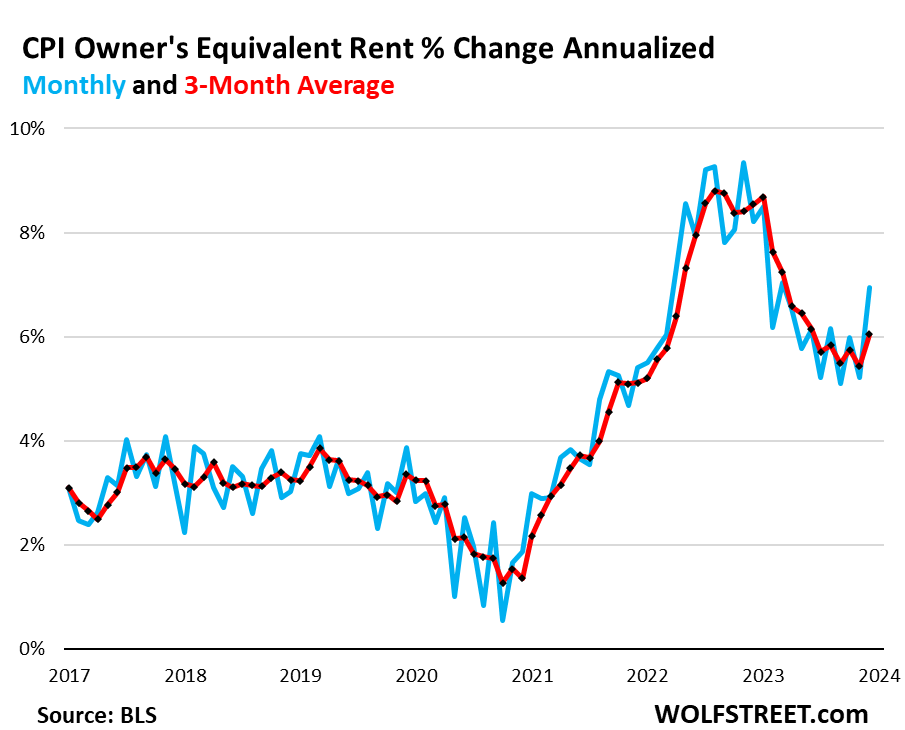
The Owners’ Equivalent of Rent CPI jumped by 0.56% in January from December, or 6.9% annualized, the worst since April.
The three-month moving average jumped by 6.0% annualized, the worst since July.
The OER index accounts for 26.8% of overall CPI. It is designed to estimate inflation of “shelter” as a service for homeowners and is based on what a large group of homeowners estimate their home would rent for.
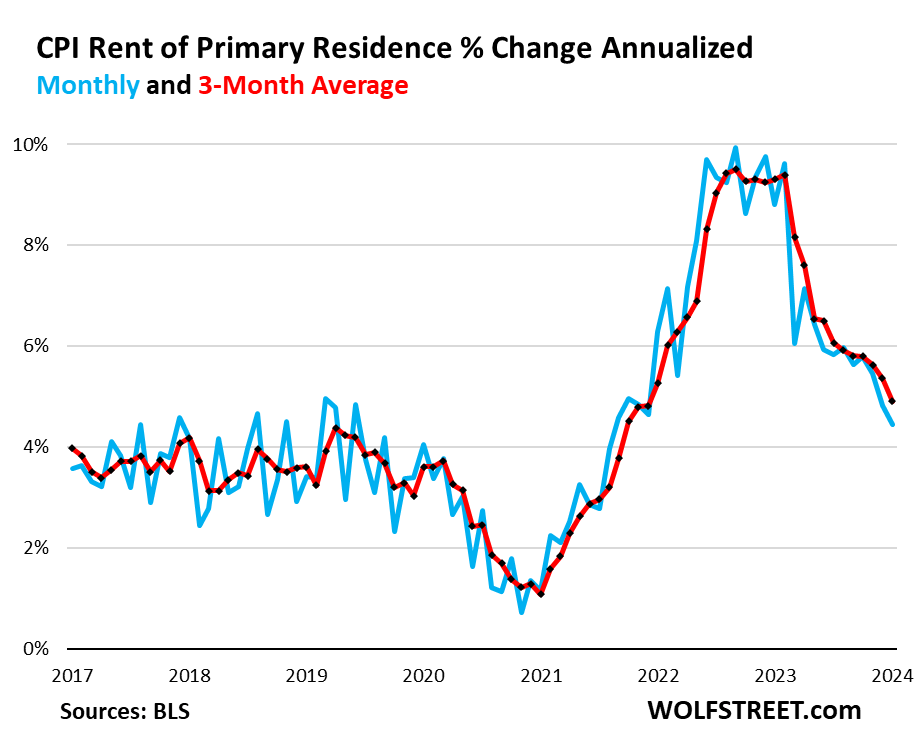
The Rent of Primary Residence CPI rose by +0.36% in January from December, or by 4.4% annualized, a deceleration from prior months. The three-month moving average rose by 0.40%, or by 4.9% annualized.
The Rent CPI accounts for 7.7% of overall CPI. It is based on rents that tenants actually paid. The survey follows the same large group of rental houses and apartments over time and tracks the rents that the current tenants actually paid in these units.
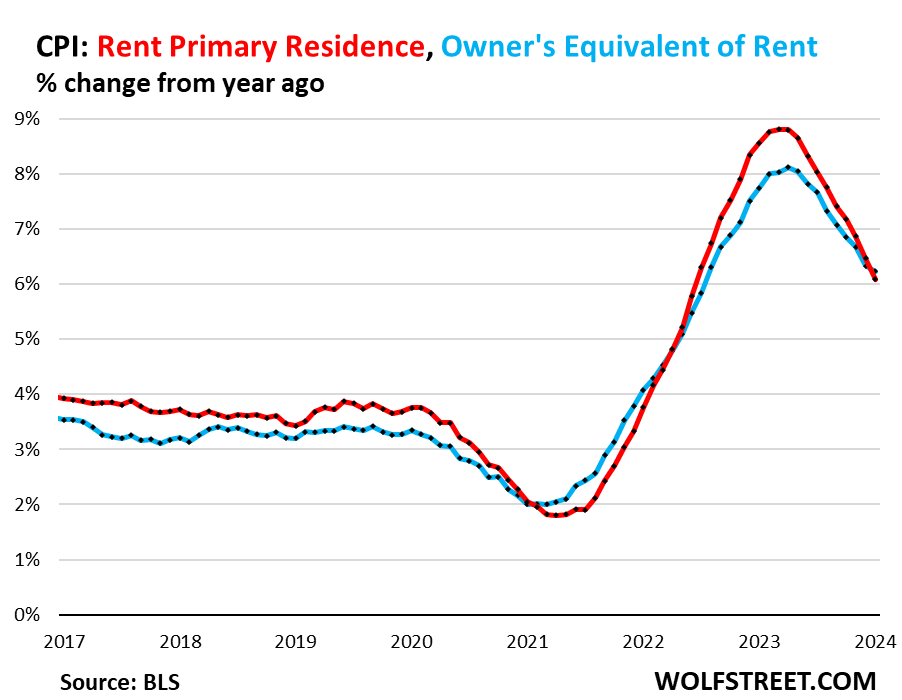
Year-over-year, the OER CPI rose by 6.2% (blue in the chart below) and Rent of Primary Residence rose by 6.1% (red).
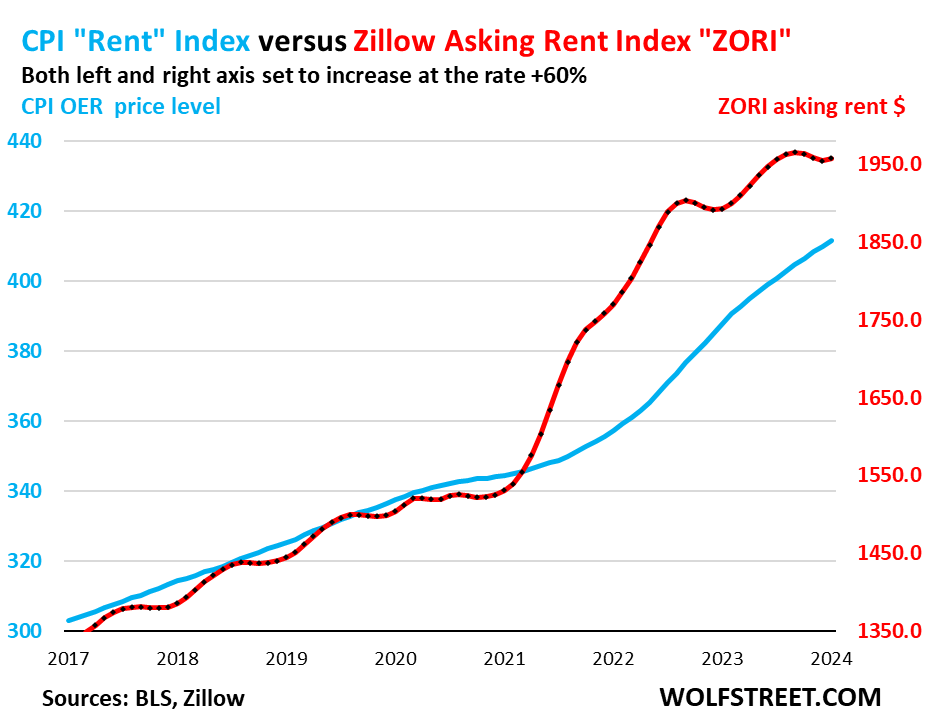
“Asking rents…” The Zillow Observed Rent Index (ZORI) and similar private-sector rent indices track “asking rents,” which are advertised rents of vacant units on the market. Because rentals don’t turn over that much, the ZORI’s spike in 2021 through mid-2022 never fully translated into the CPI indices because not many people actually ended up paying those asking rents.
The ZORI rose to $1,957 in January, after the seasonal dip late last year.
The chart shows the CPI Rent of Primary Residence (blue, left scale) as index values, not percentage change; and the ZORI in dollars (red, right scale). The left and right axes are set so that they both increase each by 50% from January 2017, with the ZORI up by 47% and the CPI Rent up by 36% since 2017:
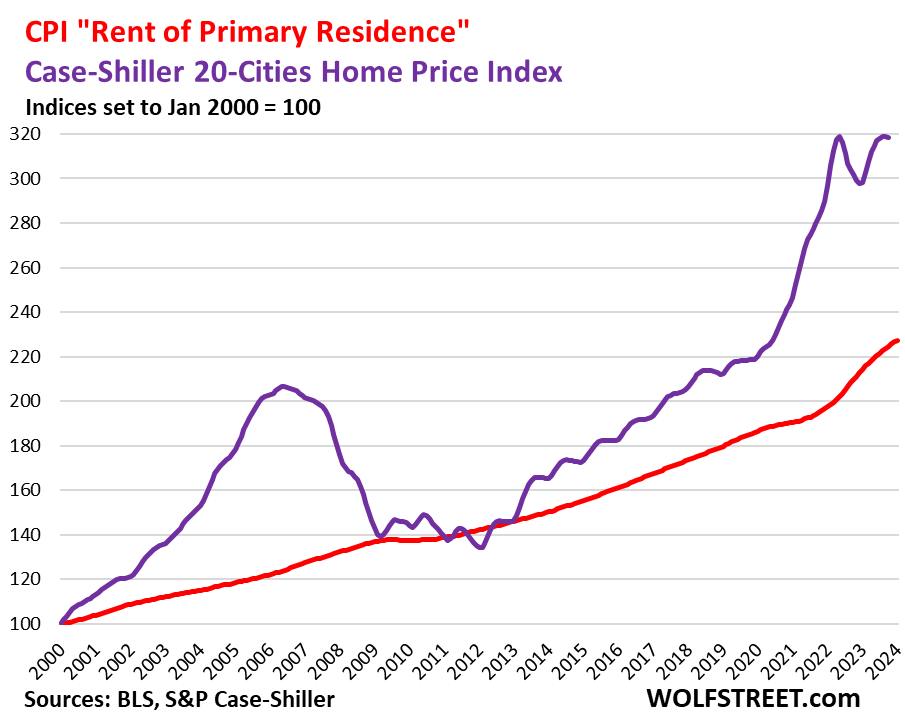
Rent inflation vs. home-price inflation: The red line represents the CPI for Rent of Primary Residence (tracking actual rents). The purple line represents the Case-Shiller Home Price 20-Cities Composite Index, which lags a few months and has now put in a double top, with the last reading showing the first decline. Both lines are index values set to 100 for January 2000.
Medical care services, including health insurance. Since October 2022, we’ve lambasted the method the BLS uses to estimate health insurance inflation, and the grotesque results this produced. January was the fourth month after the BLS tweaked the system.
Starting in October, the crazy pendulum has been swinging back. Health insurance CPI rose by 1.1% month-to-month each in October, November, and December. In January, this accelerated to an increase of 1.4%.
But these increases are still far below the grotesque 3.9% per month plunges (-38% annualized) during the prior 12 months that had caused the year-over-year health insurance CPI to collapse by 37% through September 2023.
Now, with these month-to-month increases for four months in a row, the year-over-year collapse is being gradually undone, so far from -37% in September to -23.3% in January.
Medical care services, which includes health insurance, jumped month-to-month by 0.7% (8.7% annualized), but the year-over-year collapse of its health insurance component (-23.3%) still caused the medical care services CPI to rise only slightly year-over-year (+0.6%). It will become more positive each month for a while.
The table is sorted by weight of each service category in the overall CPI. The CPI for medical care services is the third largest item, with a weight of 6.5% in overall CPI, and over 10% in the core services CPI, and it will continue to gain momentum year-over-year as the health insurance CPI within it continues to revert.
Also note the continued spike in motor vehicle insurance. The 1.4% month-to-month spike translates into an annualized spike of 18%, compared to the year-over-year spike of 20.6%, so this isn’t slowing down much.
Six of the 17 services items, accounting for 40% of overall CPI, have year-over-year inflation rates of over 6%!
| Major Services without Energy | Weight in CPI | MoM | YoY |
| Services without Energy | 64.3% | 0.7% | 5.4% |
| Owners’ equivalent of rent | 26.8% | 0.6% | 6.2% |
| Rent of primary residence | 7.7% | 0.4% | 6.1% |
| Medical care services & insurance | 6.5% | 0.7% | 0.6% |
| Food services (food away from home) | 5.4% | 0.5% | 5.1% |
| Education and communication services | 5.0% | 0.4% | 1.3% |
| Motor vehicle insurance | 2.8% | 1.4% | 20.6% |
| Admission, movies, concerts, sports events, club memberships | 1.9% | 0.4% | 4.8% |
| Other personal services (dry-cleaning, haircuts, legal services…) | 1.5% | 1.0% | 6.8% |
| Motor vehicle maintenance & repair | 1.2% | 0.8% | 6.5% |
| Water, sewer, trash collection services | 1.1% | 1.1% | 5.5% |
| Video and audio services, cable, streaming | 0.9% | 0.3% | 5.3% |
| Hotels, motels, etc. | 1.3% | 1.8% | 1.0% |
| Pet services, including veterinary | 0.4% | 0.9% | 7.0% |
| Airline fares, other public transportation | 1.1% | 1.3% | -4.8% |
| Tenants’ & Household insurance | 0.4% | 0.7% | 4.1% |
| Car and truck rental | 0.1% | -0.7% | -14.1% |
| Postage & delivery services | 0.1% | 1.2% | 1.2% |
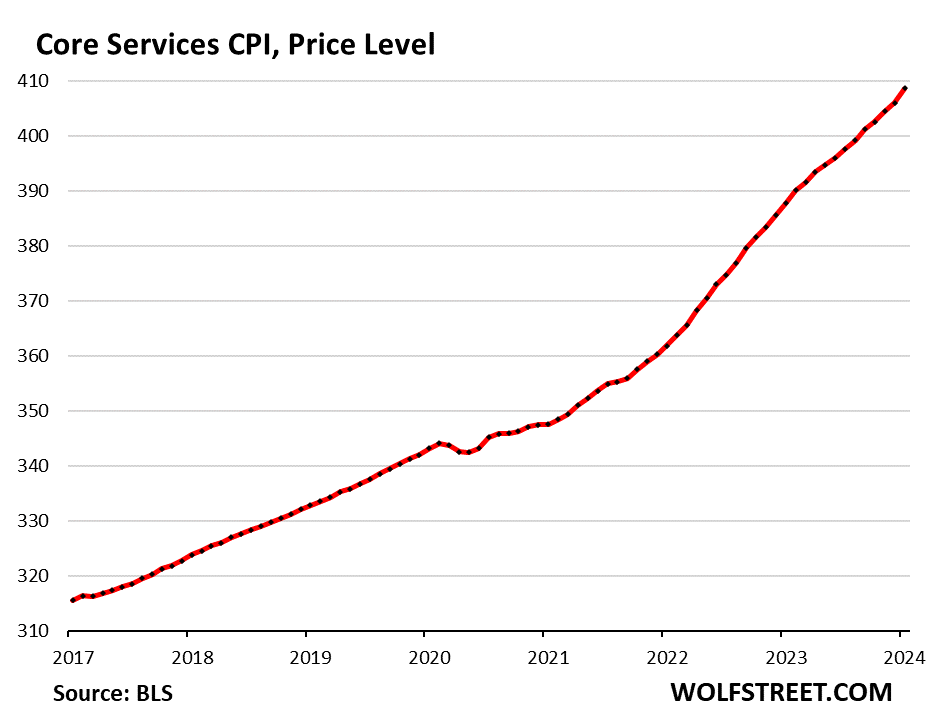
Core services price level. Since March 2020, the core services CPI has increased by 18.9%. This chart shows the core services CPI as a price index, using the index value, not as percentage-change of that index value.
You can see how the curve has become steeper in recent months. This is not a confidence-inspiring chart, now that the Fed is searching for “confidence” that the disinflation (cooling inflation) last year will actually continue.
Durable goods
New and used vehicles dominate the durable goods CPI. It also includes information technology products (computers, smartphones, home network equipment, etc.), appliances, furniture, etc.
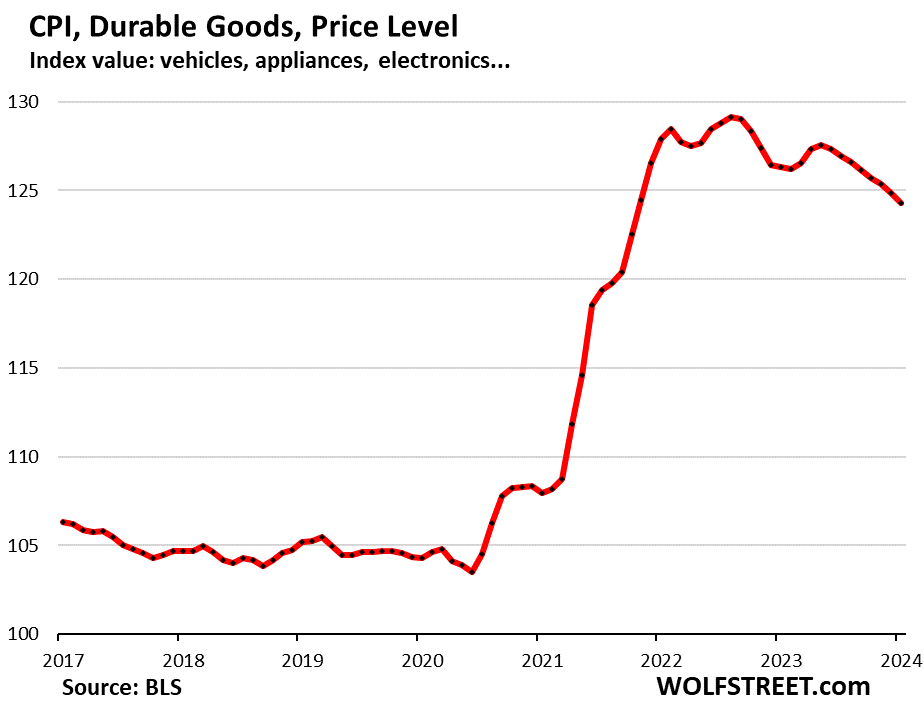
The index dropped 0.46% for the month (-5.4% annualized) and by 1.6% year-over-year. It has meandered lower ever since the peak in July 2022, as the shortages, supply bottlenecks, and transportation chaos have receded.
This chart shows the price level of the index (index value). From March 2020 to the peak in August 2022, durable goods prices spiked by 23.4%. Since then, they have dropped 3.8%. In other words, prices have given up about 20% of the pandemic spike.
| Major durable goods categories | MoM | YoY |
| Durable goods overall | -0.5% | -1.6% |
| New vehicles | 0.0% | 0.7% |
| Used vehicles | -3.4% | -3.5% |
| Information technology (computers, smartphones, etc.) | 0.8% | -6.9% |
| Sporting goods (bicycles, equipment, etc.) | -1.1% | 2.0% |
| Household furnishings (furniture, appliances, floor coverings, tools) | -0.1% | -1.3% |
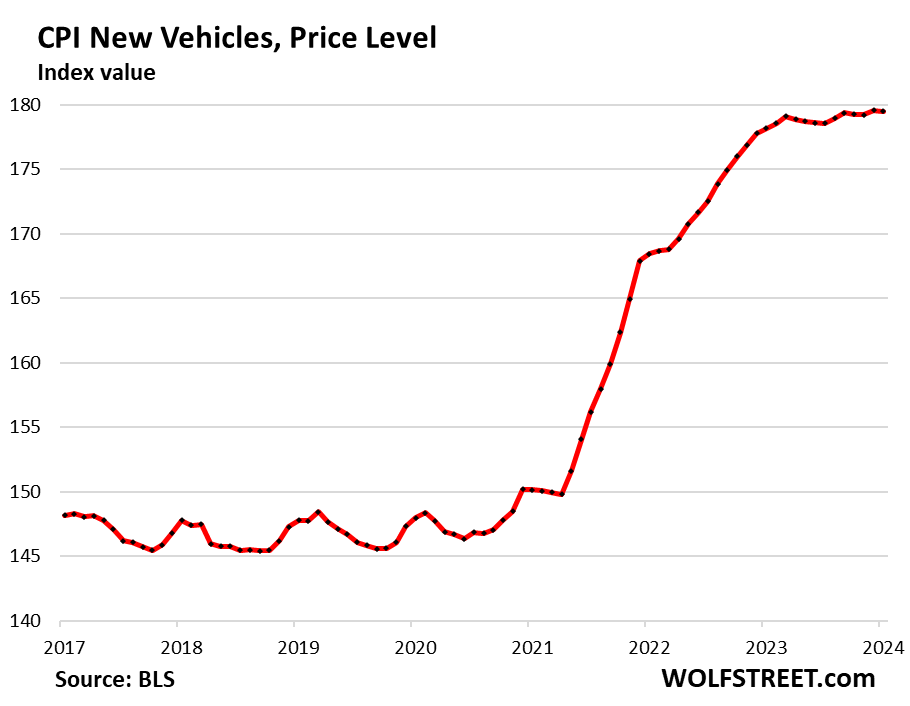
New vehicles CPI remained essentially unchanged. So the crazy price increases, addendum stickers, etc. are gone. But prices have not retraced any of the 20% spike during the shortages.
For the years before the pandemic, the new vehicle CPI was also meandering along a flat line, though vehicles were getting more expensive. This is the effect of “hedonic quality adjustments” applied to the CPIs for new and used vehicles and other products (chart and detailed explanation of CPI hedonic quality adjustments).
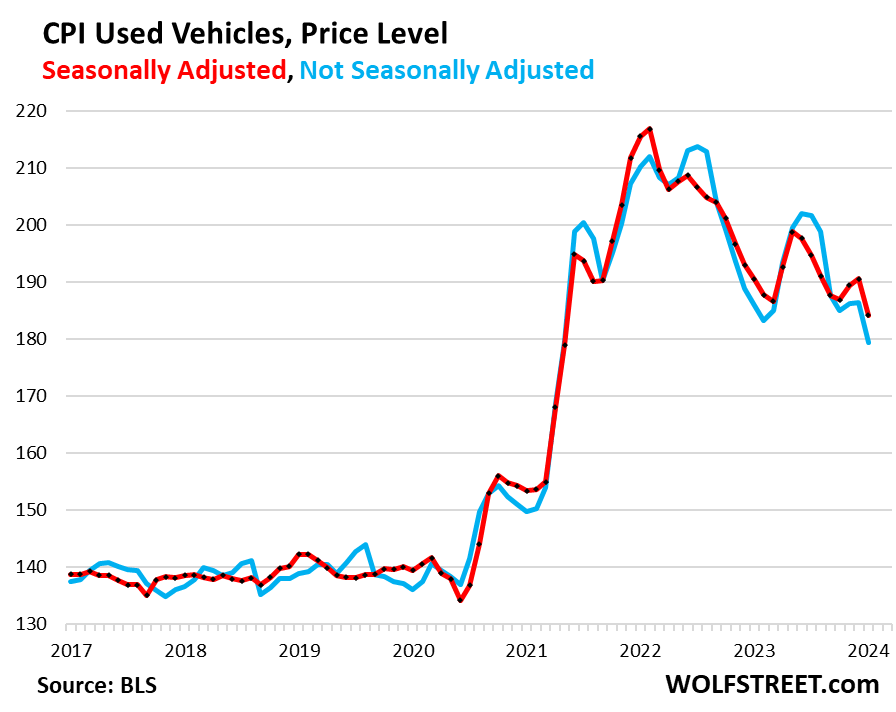
Used vehicle CPI plunged by 3.4% for the month (34% annualized!), seasonally adjusted, now catching up with the historic declines in used-vehicle wholesale prices.
The used vehicle CPI had spiked by 55% from February 2020 through January 2022. Since that peak, it has dropped by 14.5% (seasonally adjusted). In other words, it has given up 41% of its crazy spike during the pandemic.
Food & Energy
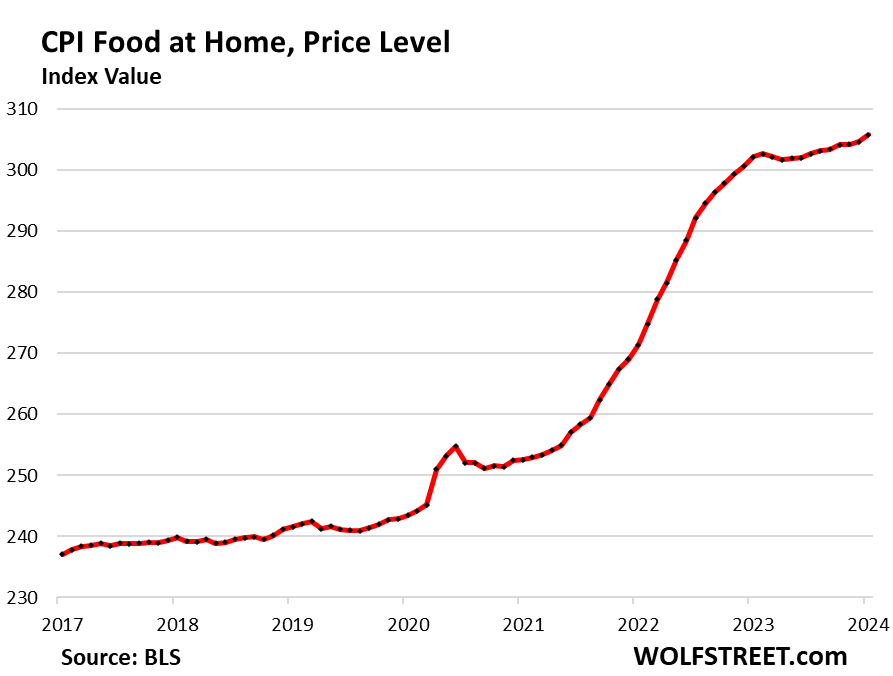
Food inflation accelerated. The CPI for food at home – food purchased at grocery stores and markets and eaten off premises – accelerated to a rise of 0.37% for the month (4.5% annualized), the worst increase since January 2023. Year-over-year, the index rose by 1.2%.
These increases come on top of already painfully high food prices that had spiked by 25% since the beginning of the pandemic. So this isn’t going in the right direction either:
| Food at home by category | MoM | YoY |
| Overall Food at home | 0.4% | 1.2% |
| Cereals and bakery products | -0.2% | 1.5% |
| Beef and veal | -0.3% | 7.7% |
| Pork | -0.3% | -0.4% |
| Poultry | 0.3% | 1.7% |
| Fish and seafood | -1.3% | -2.6% |
| Eggs | 3.4% | -28.6% |
| Dairy and related products | 0.2% | -1.1% |
| Fresh fruits | -1.2% | 1.9% |
| Fresh vegetables | 2.4% | -0.9% |
| Juices and nonalcoholic drinks | 1.4% | 4.8% |
| Coffee | 0.6% | -1.4% |
| Fats and oils | -0.3% | 1.9% |
| Baby food & formula | 0.7% | 8.7% |
| Alcoholic beverages at home | 0.3% | 2.3% |
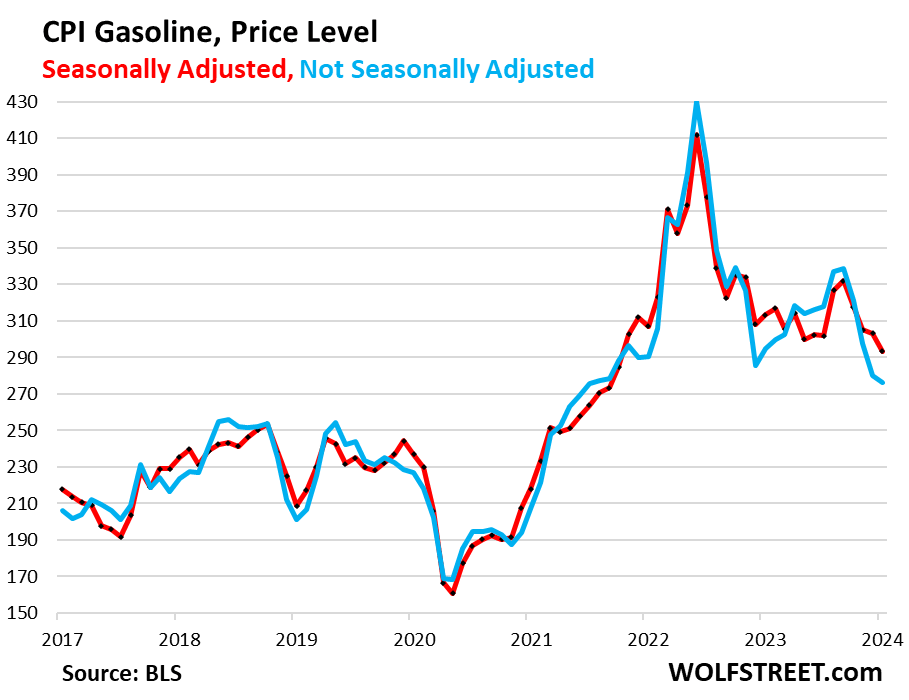
The CPI for energy products and services fell by 0.9% for the month seasonally adjusted (-10.4% annualized), as gasoline prices plunged by 3.3% seasonally adjusted for the month (-33% annualized).
Not seasonally adjusted (blue line), the gasoline CPI dropped by 1.5% for the month (-16.6% annualized).
Since the peak in June 2022, gasoline, which accounts for about half of the energy CPI, has plunged by 28.8%:
| Overall Energy CPI | -0.9% | -4.6% |
| Gasoline | -3.3% | -6.4% |
| Utility natural gas to home | 2.0% | -17.8% |
| Electricity service | 1.2% | 3.8% |
| Heating oil, propane, kerosene, firewood | -2.3% | -10.5% |
Editor’s Note: The summary bullets for this article were chosen by Seeking Alpha editors.


