Dragon Claws
Written by Nick Ackerman, co-produced by Stanford Chemist.
The last time we touched on BlackRock Enhanced Equity Dividend Fund (NYSE:BDJ) was in September. At that time, the fund was attractively priced at a deep discount. However, with the superpower of hindsight, we know now that equities were in to get clobbered even more as risk-free rates surged through the rest of September and into October. At one point, we were hitting levels not seen since prior to the great financial crisis.
That being said, we’ve made somewhat of a round trip after BDJ, and the overall equity market bounced off the lows with a strong November rally. In fact, in this short period of time since our prior update, BDJ has delivered some total returns to investors.
BDJ Performance Since Prior Update (Seeking Alpha)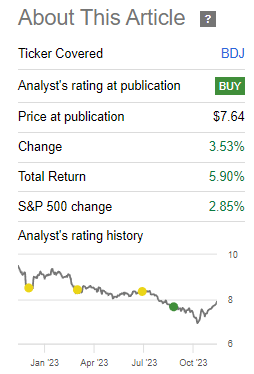
The discount narrowed a touch, but it remains an attractive name to consider today for the long-term investor.
The Basics
- 1-Year Z-score: -0.95
- Discount: -10.25%
- Distribution Yield: 8.66%
- Expense Ratio: 0.85%
- Leverage: N/A
- Managed Assets: $1.614 billion
- Structure: Perpetual
BDJ’s primary objective is to “furnish current income and current gains.” The fund intends to achieve this by “investing in common stocks that pay dividends and have the potential for capital appreciation.” They concentrate on dividend-paying stocks with “80% of its total assets in dividend-paying equities.”
The fund will also use a covered call strategy on single stocks. As of their last update, the fund was overwritten by 50.27%. That’s fairly aggressive, considering the 30 to 40% overwrite target they generally have. This was also similar to the level they were at in our prior update when it came in at 50.05%. So, it would continue to seem that the portfolio managers are leaning a bit bearish.
Performance – Discount Remains Attractive
The fund takes a value-oriented approach while utilizing a covered call strategy. So, while growth has been zooming higher, that has left BDJ behind, but on the other hand, it is what saw this fund perform essentially flat in 2022. On a total NAV return basis for 2022, the fund was off -3.71% and total share price returns were at 0.74%.
Over the long term, historical results for BDJ have been respectable, given their focus. That specific focus is utilizing benchmarks against the Russell 1000 Value Index but also the MSCI USA Value Call Overwrite Index.
BDJ Annualized Performance (BlackRock)
What can make BDJ more appealing at this time is the fund’s discount. The fund has generally traded at a discount for most of its life, but that changed in more recent years when the fund actually began to trade at a premium. That made the slide back down to a discount appear even worse, though the fund’s discount did get extremely wide as it pushed near a 15% discount in the October sell-off.
At this time, the fund is trading a bit below the fund’s longer-term history. That could potentially highlight that while it isn’t a screaming buying opportunity as it was just recently, it is still a decent place to put capital to work.
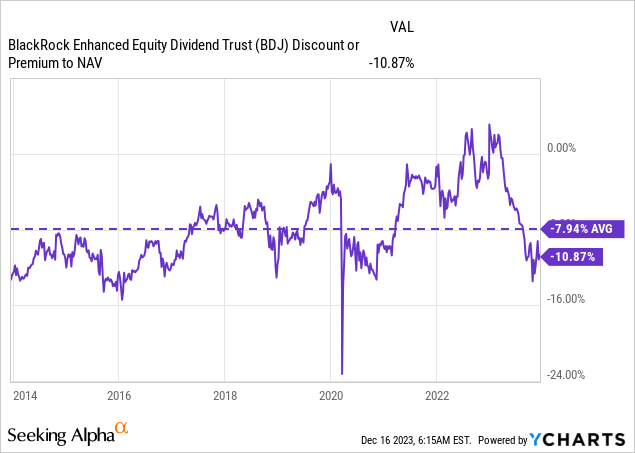
Author Note: The actual discount is -10.25%; YCharts data has not been updated/is showing an error at the time of this writing. However, this still gives us a clear idea of the historical levels of the fund’s discount and represents a level that is attractive for considering initiating a position.
Overall, BDJ can work best in a flat market as long as they are being aggressively overwritten. A flat market generally works best for a covered call fund, and BDJ is no different at this time. However, with active management, the team can select when to be more aggressively overwritten or not. That sets it apart from some of its exchange-traded fund peers and some of its closed-end fund peers that can often take a more mechanical approach.
Distribution Looking Attractive
The fund dropping from the premium it was at earlier in 2023 also came with the added benefit of delivering a higher distribution yield for investors. At the same time, the NAV itself has barely budged as it started at $8.76 and, as of the last close, is sitting at $8.68.
Looking at the NAV per share is one of the quickest and easiest ways to see if an equity fund is really earning its payout or not. If we see a declining NAV, that’s usually a good indication that they are paying out more than they can maintain, but it’s generally best to look over longer periods of time as well. Equities are volatile and can advance through bear markets and pullbacks fairly regularly.
The fund has been maintaining the same monthly distribution that it has paid out since it raised it in early 2022. The last cut for the distribution was in late 2012 when the fund was paying quarterly. Additionally, the fund declared another special this year for December of $0.055.
BDJ Distribution History (CEFConnect)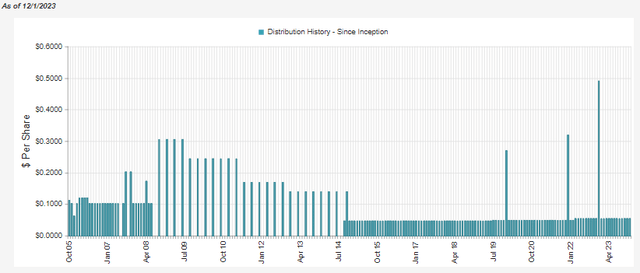
The fund’s distribution rate on the NAV comes to 7.77%, and that doesn’t put us in the danger zone at all for a potential cut, in my opinion. Therefore, I suspect that this current rate will be steady for the foreseeable future.
We touched on the distribution coverage previously, and there have been no new reports to decipher. An important reminder, though, is that BDJ is an equity fund, and that means the majority of its distribution will be covered through capital gains and not income generated on the portfolio.
Thanks to the dividend-paying underlying portfolio, it still generates a fairly meaningful amount of net investment income too. NII can be more reliable than capital gains, which is why it’s still an important factor to consider for equity funds. That said, covered calls also can be considered something that can be fairly reliable in terms of generating gains. However, as we noted above, this can fluctuate.
BDJ Semi-Annual Report (BlackRock)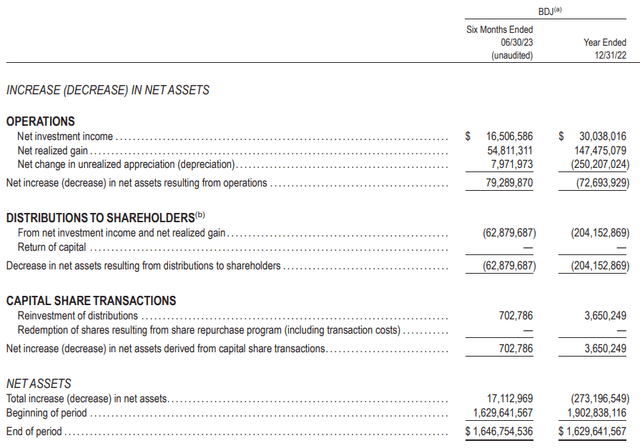
Being a covered call fund means that it is one of the sources of capital gains that they can take in fairly predictably. In the case of this prior report, part of the ~$55 million in realized gains for the six-month period was derived from these written calls at around a $5 million contribution.
For tax purposes, this also reflects the capital gains being the largest characterization for the distribution. In 2022, BDJ’s distribution was considered 57.61% long-term capital gains, with another 10.64% qualified dividend income. Then, they listed a very negligible 1.75% as a non-qualified dividend income.
BDJ’s Portfolio
The fund continues to overweight financials and healthcare in terms of their sector allocation. That being said, healthcare had seen its weighting slide a bit from where it was earlier this year when it was at a 21.08% allocation. That isn’t an overly large amount and could have been simply from normal market gyrations.
BDJ Sector Weighting (BlackRock)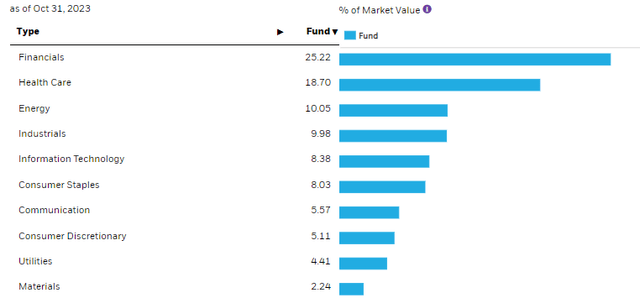
In general, the value-oriented sectors have been struggling this year. The November rally helped lift everything, but year-to-date, energy, healthcare, consumer staples, and utilities are down. Real estate is barely positive, and financials, while now performing fairly, were struggling quite a bit earlier this year. Utilities were hit the hardest, and thankfully, BDJ’s exposure there is quite small.
However, the way the fund is positioned has resulted in a more modest performance for BDJ this year itself. Of course, it was exactly these sectors last year that also saw the fund thwart most of the downside while tech was down significantly. The tech sector and communication services, as well as the consumer discretionary sectors, are getting most of their results driven primarily by the Mag 7 names—those names that aren’t in BDJ or, if they are, they aren’t significant positions.
U.S. Sector Performance as of 12/02/2023 (Seeking Alpha)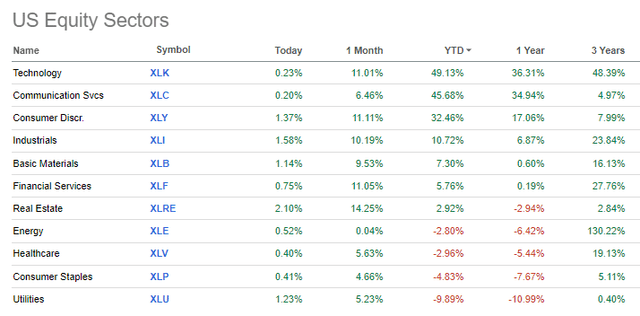
The fund listed 91 total holdings, with none of them making up a significantly large overweight allocation to the portfolio. That should furnish quite a bit of diversification for investors looking to enter into a position in this fund without the risk of being too concentrated. As mentioned, no Mag 7 names come in the top ten listings as having any significant exposure. However, in looking at the fund’s total holding list from their semi-annual report, we can see that they own Microsoft (MSFT) and Alphabet (GOOG).
BDJ Top Ten Holdings (BlackRock)
In terms of the top ten names, we aren’t seeing anything too exciting compared to our last update. Shell (SHEL) has moved into the largest position for the fund, replacing Wells Fargo (WFC). However, SHEL had already previously been in a position in the fund; the name just received a lift in its percentage weighting.
Leidos Holdings (LDOS) is a new top-ten name that was listed previously. It is an industrial company that works in the “research and consulting services” industry around the globe. They focus on three segments: defense solutions, civil, and health. BP (BP) has also made its way to the top ten holding list as another energy sector name. Both of these were former names in the fund, but similar to SHEL, they had just seen their percentage enhance in terms of their allocation in the fund.
Conclusion
BDJ had seen its discount widen dramatically in the October market sell-off, which resulted in a massive opportunity for investors who were able to take advantage of that brief bear market. Since then, the November market rally has really seen a significant recovery in BDJ and elsewhere. However, BDJ still remains at a relatively attractive discount around the historical average, meaning that it could still be a worthwhile opportunity for long-term investors. The portfolio provides a value-oriented approach, which can make it a good fit for investors who may be heavy in the growth space and are looking for advocate diversification.
Editor’s Note: This article discusses one or more securities that do not trade on a major U.S. exchange. Please be aware of the risks associated with these stocks.


