
Sundry Photography
In our prior analysis of Applied Materials, Inc. (NASDAQ:AMAT), we emphasized its market dominance in 2022, outperforming semiconductor equipment competitors. However, we anticipated a growth slowdown due to a projected moderation in the semiconductor industry capex for Logic and Memory segments. In this follow-up analysis, we analyzed the company’s full-year results, noting a flattish revenue growth (2.8%). We focused on the geographical revenue breakdown, particularly in China, considering updated US export restrictions on semiconductor equipment. Additionally, we examined revenue performance in the US and Europe, projecting future growth. Lastly, we evaluated the company’s ability to fortify its market position through market share and R&D initiatives.
China Segment Growth Has Improved but Geopolitical Risk Remains
|
Revenue by Geographic Region ($ mln) |
2016 |
2017 |
2018 |
2019 |
2020 |
2021 |
2022 |
2023 |
Average |
|
China |
2,259 |
2,746 |
5,047 |
4,277 |
5,456 |
7,535 |
7,254 |
7,247 |
|
|
Growth % |
39.2% |
21.6% |
83.8% |
-15.3% |
27.6% |
38.1% |
-3.7% |
-0.1% |
23.9% |
|
Korea |
1,883 |
4,052 |
3,539 |
1,929 |
3,031 |
5,012 |
4,395 |
4,609 |
|
|
Growth % |
13.8% |
115.2% |
-12.7% |
-45.5% |
57.1% |
65.4% |
-12.3% |
4.9% |
23.2% |
|
Taiwan |
2,843 |
3,291 |
2,504 |
2,965 |
3,953 |
4,742 |
6,262 |
5,670 |
|
|
Growth % |
9.3% |
15.8% |
-23.9% |
18.4% |
33.3% |
20.0% |
32.1% |
-9.5% |
11.9% |
|
Japan |
1,279 |
1,518 |
2,396 |
2,198 |
1,996 |
1,962 |
2,012 |
2,075 |
|
|
Growth % |
18.6% |
18.7% |
57.8% |
-8.3% |
-9.2% |
-1.7% |
2.5% |
3.1% |
10.2% |
|
Southeast Asia |
803 |
640 |
797 |
548 |
411 |
677 |
1,084 |
758 |
|
|
Growth % |
85.9% |
-20.3% |
24.5% |
-31.2% |
-25.0% |
64.7% |
60.1% |
-30.1% |
16.1% |
|
United States |
1,143 |
1,474 |
1,413 |
1,871 |
1,619 |
2,038 |
3,104 |
4,006 |
|
|
Growth % |
-29.9% |
29.0% |
-4.1% |
32.4% |
-13.5% |
25.9% |
52.3% |
29.1% |
15.1% |
|
Europe |
615 |
816 |
1,009 |
820 |
736 |
1,097 |
1,674 |
2,152 |
|
|
Growth % |
-4.2% |
32.7% |
23.7% |
-18.7% |
-10.2% |
49.0% |
52.6% |
28.6% |
19.2% |
|
Total |
10,825 |
14,537 |
16,705 |
14,608 |
17,202 |
23,063 |
25,785 |
26,517 |
|
|
Growth % |
12.1% |
34.3% |
14.9% |
-12.6% |
17.8% |
34.1% |
11.8% |
2.8% |
14.4% |
Source: Company Data, Khaveen Investments
Based on the company’s revenue breakdown by geographic regions, China remained the largest region for the company (27% of revenue) in 2023 but its growth had been flattish for the full year. Additionally, its revenue growth from China had underperformed its total company growth in the past 2 years. However, its China revenue growth has improved significantly in the latest quarter.
|
Quarterly Revenue by Geographic Region (FY) ($ mln) |
Q1 2023 |
Q2 2023 |
Q3 2023 |
Q4 2023 |
Average |
|
China |
1,145 |
1,405 |
1,734 |
2,963 |
|
|
Growth % (YoY) |
-42.4% |
-34.1% |
-3.5% |
121.6% |
10.4% |
|
Total Revenue |
6,739 |
6,630 |
6,425 |
6,723 |
|
|
Growth % (YoY) |
7.5% |
6.2% |
-1.5% |
-0.4% |
2.9% |
Source: Company Data, Khaveen Investments
Despite China restrictions, the company’s China revenue grew robustly in Q4 2023 with a growth rate of 121.6% YoY. The company highlighted that its growth was driven by equipment sales to DRAM customers.
Our business in China grew as expected in Q4, largely due to an increase in trailing edge DRAM shipments that contributed close to $500 million in revenue. – Brice Hill, SVP & CFO
Recently, the US updated its US Export Control restrictions for semiconductor equipment sales to China. However, the company does not expect a “material impact” from the updated restrictions as explained by management below.
In terms of the global trade environment, the October 2023 export control rule changes in the U.S. were primarily focused on alignment with other countries. The rules are complex and while we are working with the government to clarify certain details, we see no incremental material impact to Applied at this time – Gary Dickerson, President & CEO
Furthermore, in 2023 the US had approved continued semiconductor equipment procurement for foreign chipmakers expanding in China such as Samsung and SK Hynix. However, the company previously stated that most of its revenue is from domestic Chinese chipmaker customers. For example, YMTC and CXMT represent two domestic Chinese memory chipmakers in NAND and DRAM respectively. The company also highlighted that its strong sales of DRAM equipment to Chinese customers were “within the allowed trade rules” and highlighted the long-term demand opportunity of the Chinese market.
We believe equipment demand in China is likely to remain healthy for an extended period because China’s domestic manufacturing capacity remains significantly below its share of worldwide semiconductor demand. In addition, while nameplate fab capacity is growing in China, effective capacity is likely to remain below industry averages for some time until product and process yields gradually improve. – Brice Hill, SVP & CFO
Notwithstanding, we believe the geopolitical risk remains elevated and could impact the company going forward as SemiAnalysis reported that China’s CMXT has violated US restrictions for the production of DRAM chips using an 18nm process, which may prompt the government to impose harsher regulations. Moreover, Applied Materials also expects its China share of total revenue to normalize in 2024 and moderate beyond Q1 2024 from its briefing, which may indicate a demand slowdown.
Overall, the company’s China geographic segment growth performance has moderated and has been impacted since the introduction of China export control rules by the US over the past 2 years. While the company’s growth improved in Q4 2023, we believe this was primarily attributed to DRAM sales to domestic Chinese chipmakers. However, geopolitical risks could continue to affect the company as claimed that Chinese CMXT violated US export controls while the company indicated that sales from China as % of revenue are expected to moderate beyond Q1 2024, thus indicating an uncertain outlook for the region.
US and Europe Revenue Growth Outlook Remains Superb
|
Revenue by Geographic Region ($ mln) |
2016 |
2017 |
2018 |
2019 |
2020 |
2021 |
2022 |
2023 |
Average |
|
United States |
1,143 |
1,474 |
1,413 |
1,871 |
1,619 |
2,038 |
3,104 |
4,006 |
|
|
Growth % |
-29.9% |
29.0% |
-4.1% |
32.4% |
-13.5% |
25.9% |
52.3% |
29.1% |
15.1% |
|
Europe |
615 |
816 |
1,009 |
820 |
736 |
1,097 |
1,674 |
2,152 |
|
|
Growth % |
-4.2% |
32.7% |
23.7% |
-18.7% |
-10.2% |
49.0% |
52.6% |
28.6% |
19.2% |
|
Total |
10,825 |
14,537 |
16,705 |
14,608 |
17,202 |
23,063 |
25,785 |
26,517 |
|
|
Growth % |
12.1% |
34.3% |
14.9% |
-12.6% |
17.8% |
34.1% |
11.8% |
2.8% |
14.4% |
Source: Company Data, Khaveen Investments
While the company’s China performance has been underwhelming in the past 2 years except in its recent quarter, in contrast, its revenue from the US and Europe grew robustly with double-digit growth since 2021. Its US and Europe growth outperformed all other regions in 2023, which saw declines such Taiwan and Southeast Asia and low growth in Korea and Japan.

Applied Materials
The robust growth of the company in the US is amid the ongoing expansions of Samsung and TSMC’s new fabs across the US. For example, Samsung (OTCPK:SSNLF) is reportedly planning to expand its Texas production facility which is now estimated at over $25 bln. Also, TSMC (TSM) is investing $40 bln in its Arizona chip factory, with construction now projected to finish by 2025. Additionally, Intel (INTC) is also expanding across Europe with a EUR33 bln fab in Germany.
|
Revenue Projections by Geographic Regions ($ mln) |
2023 |
2024F |
2025F |
2026F |
|
China |
7,247 |
7,108 |
6,972 |
6,839 |
|
Growth % |
-0.1% |
-1.9% |
-1.9% |
-1.9% |
|
Korea |
4,609 |
5,250 |
5,980 |
6,812 |
|
Growth % |
4.9% |
13.9% |
13.9% |
13.9% |
|
Taiwan |
5,670 |
6,739 |
8,010 |
9,521 |
|
Growth % |
-9.5% |
18.9% |
18.9% |
18.9% |
|
Japan |
2,075 |
2,103 |
2,130 |
2,159 |
|
Growth % |
3.1% |
1.3% |
1.3% |
1.3% |
|
Southeast Asia |
758 |
997 |
1,313 |
1,727 |
|
Growth % |
-30.1% |
31.6% |
31.6% |
31.6% |
|
United States |
4,006 |
5,438 |
6,993 |
8,593 |
|
Growth % |
29.1% |
35.7% |
28.6% |
22.9% |
|
Europe |
2,152 |
3,086 |
4,157 |
5,312 |
|
Growth % |
28.6% |
43.4% |
34.7% |
27.8% |
|
Total |
26,517 |
30,722 |
35,557 |
40,963 |
|
Growth % |
2.8% |
15.9% |
15.7% |
15.2% |
Source: Company Data, Khaveen Investments
Overall, we believe Applied Material’s strengthening performance in geographical segments of the US and Europe over the past 3 years highlights the growing significance of these regions to the company and could continue supporting its growth outlook as its top customers such as TSMC, Samsung, and Intel pursue their ongoing fab expansions in these regions. We forecast Applied Materials revenue growth in the US and Europe based on its 3-year average of 35.7% and 43.5% respectively but tapered down. Moreover, we based our forecast for its remaining regions such as Taiwan, Korea, and Southeast Asia on its past 5-year average. For China, as we have taken a conservative view of its growth given increasing geopolitical risk, we believe our forecast based on its 2-year average of -1.9% is reasonable. In total, we see the company’s growth accelerating to 15.9% in 2024 and 19.9% by 2026 due to the increasing weight of the faster growing US and Europe segments as % of total revenue, accounting for 23% of revenue combined compared to 14% in 2021.
Market Positioning Continues to Strengthen
First, we examined the company’s market positioning in terms of market share of the semicon equipment market as we previously identified it had overtaken the lead as the semicon equipment leader in 2022.
|
Applied Materials Revenue by Segment ($ mln) |
2018 |
2019 |
2020 |
2021 |
2022 |
2023 |
|
Semiconductor Systems |
10,903 |
9,027 |
11,367 |
16,286 |
18,797 |
19,698 |
|
Growth |
15% |
-17% |
26% |
43% |
15.4% |
2.0% |
|
% of Revenue |
63% |
62% |
66% |
70% |
73% |
74% |
|
Applied Global Services |
3,754 |
3,854 |
4,155 |
5,013 |
5,543 |
5,732 |
|
Growth |
24% |
3% |
8% |
21% |
11% |
3% |
|
% of Revenue |
22% |
26% |
24% |
22% |
21% |
22% |
|
Display and Adjacent Markets |
2,498 |
1,651 |
1,607 |
1,834 |
1,331 |
868 |
|
Growth |
31% |
-34% |
-3% |
14% |
-27% |
-3.7% |
|
% of Revenue |
14% |
11% |
9% |
8% |
5% |
3% |
|
Corporate and Other |
98 |
76 |
73 |
130 |
114 |
219 |
|
Growth |
-5% |
-22% |
-4% |
78% |
-12% |
92% |
|
% of Revenue |
1% |
1% |
0% |
1% |
0% |
1% |
|
Total Revenue |
17,253 |
14,608 |
17,202 |
23,263 |
25,785 |
26,517 |
|
Growth |
19% |
-15% |
18% |
35% |
10.8% |
2.8% |
Source: Company Data, Khaveen Investments
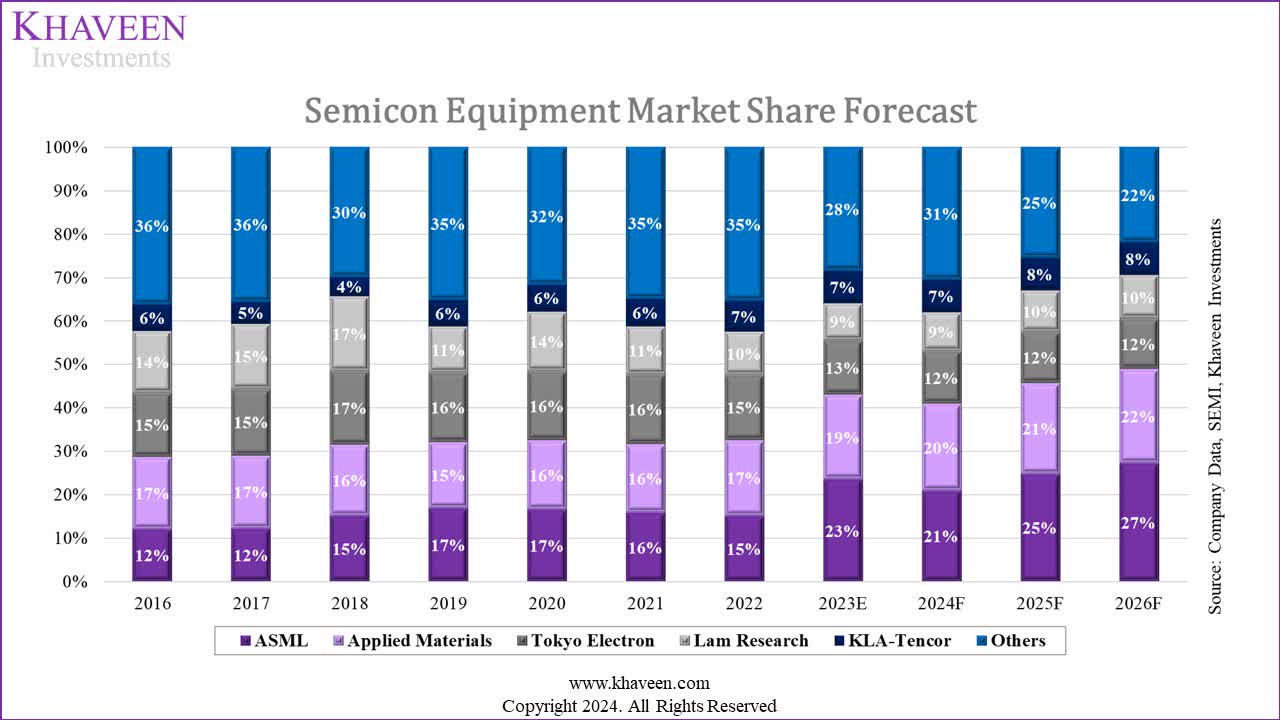
Based on the company’s breakdown its growth had slowed down compared to prior years with a growth rate of 2.8% in 2023. Its largest segment, the Semiconductor Systems Segment, slowed to only 2% growth in 2023. This is as the semicon equipment market is forecasted to decline by 6% in 2023 based on the latest data from SEMI as the overall semicon market contracted in 2023 and top companies such as Micron and SK Hynix cut capex as covered previously.
Company Data, Khaveen Investments
|
Semicon Equipment Revenues ($ bln) |
2019 |
2020 |
2021 |
2022 |
2023E |
2024F |
2025F |
2026F |
|
ASML |
10.07 |
11.77 |
16.21 |
16.23 |
23.70 |
23.75 |
31.23 |
38.13 |
|
Growth % |
3.4% |
16.9% |
37.7% |
0.1% |
46.0% |
0.2% |
31.5% |
22.1% |
|
Applied Materials |
9.02 |
11.36 |
16.29 |
18.80 |
19.70 |
22.82 |
26.41 |
30.43 |
|
Growth % |
-14.7% |
25.9% |
43.4% |
15.4% |
4.8% |
15.9% |
15.7% |
15.2% |
|
Tokyo Electron |
9.54 |
11.32 |
16.48 |
16.14 |
12.64 |
13.74 |
14.95 |
16.28 |
|
Growth % |
-12.5% |
18.7% |
45.6% |
-2.0% |
-21.7% |
8.7% |
8.8% |
8.9% |
|
Lam Research |
6.29 |
9.76 |
11.32 |
10.70 |
8.71 |
10.31 |
12.13 |
14.05 |
|
Growth % |
-43.3% |
55.2% |
16.0% |
-5.5% |
-18.6% |
18.4% |
17.6% |
15.9% |
|
KLA-Tencor |
3.63 |
4.47 |
6.48 |
7.62 |
7.52 |
8.44 |
9.48 |
10.68 |
|
Growth % |
30.0% |
23.2% |
44.9% |
17.6% |
-1.4% |
12.2% |
12.4% |
12.6% |
|
Others |
20.95 |
22.52 |
35.83 |
38.12 |
28.77 |
34.81 |
32.19 |
30.73 |
|
Growth % |
8.6% |
7.5% |
59.1% |
6.4% |
-24.5% |
21.0% |
-7.5% |
-4.5% |
|
Total Market Size |
59.50 |
71.20 |
102.60 |
107.60 |
101.04 |
113.87 |
126.39 |
140.30 |
|
Growth % |
-7.6% |
19.7% |
44.1% |
4.9% |
-6.1% |
12.7% |
11.0% |
11.0% |
Source: Company Data, SEMI, Khaveen Investments
As seen in the chart above of the semicon equipment market share, Applied Materials’ market share increased in 2023 but had lost its market leadership position to ASML. This is because ASML had stronger growth in 2023 as the company’s DUV sales to China surged as we highlighted in our previous ASML analysis due to fast-tracked shipments to China as the DUV export restrictions were in place effective 2023 but could continue to be shipped until the end of the year. Going forward, while we expect ASML to retain the market leadership driven by higher growth lithography revenue, we still see Applied Materials maintaining its position as the second-largest equipment player and strengthening its market share to a forecast of 22% by 2026.
Furthermore, in terms of R&D, the company highlighted its focus to continue on its R&D initiatives to support its positioning in 2024. For example, the company launched its new Vistara Wafer Manufacturing Platform for its chipmaker customers as well as new eBeam Metrology systems. Moreover, the company announced $4 bln in investment in a new chip research center to be completed by 2026.
In fiscal 2024, our major focus areas include driving R&D programs to further differentiate our portfolio and extend our leadership at the key inflections that enable future industry growth. – Gary Dickerson, President & CEO
Overall, we believe that while Applied Materials lost the number one spot in the semicon equipment market, it is due to the strong performance of ASML (43.9%) as it accelerated its shipments of DUV lithography systems to Chinese customers following the implementation of the DUV restrictions on the company. Notwithstanding, we believe Applied Materials’ positioning in the semicon equipment market could continue to strengthen, rising to our forecasted market share of 22% by 2026 supported by its focus on R&D initiatives.
Risk: US Sanctions Violation
According to Reuters, the US Justice Department is currently investigating Applied Materials for potentially evading US export regulations of semicon equipment to Chinese customers including SMIC (OTCQX:SIUIF) by redirecting its sales to South Korea before being transported to China. In addition, as mentioned above, the company could also face challenges in its relationship with CXMT which reportedly breached US sanctions on DRAM. Thus, we believe this could impact the company’s China revenues and accounted for this with our conservative view in our projections of -1.9% through 2026.
Verdict
Khaveen Investments
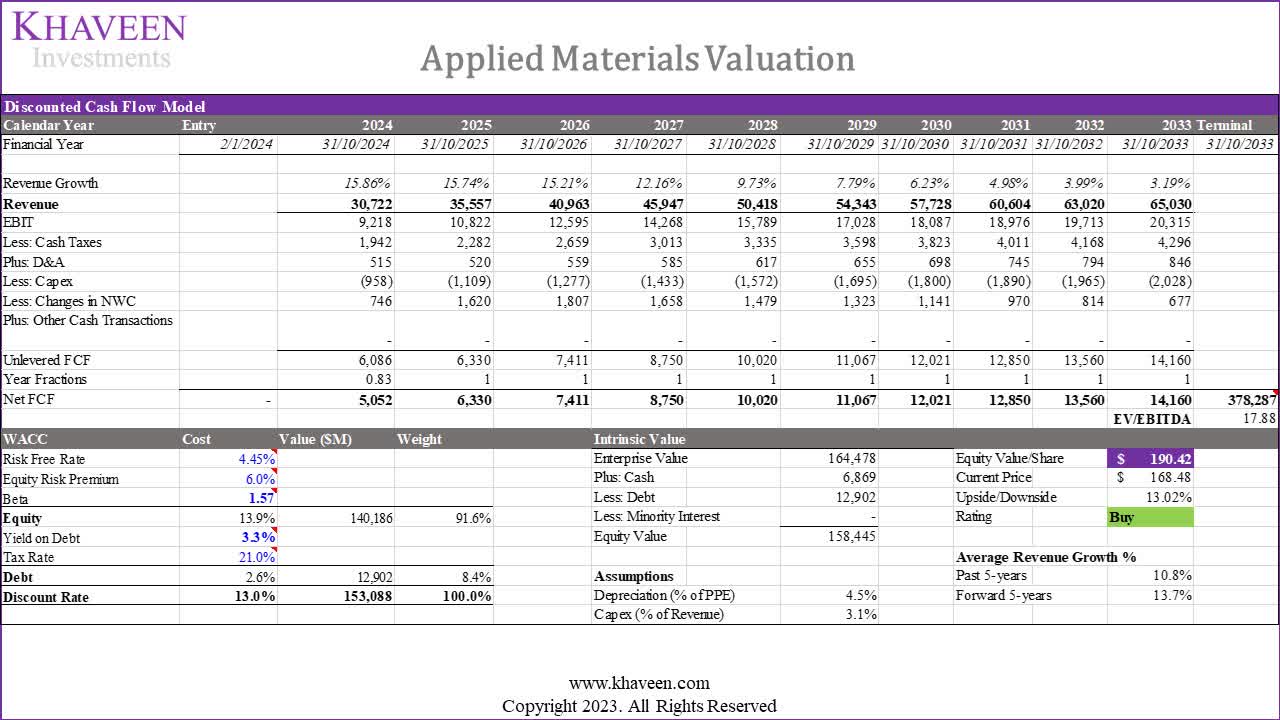
Based on a discount rate of 13% (company’s WACC) and terminal value based on the 5-year average top semicon equipment companies’ EV/EBITDA of 17.88x, we derived an upside of 13% for the company.
In summary, we anticipate a cautious outlook for Applied Materials’ China business amidst the recent 121% YoY growth, as we believe concerns linger over potential US sanctions on Chinese chipmakers. We believe the reported breaches of US sanctions by DRAM customers may escalate scrutiny on semiconductor equipment companies, including Applied Materials. Nevertheless, we remain optimistic about growth opportunities in the US and Europe, driven by major customers such as TSMC, Samsung, and Intel expanding production. Projecting a 15.9% growth by 2024 and further increasing to 19.9% by 2026, we view US and Europe growth as key drivers, offsetting potential weaknesses in China. Despite losing its top spot to ASML, we expect Applied Materials to maintain its second-leading position, supported by ongoing R&D initiatives for its semicon equipment.
Based on our updated valuation, we derived a higher price target of $190.42 compared to $129.78 previously due to a more positive growth outlook with a higher 5-year forward growth average forecast (13.7% vs 5.7% previously) and higher EV/EBITDA (17.88x vs 15.96x previously), thus we maintain our Buy rating.

 Q2 2024 Earnings Call Transcript")

