tadamichi
AOR strategy
iShares Core Growth Allocation ETF (NYSEARCA:AOR) started investing operations on 11/04/2008 and tracks the S&P Target Risk Growth Index. It is a fund of funds, with 7 holdings, a 12-month trailing yield of 2.50%, and a net expense ratio of 0.15%. Distributions are paid quarterly.
The idea of a 60/40 portfolio has been credited to Harry Markowitz. AOR implements it with a global approach. As described by S&P Dow Jones Indices, the underlying index is composed of 60% equities and 40% fixed income held in 7 Exchanged-Traded Funds, or ETFs, listed below: 3 U.S. equity funds, 2 international equity funds, 1 U.S. bond fund and 1 international bond fund.
- iShares Core S&P 500 ETF (IVV)
- iShares Core S&P MidCap ETF (IJH)
- iShares Core S&P Small-Cap ETF (IJR)
- iShares Core MSCI International Developed Markets ETF (IDEV)
- iShares Core MSCI Emerging Markets ETF (IEMG)
- iShares Core Total USD Bond Market ETF (IUSB)
- iShares Core International Aggregate Bond Fund (IAGG).
Funds may be deleted and added in the eligibility list if necessary.
The funds of the 60% equity allocation are weighted based on the relative market capitalization of their stock universes. The 40% bond allocation is 85% in the U.S. bond fund and 15% in the international bond fund. The index is rebalanced twice a year. The portfolio turnover rate in the most recent fiscal year was 6%.
AOR portfolio
All holdings are listed in the next table. As of writing, 61.7 % of asset value is in equities, 38.2% in bonds, and 0.1% in cash equivalent.
|
Ticker |
Name |
Asset Class |
Weight (%) |
|
(IVV) |
iShares Core S&P 500 ETF |
Equity |
34.15 |
|
(IUSB) |
iShares Core TOTAL USD BOND MARKET |
Fixed Income |
32.68 |
|
(IDEV) |
iShares Core MSCI INTL DEVELOPED |
Equity |
18.21 |
|
(IEMG) |
iShares Core MSCI EMERGING |
Equity |
6.21 |
|
(IAGG) |
iShares Core INTL AGGREGATE BOND |
Fixed Income |
5.52 |
|
(IJH) |
iShares Core S&P MID-CAP ETF |
Equity |
2.16 |
|
(IJR) |
iShares Core S&P SMALL-CAP ETF |
Equity |
0.96 |
|
XTSLA |
BLK CSH FND TREASURY SL AGENCY |
Money Market |
0.12 |
|
USD |
USD CASH |
Cash |
-0.01 |
About 64.5% of asset value is invested in U.S. issuers. There’s a discrepancy with the weight of U.S. ETFs (about 70%), because some companies have a double listing and are included in U.S. and international indexes. It means that these companies show up multiple times in the fund’s portfolio. For example, Merck & Co (MRK) weighs 0.75% in IVV and 0.1% in IDEV as equity. It also appears as a bond issuer in both IUSB and IAGG. This inconvenience of using ETFs with a small overlap is offset by the ease of rebalancing the portfolio.
The next chart lists the top countries ranked by the aggregate weight of their issuers, excluding the U.S.
Geographical allocation excluding the U.S. (Chart: author; data: iShares)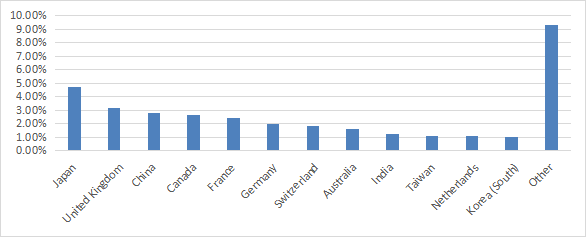
As reported in the next table, valuation ratios of the equity part are cheaper than the U.S. stock market represented by Vanguard Total Stock Market ETF (VTI). Growth metrics are similar. International ex-US markets have lower “price-to-something” ratios, which may be justified by country risk discounts and sector breakdowns that are quite stable. It doesn’t necessarily mean that their valuation is more attractive.
|
AOR |
VTI |
|
|
Price/Earnings TTM |
17.3 |
22.5 |
|
Price/Book |
2.38 |
3.82 |
|
Price/Sales |
1.71 |
2.43 |
|
Price/Cash Flow |
11.74 |
15.56 |
|
Earnings growth |
17.20% |
15.69% |
|
Sales growth |
10.61% |
10.51% |
|
Cash flow growth |
7.62% |
7.48% |
Performance vs benchmark
The next table compares performance and risk metrics of AOR since inception with a U.S. 60/40 portfolio (SPY, BND) and a “Permanent Portfolio” inspired by Harry Browne and modeled by SPY, BND, BIL, GLD in equal weight.
|
Total Return |
Annual Return |
Drawdown |
Sharpe ratio |
Volatility |
|
|
AOR |
217.52% |
7.92% |
-22.95% |
0.67 |
10.16% |
|
60% SPY/40% BND |
330.83% |
10.11% |
-21.80% |
0.89 |
9.85% |
|
SPY, BND, BIL, GLD |
158.56% |
6.47% |
-12.32% |
0.81 |
6.37% |
Calculation by Portfolio123.
AOR has lagged “US 40/60,” partly due to currency risk. The dollar index has gained about 20% since AOR inception: it has been a drag on the price of international securities measured in USD. AOR beats the permanent portfolio in return, but not in risk-adjusted performance (Sharpe ratio). Indeed, the permanent portfolio has been more efficient at reducing price volatility, and the maximum drawdown as well.
AOR vs. competitors
The next table compares characteristics of AOR and five other multi-asset funds:
- iShares Core Moderate Allocation ETF (AOM)
- iShares Core Conservative Allocation ETF (AOK)
- SPDR SSGA Multi-Asset Real Return ETF (RLY)
- Strategy Shares NASDAQ 7 HANDL Index ETF (HNDL)
- WisdomTree U.S. Efficient Core Fund (NTSX).
|
AOR |
AOM |
AOK |
RLY |
HNDL |
NTSX |
|
|
Inception |
11/4/2008 |
11/4/2008 |
11/4/2008 |
4/25/2012 |
1/16/2018 |
8/2/2018 |
|
Expense Ratio |
0.15% |
0.15% |
0.15% |
0.50% |
0.96% |
0.20% |
|
AUM |
$2.03B |
$1.36B |
$647.68M |
$503.57M |
$886.93M |
$961.58M |
|
Avg Daily Volume |
$25.61M |
$11.25M |
$9.37M |
$6.44M |
$3.03M |
$4.12M |
|
4 Year Average Yield |
2.07% |
2.14% |
2.17% |
5.84% |
7.17% |
1.15% |
|
Div. Growth 5 Yr (annualized) |
5.28% |
5.10% |
3.86% |
9.98% |
-3.40% |
27.57% |
AOR has the lowest fee, on par with AOM and AOK, which implement similar strategies with 40/60 and 30/70 asset class allocations.
The next chart compares total returns since 8/6/2018 to match all inception dates. AOR is in second position behind NTSX. However, the comparison is not fair: NTSX leverages the same 60/40 allocation by a 1.5 factor, reaching 90/60, thanks to using futures for the bond part.
AOR vs competitors since 8/6/2018 (Seeking Alpha)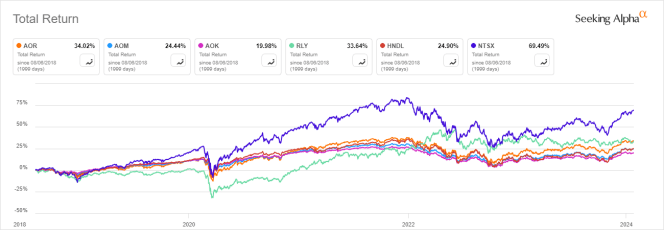
Over the last 12 months, AOR also is the second-best performer.
AOR vs. competitors, trailing 12 months (Seeking Alpha)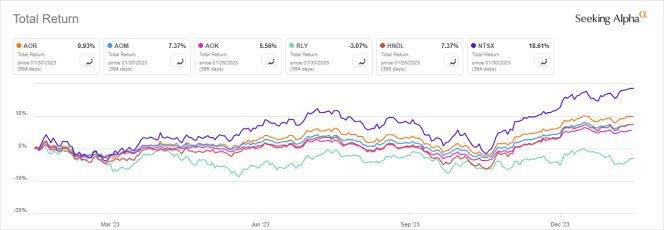
Takeaway
iShares Core Growth Allocation ETF has a 60/40 allocation in global equities and bonds through ETFs. Exposure to foreign securities implies some currency risk, which has been detrimental to asset value since the fund’s inception in 2008. However, it may become favorable if the U.S. dollar goes down. Among competitors, WisdomTree U.S. Efficient Core Fund implements a 60/40 strategy with a 1.5 leveraging factor and about 98% of assets in U.S. securities. Leveraging comes with better past performance, but also with higher volatility. Investors may optimize their capital by using a NTSX position size of two thirds of a non-leveraged U.S. 60/40 portfolio for a similar risk and reward.

 Q2 2024 Earnings Call Transcript")

