DNY59
Advanced Micro Devices, Inc. (NASDAQ:AMD) has shown strong performance in the past year, exceeding expectations and driving the stock to record highs. However, it’s essential to carefully assess the risks and opportunities associated with these elevated price levels. This article explores a short-term trading opportunity, considering various outcomes while maintaining a balanced risk perspective. It discusses setting appropriate stop-loss levels and actively managing risk exposure, considering both the broader technology market and industry performance.
A Macro Perspective
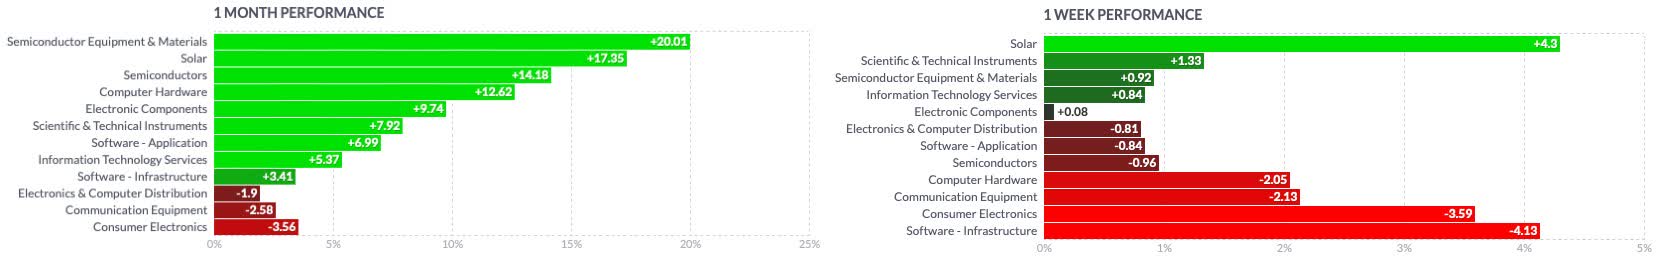
Over the past year, the technology sector in the U.S. has demonstrated remarkable growth, driving expansion across the economy. Among its standout performers, the semiconductor industry has particularly excelled, closely followed by computer hardware and semiconductor equipment and materials. This surge in performance can be attributed to the rise of innovative technologies centered around data centers, Artificial Intelligence [AI], Machine Learning [ML], and the increasing accessibility of the Internet of Things [IoT]. These factors and more comprehensive network connectivity and digitalization efforts have propelled these industries toward sustained growth.
However, despite this upward trajectory, there are indications of potential challenges ahead. While the past year witnessed significant momentum in the sector, whether this trend will be sustainable in the long term is still being determined. A closer examination of recent performance reveals emerging weaknesses within specific segments of the technology industry.
finviz finviz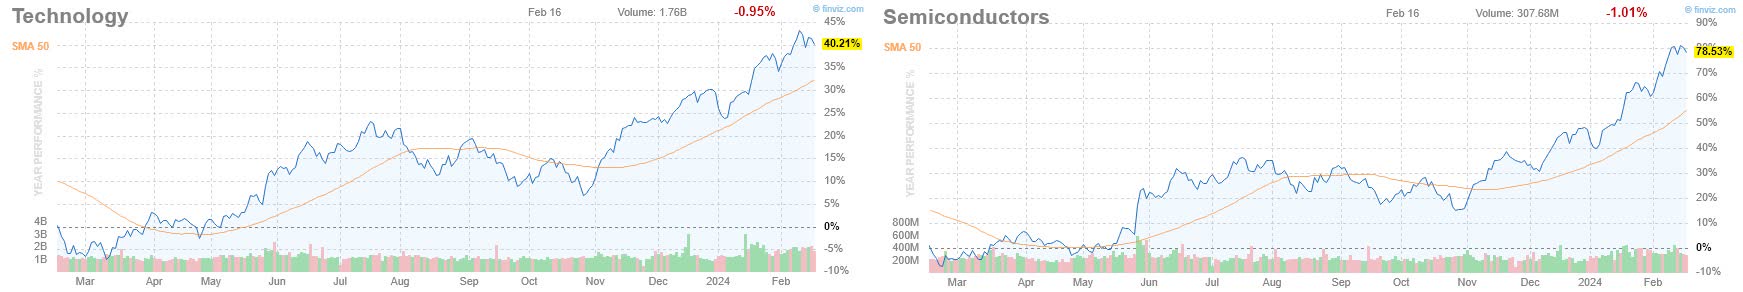
The VanEck Semiconductor ETF (SMH) is in the late stage of a five-wave impulse sequence, which has been successfully formed based on the wave structure, which suggests an extension of wave 5 within the range of $193 to $206. While there is still room for the rally to continue, there are signs that a healthy correction may be imminent.
One indication is the extended Moving Average Convergence Divergence [MACD] momentum indicator, which suggests that the parabolic run-up is due for a pullback. Additionally, it appears overextended when comparing the relative strength of the semiconductor industry benchmark to the broader equity market, represented by the iShares Russell 2000 ETF (IWM).
Furthermore, the recent rally lacks intense buying pressure, as the On Balance Volume [OBV] indicates. This contrasts with the formation of wave 3, which saw significant buying pressure from the pandemic low in March 2020 to November 2021.
Author, using TradingView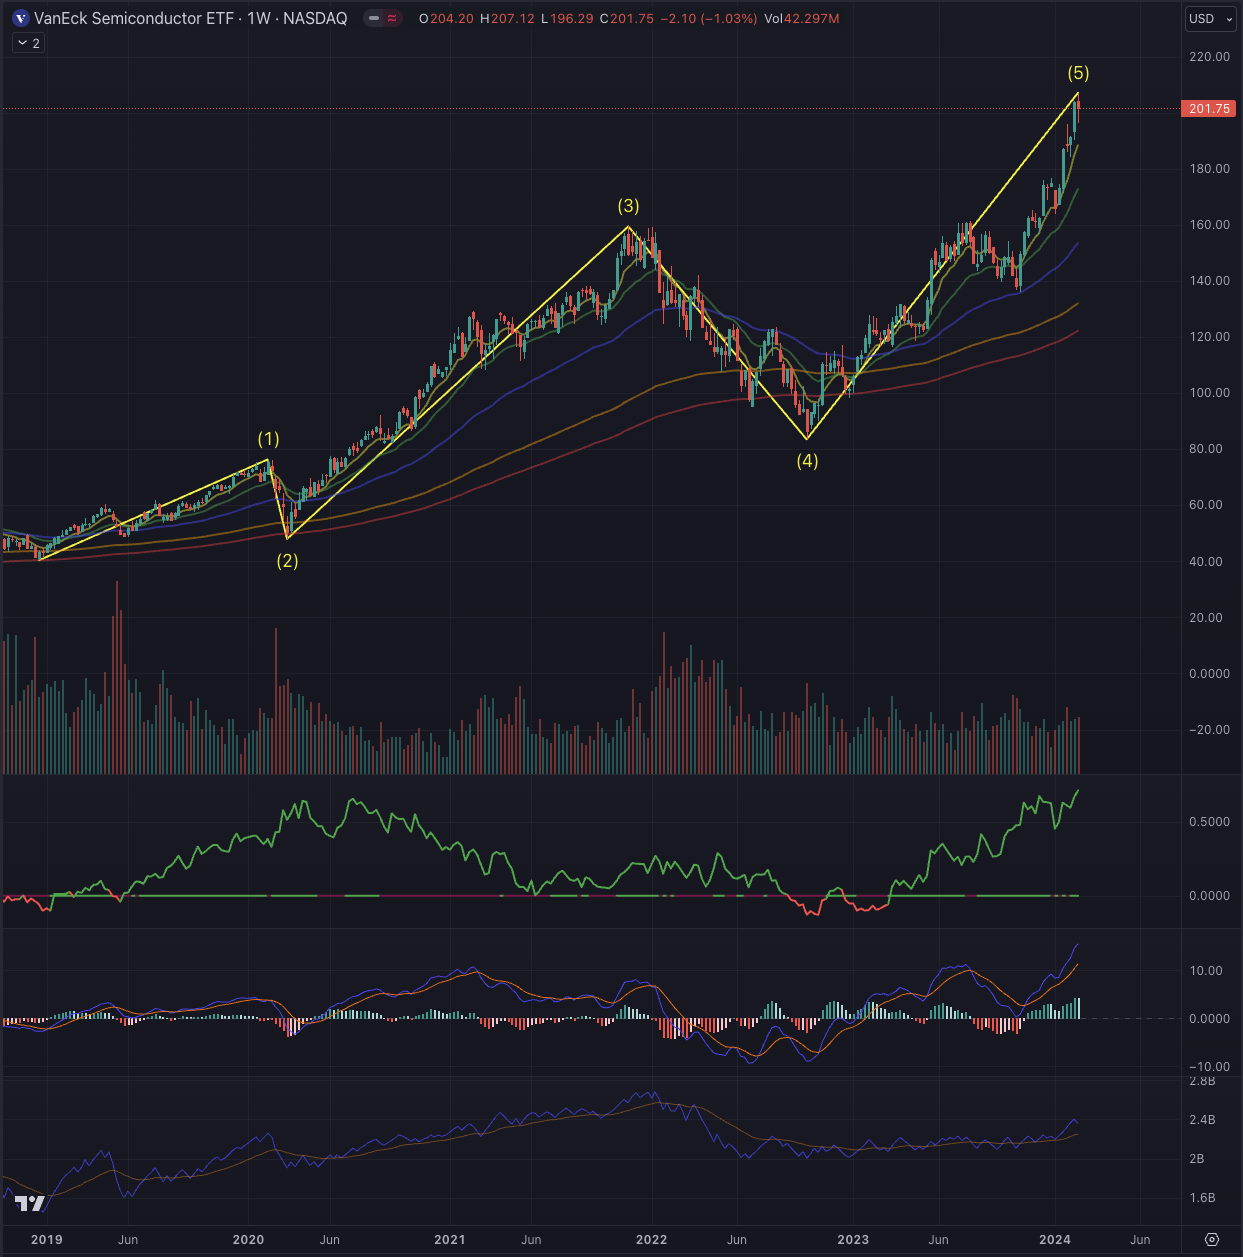
Where are we now?
On August 4, 2022, I wrote an article on AMD, grounded in fundamental analysis, wherein I recommended a buy rating for the stock and projected a weighted average price target of $126. Remarkably, the stock reached this target within a mere ten months. However, it’s notable that despite this rapid achievement, I did not conduct an intermediary reevaluation of my price target, a step that would have been prudent given the stock’s substantial gains.
Although an updated assessment would have been advisable, it’s worth mentioning that the actual price significantly surpassed even my most bullish estimation of $141 by the end of 2023.
Upon reviewing the weekly chart, it becomes evident that AMD followed a distinctive price movement pattern. Initially, it formed a five-wave impulse sequence, culminating in a peak in November 2021. Subsequently, the stock underwent a three-wave corrective sequence, which concluded in October 2023. Since then, AMD has experienced a robust rally characterized by a steep ascent. This surge propelled the stock to break out above the previous high set in November 2021, ultimately reaching a new All-Time High [ATH] of $184.92 on January 25, 2024.
Author, using TradingView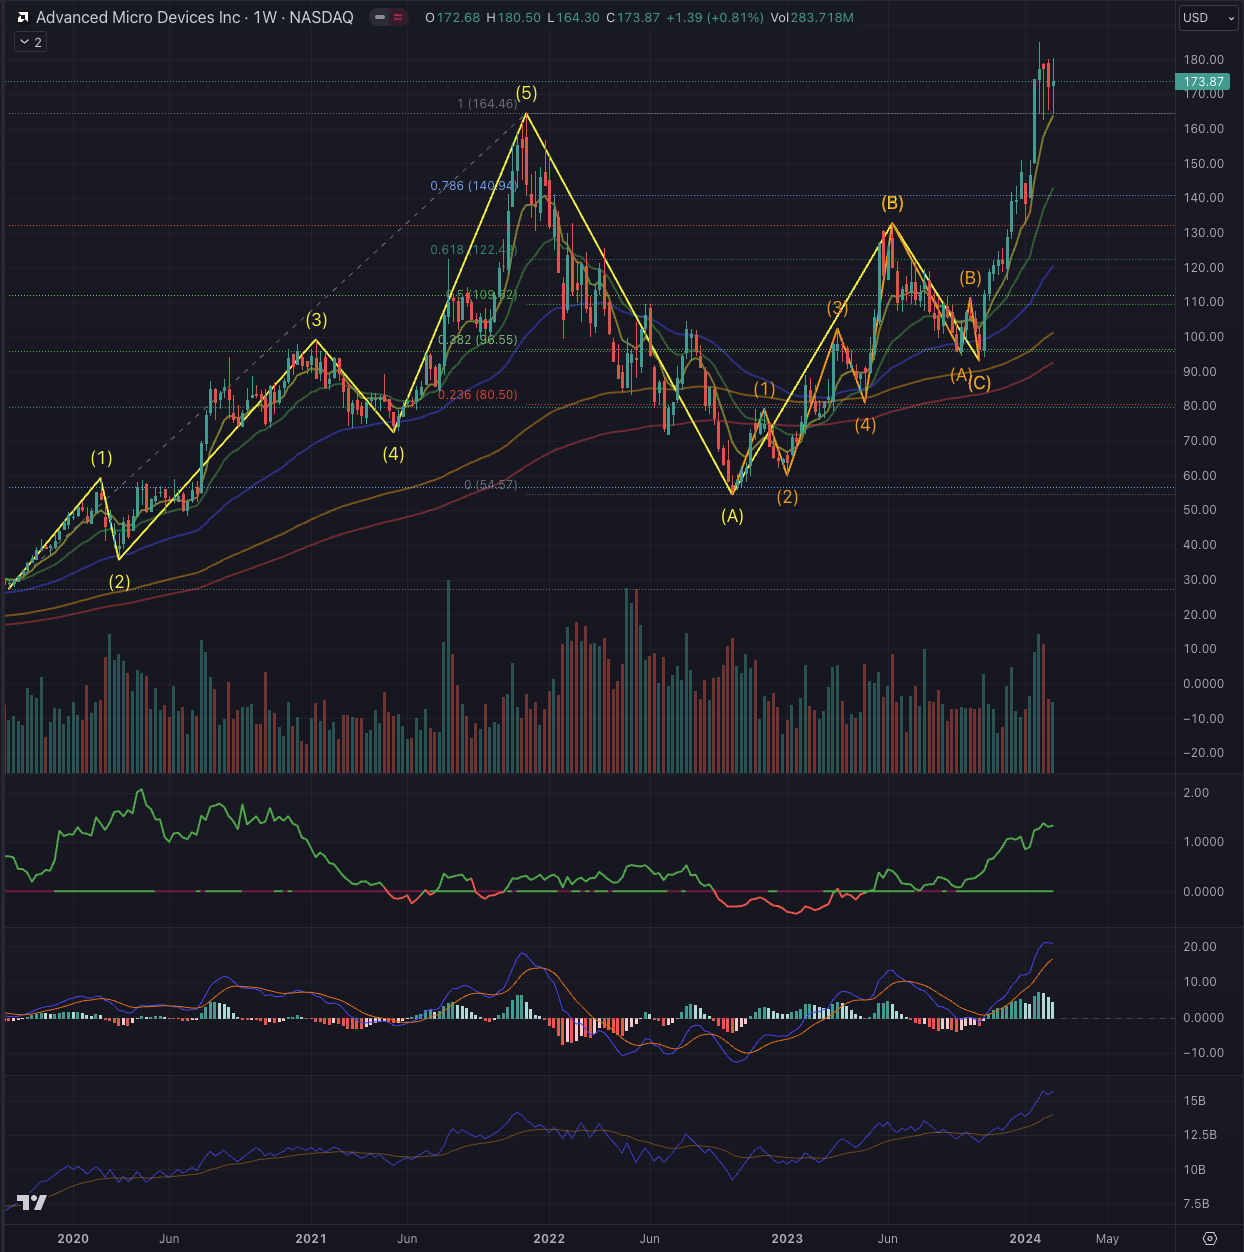
The current analysis of AMD indicates a possible overextension in the short term, as evidenced by notable expansions of its Exponential Moving Averages [EMAs], along with a peak in momentum according to the stock’s MACD and the recent acceleration in buy-side pressure. While these insights were observed from AMD’s weekly chart, it is crucial to zoom in and confirm them on the daily chart. This timeframe will provide a more transparent assessment of the structure of the recent rally, which may be less apparent on the weekly chart. By examining the daily chart, I can better gauge the dynamics and ascertain whether the stock’s current trajectory is sustainable or whether a corrective phase may be imminent.
What is coming next?
A closer examination of AMD’s daily chart reveals a distinct five-wave impulse sequence in the recent upward movement. This sequence resulted in a sweep of the liquidity pool above the peak of 2021. However, the price has consolidated over the past four weeks instead of forming a double-top pattern, establishing a trading range between $164 and $180. This consolidation suggests a potential pause in the bullish momentum.
Moreover, the MACD has reversed and is currently indicating negative momentum. Additionally, the stock’s relative strength is weakening compared to the technology index, represented by the Nasdaq Composite (IXIC). This divergence raises concerns about the sustainability of AMD’s current price levels. Furthermore, the On Balance Volume [OBV] shows signs of peaking and has recently negatively crossed its 21-day average. This crossing is typically interpreted as a signal of increasing selling pressure and suggests a potential buildup in bearish sentiment.
Author, using TradingView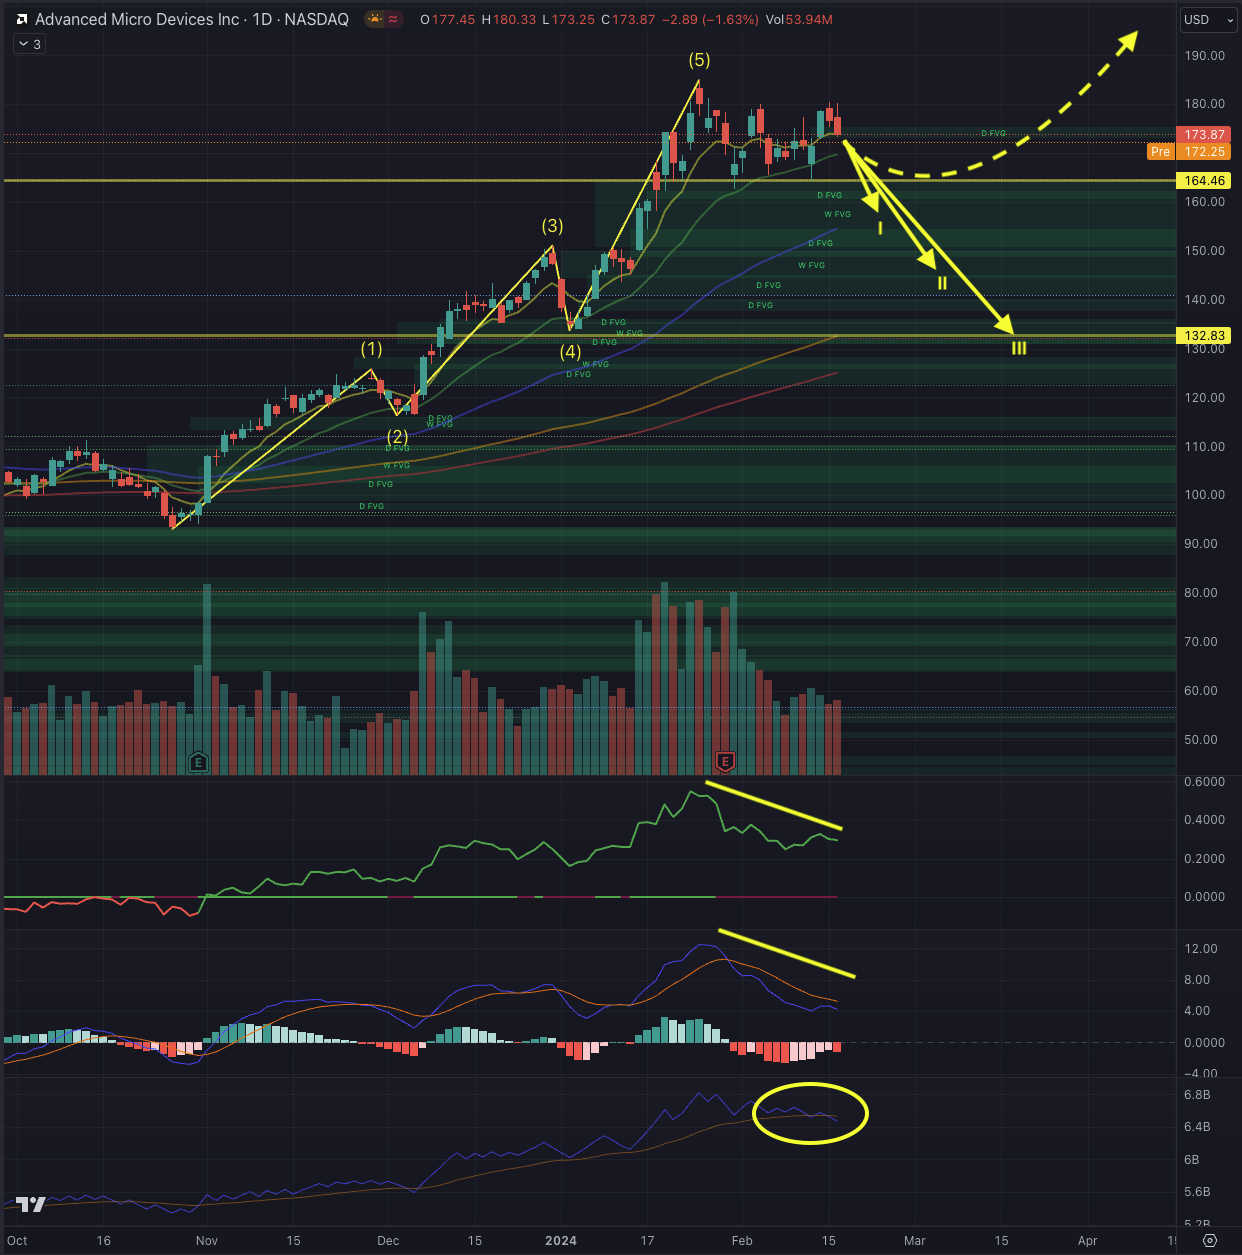
While the current price action could simply signify a consolidation phase preceding further highs, my primary scenario anticipates a correction following the two substantial upward movements witnessed since October 2022. In this scenario, AMD would breach the support of the price range, potentially targeting $157 as the initial level, followed by $145 and $133 as subsequent targets. These targets are identified based on catching liquidity left in the Fair Value Gaps [FVG], should the weakness deepen. It’s worth noting that two runaway gaps remain open between $71.65 and $70.29, and between $65.76 and $64.62. However, I do not foresee these gaps being filled in the near future, as doing so would likely require a significant breakdown resulting from a substantial shift in fundamental market conditions or factors affecting the company’s growth prospects, which is not expected within the timeframe of this analysis.
For investors seeking to protect their gains, implementing a stop-loss strategy could be prudent. One option is to set a stop-loss below the bottom of the trading range, specifically under $164. Alternatively, a trailing stop-loss could be set below the EMA21 or EMA55, with the latter allowing for greater risk tolerance. These measures can help mitigate potential losses in the event of a downward reversal in AMD’s price.
In an alternative scenario, the stock could reach $200 if AMD’s extension persists. However, achieving this would require a significant increase in buying pressure and relative strength, which currently needs improvement. For investors who fear missing out on such an upward move, placing buy orders above the price range, above the ATH at $185, could be pondered.
Considering my observations and the acknowledgment that both AMD and the industry benchmark have reached significant targets and are extended, suggesting a probable retracement, it is prudent to consider taking at least partial profits. Despite recognizing AMD’s potential in secular growth trends, the current stock price reflects an overly optimistic environment. From a technical and short-term perspective, the risks outweigh the opportunities, leading me to downgrade AMD to a sell position.
As competitor NVIDIA Corporation (NVDA) approaches its upcoming Q4 and FY2024 financial results event on February 21, more impulses are expected. However, I would avoid adding new positions, as the risk/reward profile seems unfavorable.
The bottom line
Technical analysis is a valuable tool for investors, offering guidance rather than absolute certainty, akin to consulting a map or using GPS for navigation. It serves as a strategic guide to the complexities of the stock market, incorporating techniques rooted in the Elliott Wave Theory and Fibonacci’s principles to assess likely outcomes based on probabilities. By analyzing factors such as sector, industry, and price action, technical analysis assists in confirming or refuting potential entry points, aiming to scrutinize an asset’s situation and calculate probable outcomes.
Over the past year, the U.S. technology sector has surged, driven by advancements in semiconductors and related industries. Despite this growth, signs of potential challenges are emerging. The VanEck Semiconductor ETF indicates a possible overheating, and indicators suggest a looming correction. A closer look at AMD’s chart underscores consolidation after a strong upward movement, with downside targets identified, leading me to downgrade AMD to a sell position. While investors can consider protective measures and upside opportunities, caution is advised due to the discussed retracement risks.

 Q2 2024 Earnings Call Transcript")

