Eugene Mymrin/Moment via Getty Images
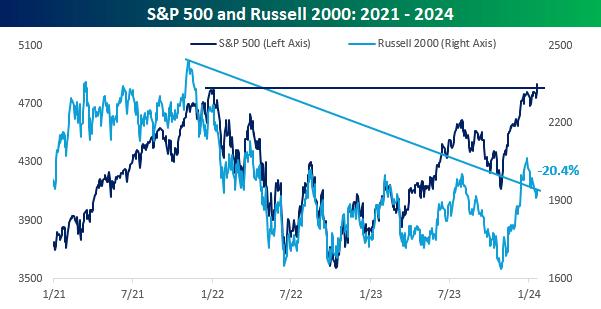
In what is a disparity you don’t see very often, just as the S&P 500 hit an all-time high (ATH) on Friday, the small-cap Russell 2000 remains mired in a bear market as it’s still more than 20% from its record high in late 2021.
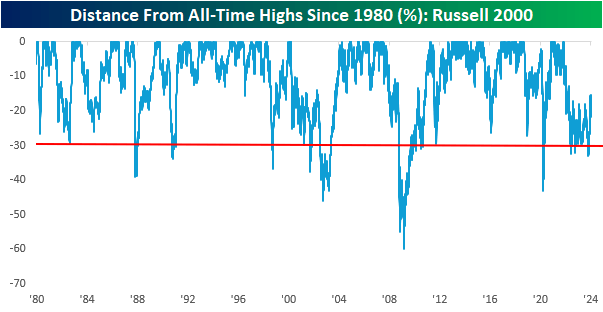
For the Russell 2000, the magnitude of the index’s drawdown from its record high eclipsed 30% during this current bear market, which is a level it also eclipsed during the Covid crash and then several other times in the index’s history before that.
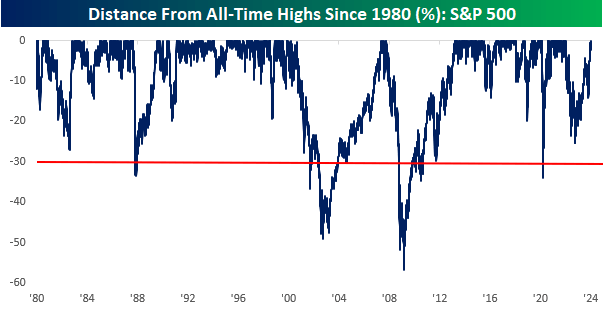
While the Russell 2000 lost as much as a third of its value during the most recent bear market, the S&P 500’s drawdown was less severe at around 25%.
While the S&P 500 also fell over 30% during the Covid crash, declines of 30%+ from an ATH have been much less frequent, which makes sense as you would expect more established companies to have less volatility.
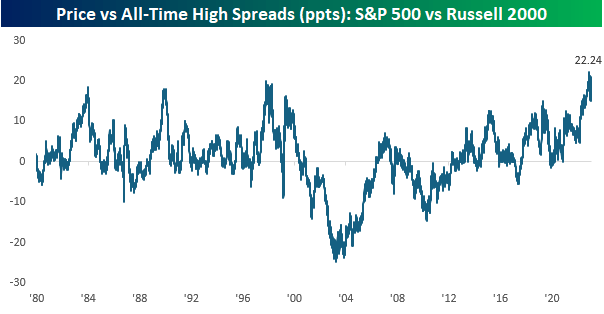
The fact that the S&P 500 hit an ATH even as the Russell 2000 remains down over 20% from its record high has created what is an unusually large disparity between the gaps over where they’re currently trading relative to their ATHs.
In the history of the two indices, there has never been another time where the S&P 500 was at an ATH while the Russell was still down at least 20%, and there is only one other period (October 1998) where more than 20 percentage points separated where the S&P 500 was trading relative to an ATH versus where the Russell 2000 was trading.
The current period, where the gap widened to more than 20 percentage points (ppts), is extreme. When you pull a rubber band, you never know exactly when it’s going to snap, but you can always tell when it’s getting close enough that you don’t want to be pulling on it anymore.
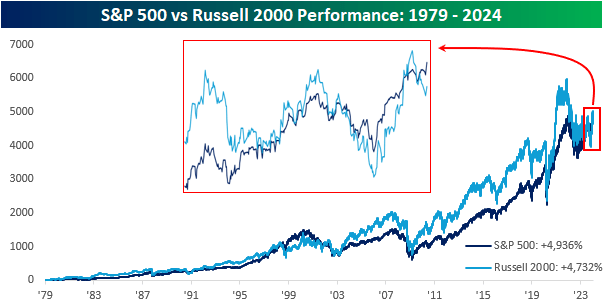
What’s interesting to note about all the debate throughout the years concerning small versus large caps is that since the Russell 2000’s inception starting in 1979, its cumulative performance (not including dividends) has been a gain of 4,732%, which works out to 9.0% annualized.
Over that same period, the S&P 500 has rallied 4,936%, which works out to 9.1% annualized. That’s a difference of just 10 basis points annualized.
Large caps currently have the long-term lead over small caps, but the lead has shifted at multiple points over time.
In just the last year, for example, the lead on a cumulative basis has changed eleven times, with the most recent change occurring less than three weeks ago.
Editor’s Note: The summary bullets for this article were chosen by Seeking Alpha editors.


