Douglas Rissing
Jobs market is cooling, not collapsing
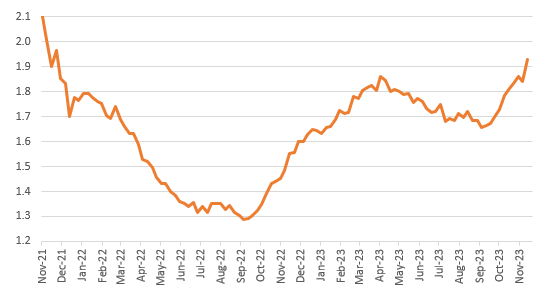
We have had quite a lot of US data today, starting with initial jobless claims, which rose to 218k last week, from an upwardly revised 211k (initially reported as 209k). Continuing claims surged though to 1927k, up from 1841k. There have been questions over seasonal adjustment issues and data volatility, but the trend is certainly towards higher continuing claims while initial claims remain low. Essentially, the message is that firms are reluctant to fire workers, but they are less inclined to hire new workers. i.e. more evidence of a cooling, but not collapsing, labour market. This was also the message within yesterday’s Federal Reserve Beige Book, which reported that “most Districts reported flat to modest increases in overall employment”.
Continuing jobless claims (millions)
Macrobond, ING
Inflation pressures are moderating more broadly
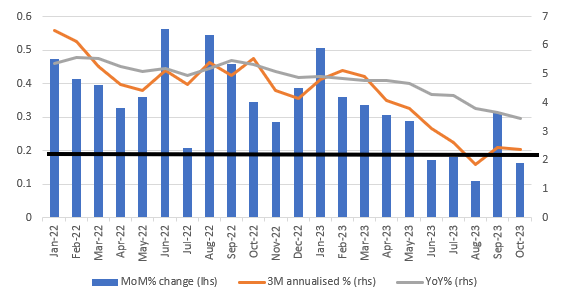
Meanwhile, the October personal income and spending report shows incomes rose 0.2% month-on-month, with spending in nominal and real terms also up 0.2% on the month. The Core PCE deflator also rose 0.2% MoM (0.163% to 3dp), which means the annual rate of core inflation slowed to 3.5% from 3.7%, as expected. The chart below shows the core inflation rate under different metrics, but the key story is that the MoM change in the core deflator is back below the black line, which, if repeated consistently over time, is what would get us back to the 2% year-on-year target. Importantly, the so-called supercore measure – core services ex-housing – slowed to 0.148% MoM having risen by 0.447% in September. This is important because it reflects more inflation pressures in sectors that are more exposed to any labour market tightness – something the Fed hawks are keeping a close eye on, so this should ease those concerns.
Core PCE deflator MoM, 3M annualised and YoY% change
Macrobond, ING
Spending is holding up, but the outlook is deteriorating
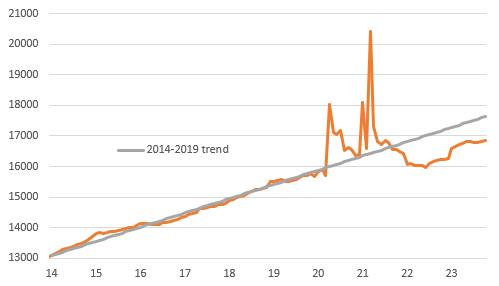
In terms of the activity side, the 0.2% MoM rise in real spending suggests we are on track for 2% annualised GDP growth in the fourth quarter. However, the weakness in real household disposable incomes, seen in the chart below, remains a key concern for growth in the early part of 2024. The data suggests stagnant real household incomes over quite some time now. So far, this has been offset by the running down of savings and the use of debt to fuel spending growth. However, tighter credit conditions and high borrowing costs are likely to weigh heavily on the flow of credit to the household sector, while there is growing evidence of pandemic-era accrued excess savings being exhausted for an increasing number of people. Credit card delinquencies are on the rise, while student loan repayments are only adding to the financial pressure on millions of households.
Real Household Disposable Income versus pre-pandemic trend ($bn)
Macrobond, ING
As such, we have modest growth and cooling inflation and a cooling labour market – exactly what the Fed wants to see. This should confirm no need for any advance Fed policy tightening, but the outlook is looking less and less favourable – note a majority of Federal Reserve districts report flat to lower activity in yesterday’s Beige Book – and we expect rate cuts from the Fed from the second quarter onwards. We are currently forecasting 150bp of rate cuts in 2024 with a advance 100bp in early 2025.
Content Disclaimer
This publication has been prepared by ING solely for information purposes irrespective of a particular user’s means, financial situation or investment objectives. The information does not constitute investment recommendation, and nor is it investment, legal or tax advice or an offer or solicitation to purchase or sell any financial instrument. Read more


