Khanchit Khirisutchalual
A Quick Take On Insperity
Insperity, Inc. (NYSE:NSP) provides a range of outsourced HR and human capital management services to small and medium businesses (“SMBs”).
I previously wrote about NSP in September 2023 with a Hold outlook due to substantial healthcare cost increases that it needed to pass through to clients.
Management says it is having success doing so and is paying close attention to negotiations with healthcare providers.
Although early 2024 may show some softness in net hiring, the firm is expecting more robust activity as 2024 progresses, so my outlook on NSP for patient investors is a Buy.
Insperity Overview And Market
Texas-based Insperity was originally founded in 1986 to provide small and medium-sized businesses with a menu of outsourced human resources and related human capital management business services.
The firm is led by co-founder, Chairman and Chief Executive Officer Paul Sarvadi, who has served as the president of the National Association of Professional Employer Organizations.
Insperity’s main offerings include the following:
-
Consulting
-
Benefits Administration
-
Payroll Services
-
Employee Training
-
Recruiting and Staffing
-
Technology Solutions.
NSP seeks new customers via its direct sales and marketing activities and through partner referrals and online marketing.
Per a 2023 market research report by Grand View Research, the global market for human resource management was estimated at $21.7 billion in 2022 and is forecast to reach $56.5 billion by 2030.
This represents a forecast CAGR (Compound Annual Growth Rate) of 12.7% from 2022 to 2030.
The primary reasons for this forecasted growth are the growing use of automated and digitized HR operations to improve operational efficiencies and increase flexibility in various economic environments.
The chart below illustrates the estimated growth trajectory of the U.S. human resource management market through 2030:
Grand View Research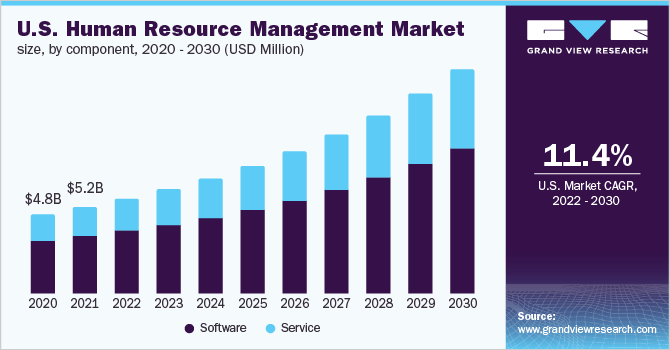
Major competitive or other industry participants include:
-
Paychex
-
TriNet
-
Accenture
-
ADP
-
Cezanne HR
-
Ceridian HCM
-
Kronos
-
Mercer
-
PwC
-
Cegid
-
UKG
-
Workday.
Insperity’s Recent Financial Trends
Total revenue by quarter (blue columns) has continued to grow moderately, however, the company faces ongoing hiring challenges in the technology vertical; Operating income by quarter (red line) has fluctuated within a range recently.
Seeking Alpha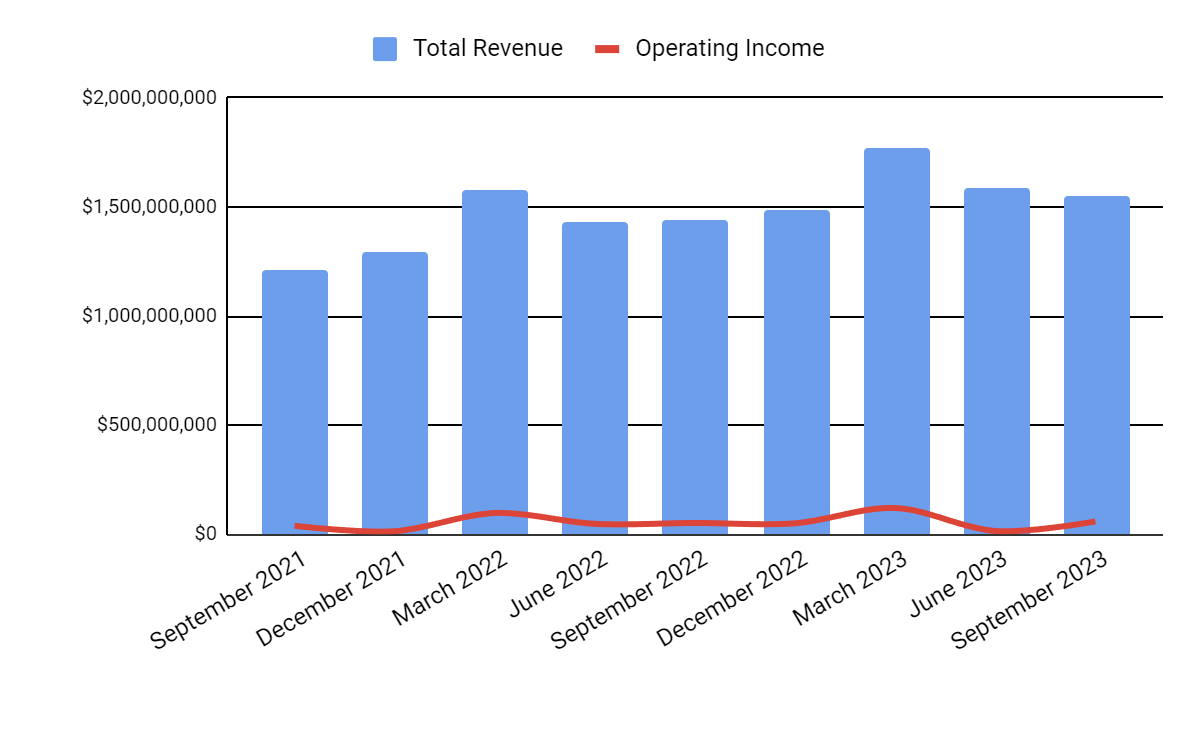
Gross profit margin by quarter (green line) has stabilized at 17% in the most recent quarter due in part to a reduction in large health claim costs; Selling and G&A expenses as a percentage of total revenue by quarter (amber line) have remained largely unchanged.
Seeking Alpha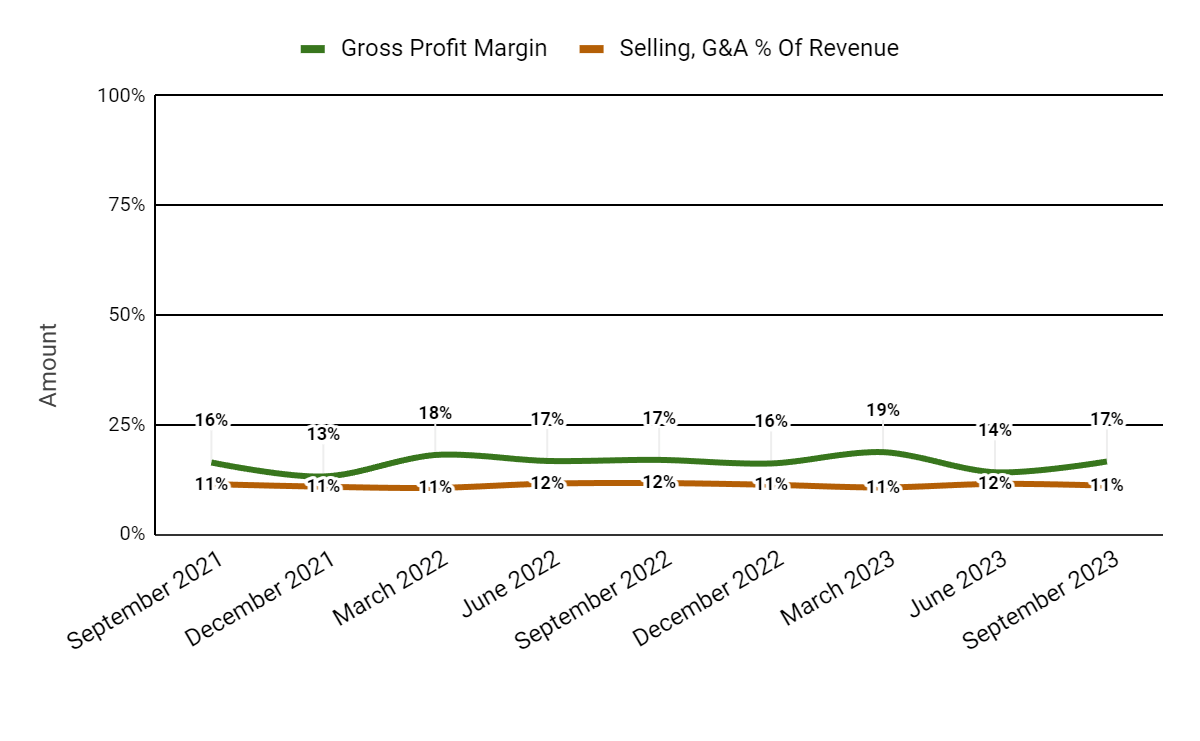
Earnings per share (Diluted) have been volatile in recent quarters because of highly variable health claim costs and declining net hiring until Q3.
Seeking Alpha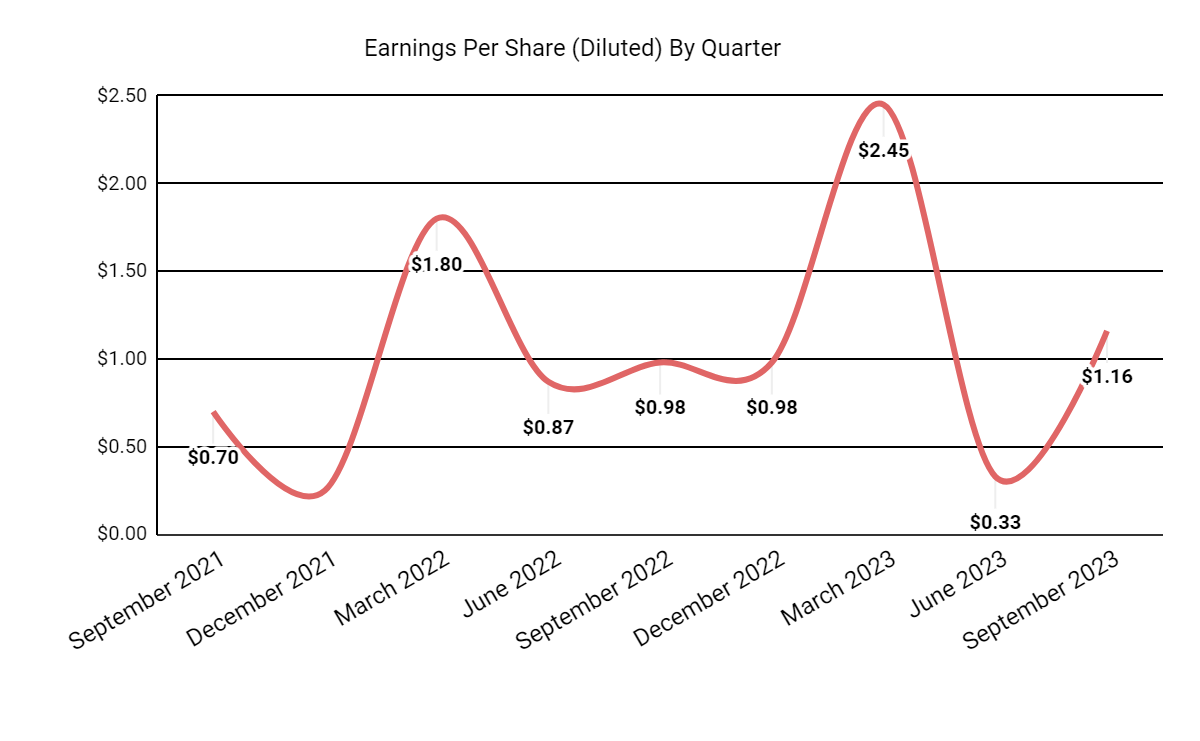
(All data in the above charts is GAAP.)
In the past 12 months, NSP’s stock price has gained only 4.12% vs. that of TriNet Group’s (TNET) rise of 82.83%:
Seeking Alpha
For balance sheet results, the firm ended the quarter with $692.4 million in cash, equivalents and short-term investments and $369.4 million in total debt, all of which was categorized as long-term.
Over the trailing twelve months, free cash flow was an impressive $329.5 million, during which capital expenditures were $36.4 million. The company paid $52.9 million in stock-based compensation in the last four quarters.
Valuation And Other Metrics For Insperity
Below is a table of relevant capitalization and valuation figures for the company:
|
Measure (Trailing Twelve Months) |
Amount |
|
Enterprise Value / Sales |
0.6 |
|
Enterprise Value / EBITDA |
14.8 |
|
Price / Sales |
0.7 |
|
Revenue Growth Rate |
11.4% |
|
Net Income Margin |
3.0% |
|
EBITDA % |
4.3% |
|
Market Capitalization |
$4,370,000,000 |
|
Enterprise Value |
$4,100,000,000 |
|
Operating Cash Flow |
$365,930,000 |
|
Earnings Per Share (Fully Diluted) |
$4.92 |
|
2024 FWD EPS Estimate |
$5.73 |
|
Free Cash Flow Per Share |
$8.68 |
|
SA Quant Score |
Buy – 4.30 |
(Source – Seeking Alpha.)
As a reference, a relevant partial public comparable would be TriNet:
|
Metric (Trailing Twelve Months) |
TriNet |
Insperity |
Variance |
|
Enterprise Value / Sales |
1.4 |
0.6 |
-53.6% |
|
Enterprise Value / EBITDA |
12.7 |
14.8 |
16.5% |
|
Revenue Growth Rate |
0.25 |
11.4% |
-54.4% |
|
Net Income Margin |
7.3% |
3.0% |
-59.1% |
|
Operating Cash Flow |
$443,000,000 |
$365,930,000 |
-17.4% |
(Source – Seeking Alpha.)
For a full comparison of all financial metrics between TriNet and Insperity on Seeking Alpha, click here.
Commentary On Insperity
In its most recent earnings call (Source – Seeking Alpha), management’s prepared remarks highlighted rebounding unit growth driving adjusted EBITDA and EPS growth for Q3 2023.
Notably, client net hiring improved from a previous decline to flat sequentially.
Also, the firm saw lower large health claim costs while increasing its service capacity and utilization levels.
Management has also been able to adjust pricing while increasing efficiencies as it completed the company-wide implementation of the Salesforce CRM solution.
However, the company is seeing certain macroeconomic pressures, with clients indicating reduced pay increases, lower overtime pay and reduced client sales commissions.
Leadership expects to see pricing pressures from competitors but expects to compete on the breadth and depth of its service offerings and its premium service levels.
Analysts questioned the leadership about cost trends, geographic trends and middle market activity.
Management said the firm is recovering from a period of unusual claims severity and frequency and is paying close attention to pricing alignment in negotiations with insurance carriers and pharmacies.
Geographic trends are particularly notable in the professional and technical industries in the West Coast and Northeast regions, with the broadening impact of macroeconomic elements on various compensation aspects in these regions.
Leadership said that it is seeing ongoing development in middle market demand and will continue to grow its currently “smaller” team to pursue these opportunities.
For the quarter’s results, total revenue rose 7.8% YoY while gross profit margin fell by 0.4%.
Selling and G&A expenses as a percentage of revenue dropped by 0.6% year-over-year, and operating income increased by 13.1%.
The company’s financial position is strong, with plenty of liquidity, some long-term debt but very strong free cash flow generation.
The client retention rate was 99% for Q3, and leadership has been focused on its fall sales and retention campaign.
Looking ahead, 2023 is expected to finish with 9.3% topline revenue growth over 2022.
If achieved, this would represent a decline in revenue growth rate versus 2022’s growth rate of 19.42% over 2021.
In the past twelve months, the firm’s EV/EBITDA valuation multiple has fallen by 13.%, as the chart from Seeking Alpha shows below:
Seeking Alpha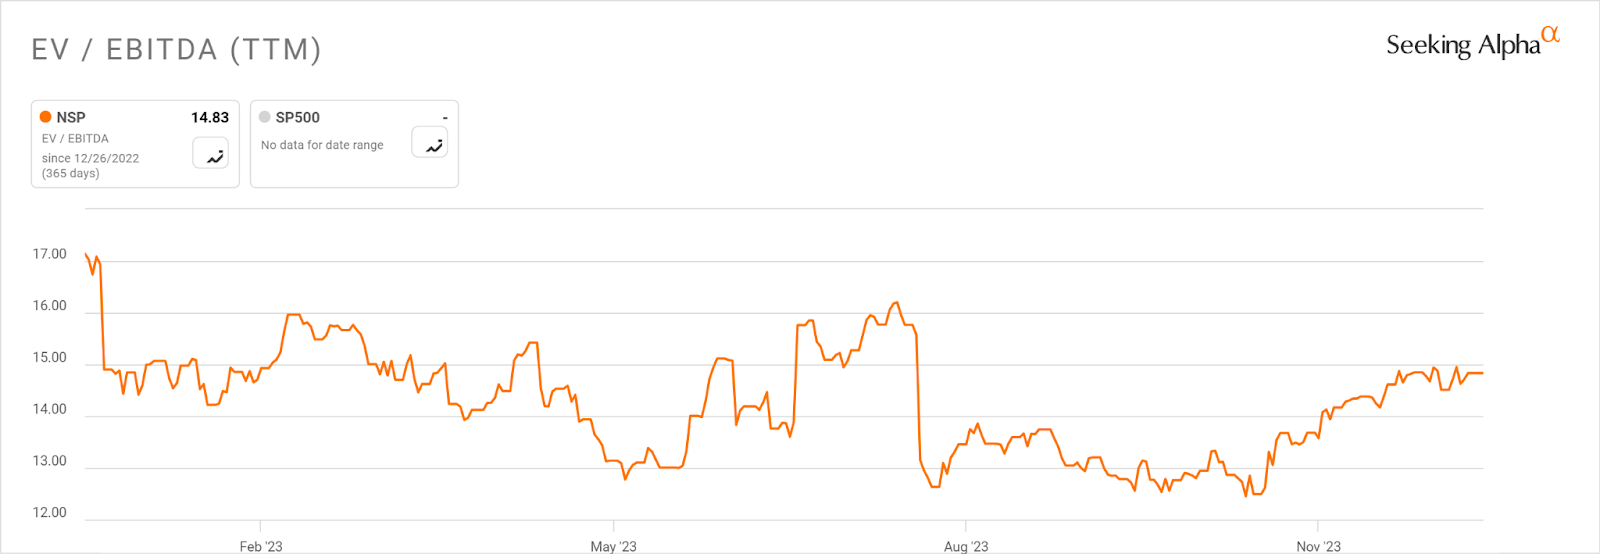
A potential upside catalyst to the stock could include a combination of stabilizing net hiring in the important technology sector and reduced cost of capital assumptions lowering downward valuation pressures on the stock.
While the first part of 2024 may see some net hiring softness based on the company’s survey data and transaction data, the second half of the year looks to be stronger.
For investors with a patient hold timeframe, my outlook on Insperity, Inc. shares is a Buy.

 Q2 2024 Earnings Call Transcript")

