TommL
The Company
Costco Wholesale Corporation (NASDAQ:COST) is a $300 billion market cap firm operating membership warehouses worldwide, selling diverse products. Established in 1976, it offers branded and private-label items across various categories, including groceries, electronics, and apparel. As of the latest data the firm employs over 316,000 employees worldwide, operating 870 warehouses (68.9% in the U.S.). Despite these strong ties to the US market, the company is actively expanding internationally, with growth in this segment amounting to 16.3% in 1Q FY2024 and its share of total sales rising by 121 basis points to 13.95%.
COST’s 10-Q, author’s notes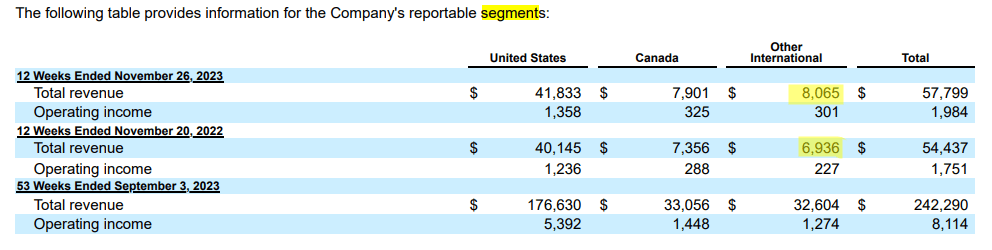
Overall, Q1 FY2024 was a strong quarter for COST. Net sales increased by 6.1% YoY to $56.72 billion; comparable sales in the U.S., Canada, and other international markets showed positive trends.
COST’s IR materials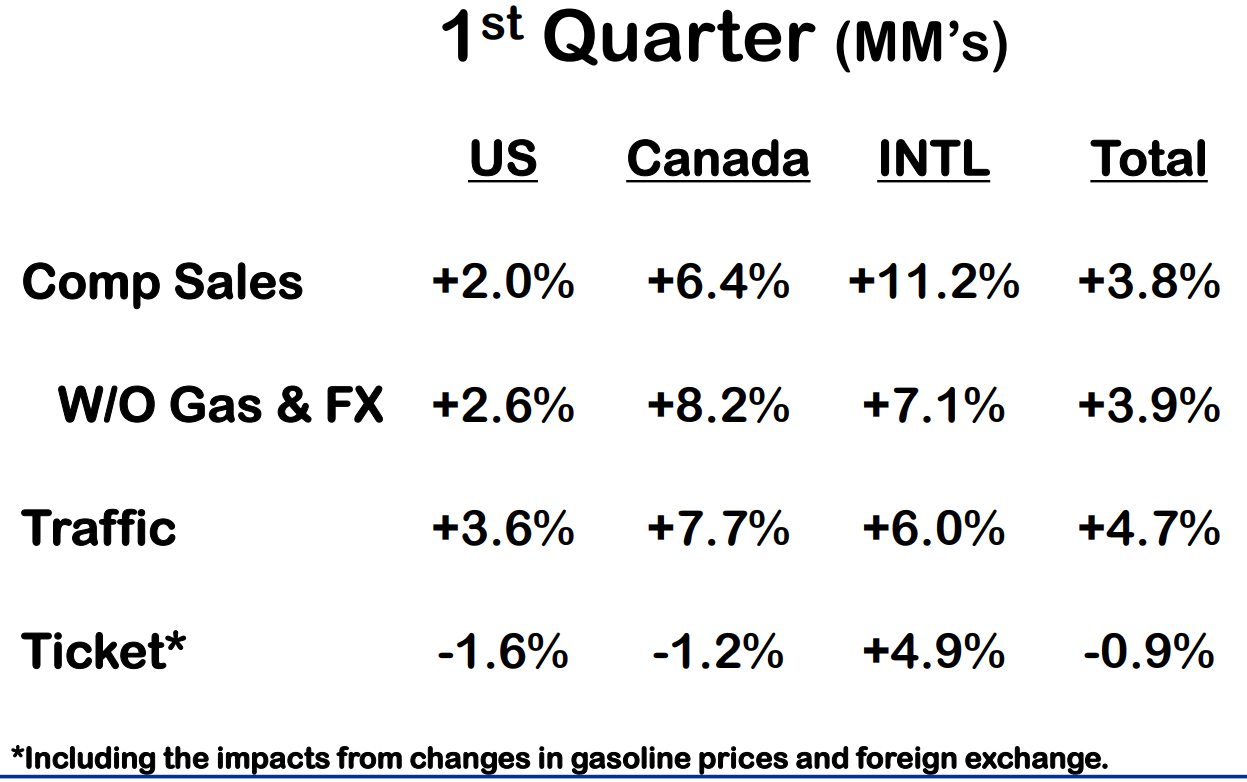
Membership fee income increased to $1.082 billion [+8% YoY], and membership growth continued:
COST’s 10-Q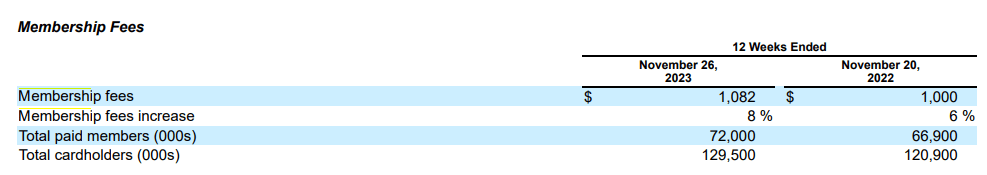
This revenue stream adds stability to earnings, which stands out in the volatile retail sector. This type of revenue helps the company maintain a relatively high growth rate of the bottom line. COST’s net income for the 12 weeks ending November 26 was $1.589 billion, up from $1.364 billion in the same quarter last year, thanks to rising gross margin. Costco bought back ~288,000 shares [$162 million] during the quarter, which signified a positive impact on EPS:
COST’s IR materials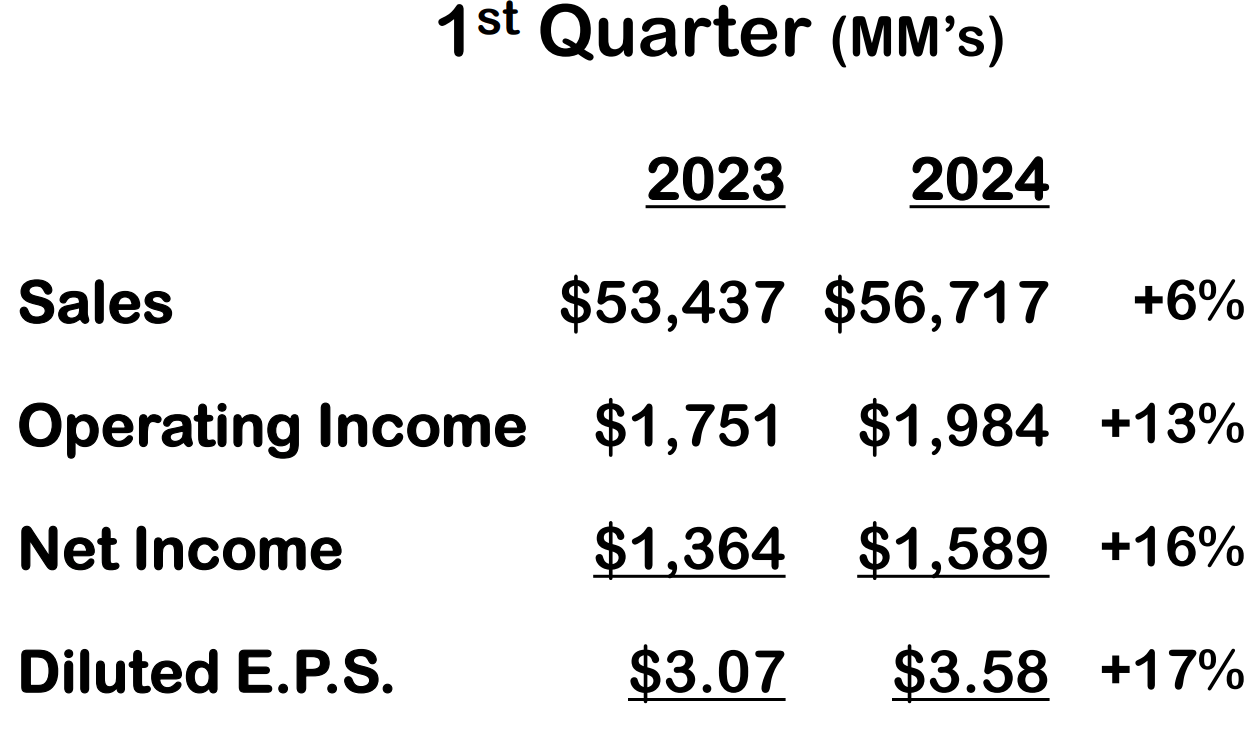
Overall, I like the company’s approach to its operational growth. As the CEO said at the last earnings call, the company is committed to being the first to lower prices, and even though inflation is coming down slightly, the company remains focused on providing value to customers. It’s much easier for consumers to pay a subscription for that ‘value’ that smoothes out COST’s bottom line, even in the toughest of times for the industry. But at the same time, this approach doesn’t give the company the margin that competitors without a similar revenue structure enjoy. And as history shows, COST has proven to be a much more successful player in this area.
YCharts, author’s notes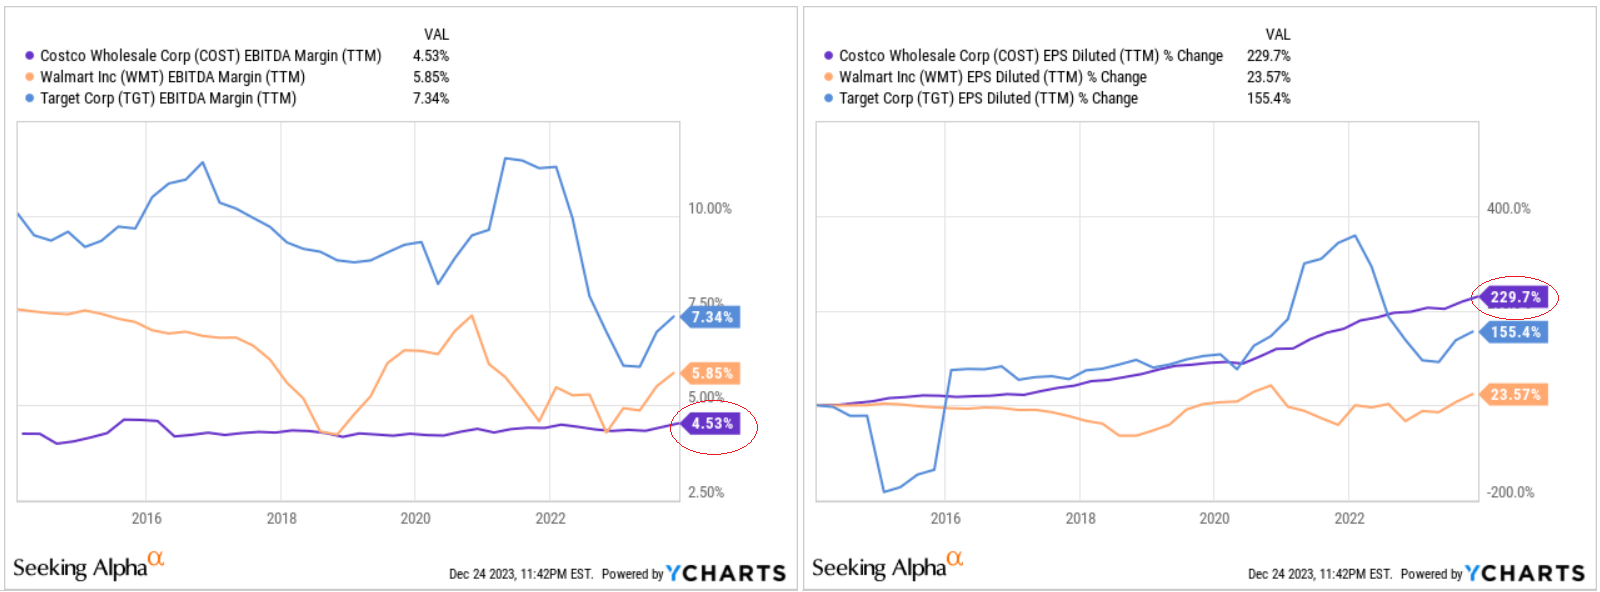
However, it cannot be said that COST’s margins are suffering greatly in terms of their momentum. Quite the opposite: in the last 12 months, Costco’s EBIT margin has increased by 300 to 400 basis points compared to pre-pandemic levels. The company emphasized that it is focused on growing sales and that maintaining or increasing its operating margin depends on sustained sales growth in the mid-single digits or better. And that is entirely possible according to Wall Street forecasts:
Seeking Alpha, COST’s Revenue expectations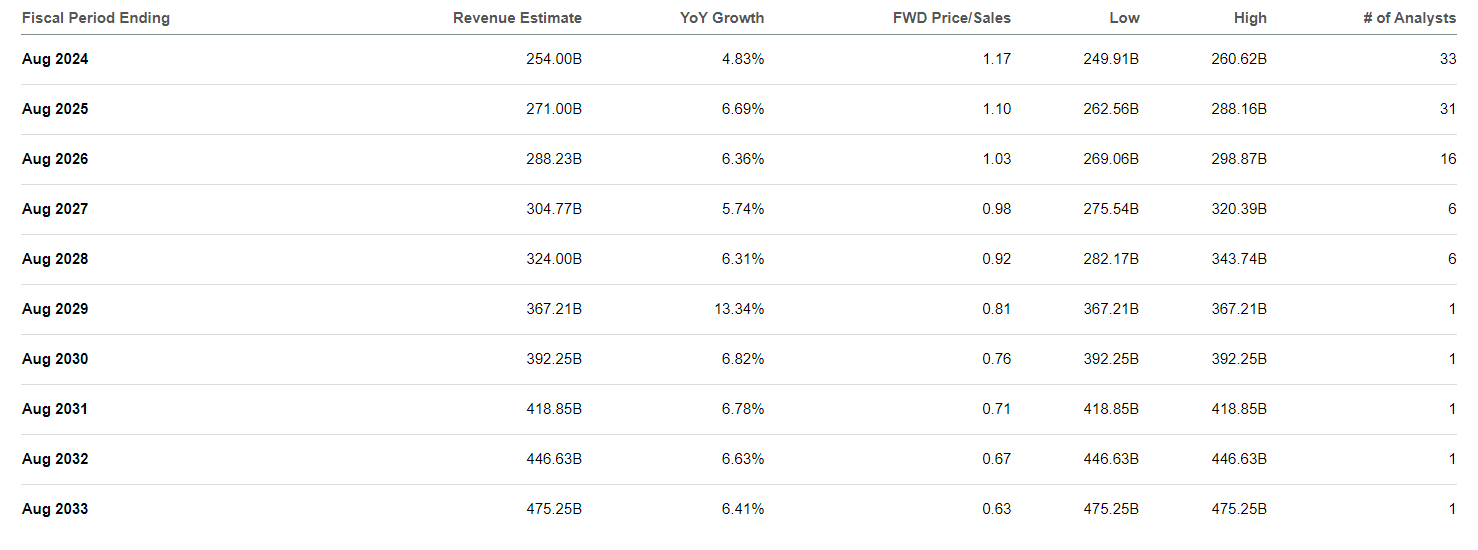
I forgot to mention that the company’s balance sheet is looking better and better: The current ratio has exceeded 1 again, the quick ratio is at >0.5, and the company’s debt-to-equity ratio of 0.026 represents no additional credit risk.
YCharts, author’s notes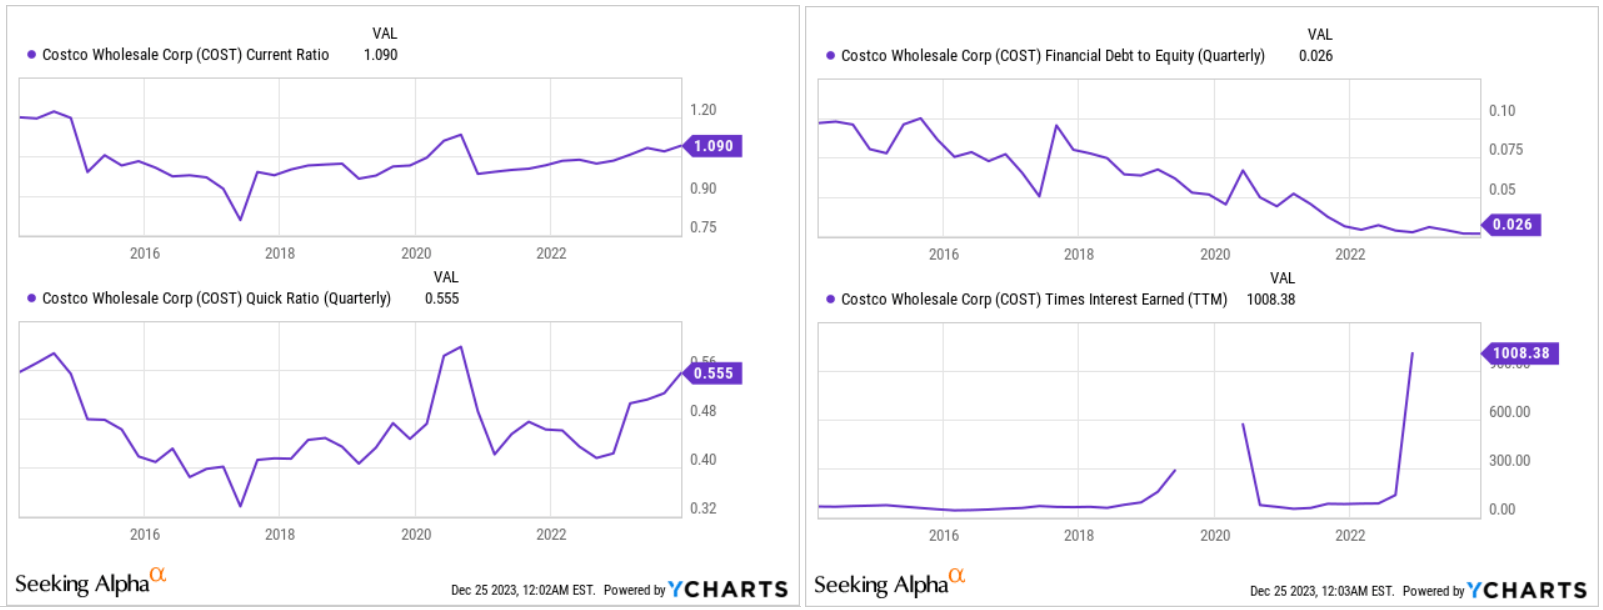
So overall, I like the way the company has reported on the first quarter of the 2024 financial year: From an operational and financial perspective, Costco looks like the safest bet for any long-term investor.
Aside from buybacks, COST pays a modest dividend and sometimes declares special dividends, as it did last time, declaring a $15 per share special cash dividend. This is their 5th special dividend in 11 years. The total payout will be ~$6.7 billion and will be funded using existing cash and not accompanied by any issuance of debt. Taking into account the forecast dividend for FY2024, the combined dividend yield should be ~4.03%, according to my calculations, which is very good.
But what about the valuation of the company and does it make sense to buy COST shares after the ~48% YTD rise?
Understanding Costco’s Valuation
As another SA analyst, Lyn Alden, noted in her recent tweet, after the special dividend announcement COST’s P/E ratio is now bigger than NVIDIA’s (NVDA) equivalent ratio:
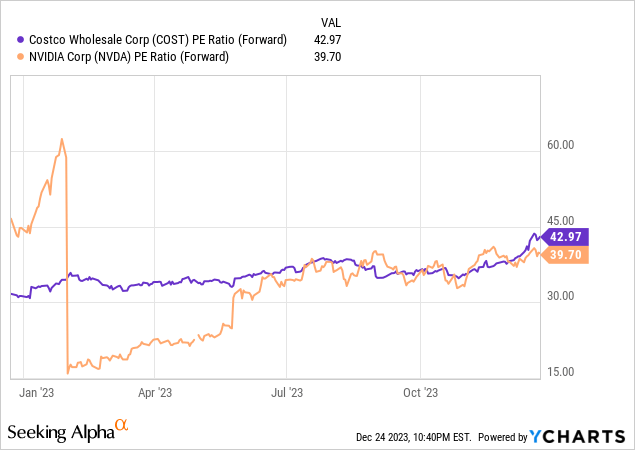
Lyn’s FAST graphs indicate that the COST share price is greatly overvalued given projected EPS growth rates:
FAST graphs, COST stock [Lyn Alden on X]![FAST graphs, COST stock [Lyn Alden on X]](https://topnews.media/wp-content/uploads/2023/12/49513514-17034816252026427.png)
The market’s assessment of COST’s current share price looks rather strange compared to other, faster-growing technology (and not only) companies. But let’s look at what should theoretically determine ‘fair’ value – free cash flows. According to YCharts data, COST’s FCF grew rapidly in the first quarter, taking its TTM figure to over $8.8 billion. This growth has meant that COST’s FCF yield [2.95%] is actually above the historical [10-year average] norm of 2.89%, indicating not overvaluation but undervaluation, albeit only slightly.
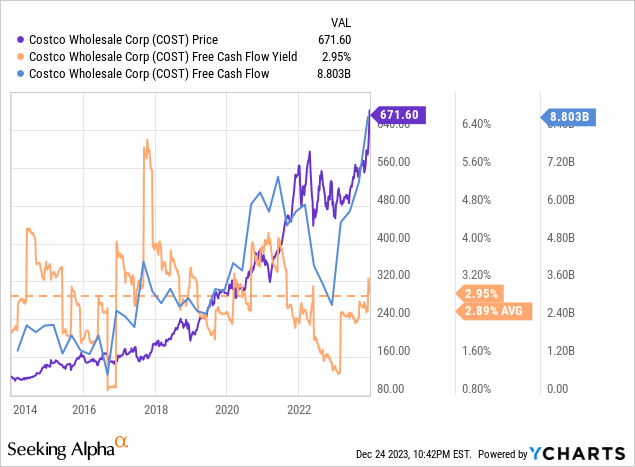
In my opinion, the most important question investors should be concerned with is how sustainable this FCF is. Historically, we are near all-time highs in both FCF as a percentage of sales and FCF-to-EBIT, which means we are very likely near all-time highs in these metrics, as I think Costco is unlikely to be able to earn more than 80% of FCF on its operating profit.
Excel, author’s calculations [Seeking Alpha data]![Excel, author's calculations [Seeking Alpha data]](https://static.seekingalpha.com/uploads/2023/12/25/49513514-17034824674926243_origin.png)
Wall Street estimates today tell us that COST’s turnover will grow by 6.46% over the next 10 years. Let’s assume that this is true. EBIT margins have been trending up in recent years, as we can see from Seeking Alpha’s data:
Excel, author’s calculations [Seeking Alpha data]![Excel, author's calculations [Seeking Alpha data]](https://static.seekingalpha.com/uploads/2023/12/25/49513514-17034830442422523_origin.png)
So here’s what my summary assumptions look like:
Excel, author’s calculations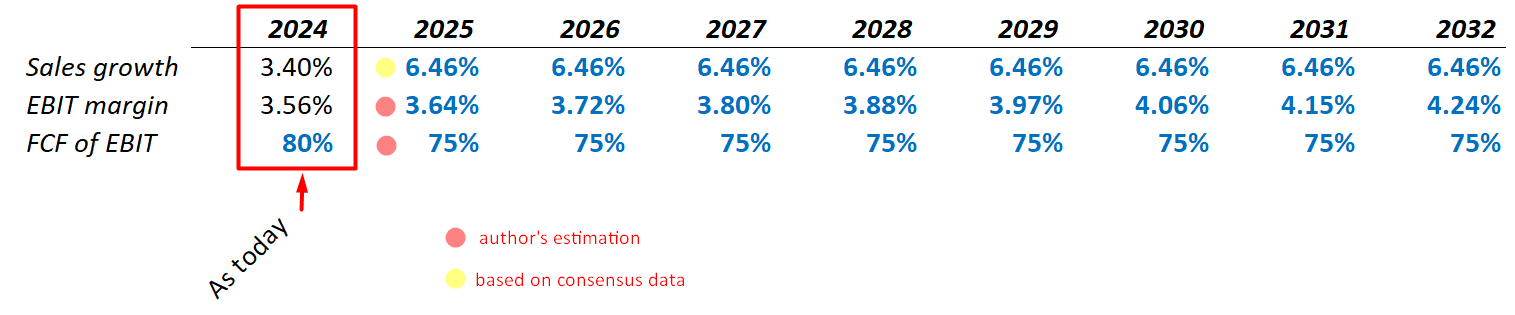
And here’s the resulting output:
Excel, author’s calculations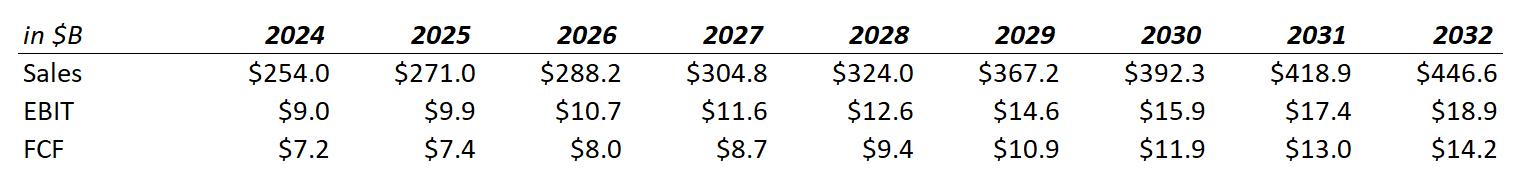
According to ValueInvesting.io, COST’s WACC is 7.9%, which is probably pretty close to the truth, but I want to play it safe and add a small premium to this figure; my WACC will be 8.2%.
I will use an exit multiple to calculate the terminal value, using P/FCF as the main metric. It is interesting to note that the current multiple of 33.9x is at the lower end of the multi-year range. That is, unlike the P/E ratio where COST trades above NVDA, P/FCF is a ratio where the company is actually highly undervalued in the context of its historical norm.
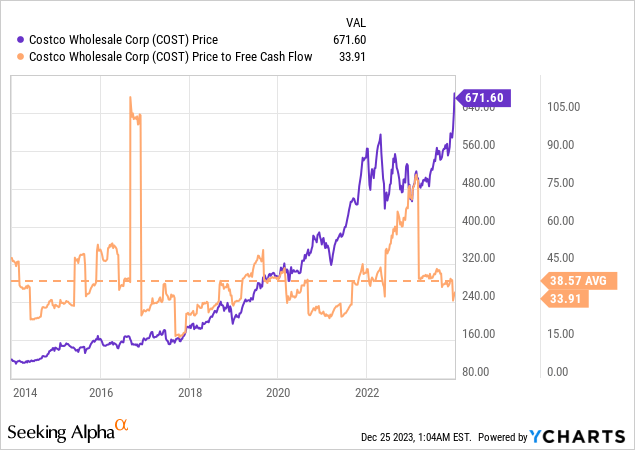
In any case, I assume that 30x is COST’s fair exit multiple here.
As a result of all the above calculations, my model says COST is only slightly overvalued – not in the way its P/E and EV/EBITDA multiples scream.
Excel, author’s calculations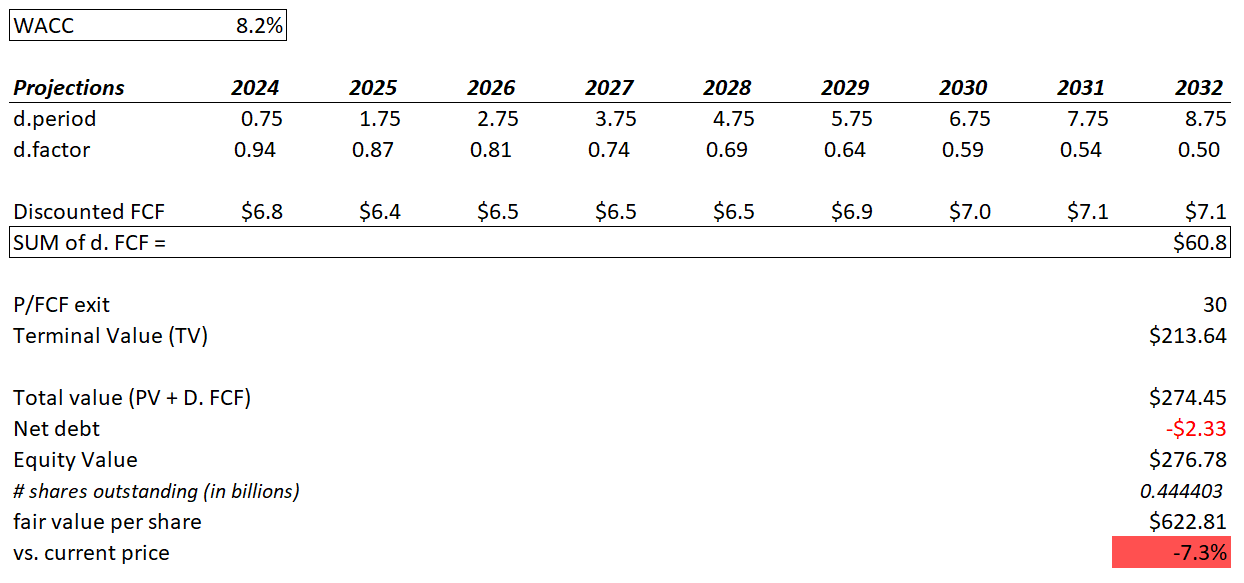
My rather simple DCF model proved to be less sensitive to the most important assumptions, which indirectly indicates its tolerable quality. In a sensitivity analysis of WACC and P/FCF, we see that COST could even be strongly undervalued today if we assume a WACC of below 6.5% and a P/FCF of above 33x (which roughly corresponds to today’s TTM multiple).
Excel, author’s calculations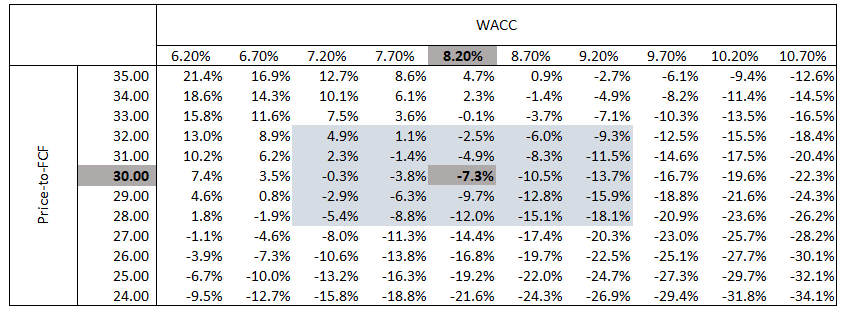
The Bottom Line
The main conclusion I have come to in my analysis today is that due to the peculiarities of its business model and how well the business is run, Costco stock is actually not as overvalued as many investors may think.
The company is not without risks. It is in a low-margin business, and its execution must be close to perfect. In addition to a growing presence from Amazon (AMZN), Walmart (WMT) is making improvements and offering a membership program for delivery.
Considering these risks and taking into account the conclusions of my model that the company is slightly overvalued, I rate Costco as a ‘Hold’ and recommend taking another look at the stock at its first serious drop below the ‘fair’ value I have calculated.
Thanks for reading!

 Q2 2024 Earnings Call Transcript")

