Marianna Massey/DigitalVision via Getty Images
Introduction
GEN Restaurant Group (GEN Korean BBQ) (NASDAQ:GENK) (and from here on, GEN) is an investment with a high potential for returns thanks to its potential to expand to over 250 restaurants, as per co-CEO David Kim’s beliefs. Even then, the bar is still relatively low for growth as it has few restaurants and each addition will be meaningful to both revenues and profitability. This comes at the risk of continued margin contraction and a highly risky economy due to a weakening consumer.
To begin, let’s see what happened to the company’s stock since its IPO.
Recapping Recent Moves
GEN was a recent IPO corporation that occurred after CAVA’s (CAVA) successful public debut. GEN went public with similar investor enthusiasm as the company’s stock had a 38% increase in share price on the first day. Shares rose to as high as $20 per share at its August peak but then declined thanks to its two subsequent quarterly earnings reports that likely tempered investor expectations.
Right now, it stands below $10 per share with some profitability on hand. Because of this, I’m more curious about the restaurant chain and what it can offer.
Company Profile
As the name suggests, GEN is a restaurant chain that offers Korean food. The restaurant concept looks to make restaurants with a much younger ambiance with louder Korean pop music playing in the background, a more high-end and modern aesthetic compared to other restaurant chains, and at the center of it all, allowing their customers to order the food raw and cook it however they want.
There are fewer cooks in GEN, which allows the company to save on those types of employees. Its restaurant concept engages in a buffet model as it allows for unlimited orders after paying the base price.
These two qualities allow the restaurants to offer food that’s ready to serve as fast as possible, which can be an advantage in itself as long as it can turn a profit. This depends on customers not eating as much.
While customer loyalty will later be proven with more quarters’ worth of results, they have a strong reputation with their customers as their restaurants are frequently rated 4 stars or higher in Google (GOOGL) user reviews. While these do have the risk of being bot and AI-generated, I will take that as a positive if accompanied by solid results later on.
Strengths
GEN has already shown some strengths in the market. Their concept appeals more to Gen Z and Millennials as the atmosphere created leans younger and more vibrant. Their serving speed and quality food allow them to convince other consumers with their tastes that GEN is a good restaurant to get some Korean BBQ. The more personal aspect of unlimited orders and being able to cook them to the level desired by consumers allow the company more financial flexibility per restaurant as it would have to pay less workers.
This has been reflected in their performance, which has shown revenue growth from 2019 pre-pandemic to 2023, with current results supporting $180 million in expected revenue for fiscal year 2023.
Seeking Alpha

GEN also has debt below $6 million according to their Q3 2023 10-Q filing. This opens a decent opportunity for liquidity as it boasts a modest $35 million in equity and shows that the company is financially healthy.
Its profitability is also a positive, as shown in its income statement for Q3.
GENK Q3 2023 10-Q filing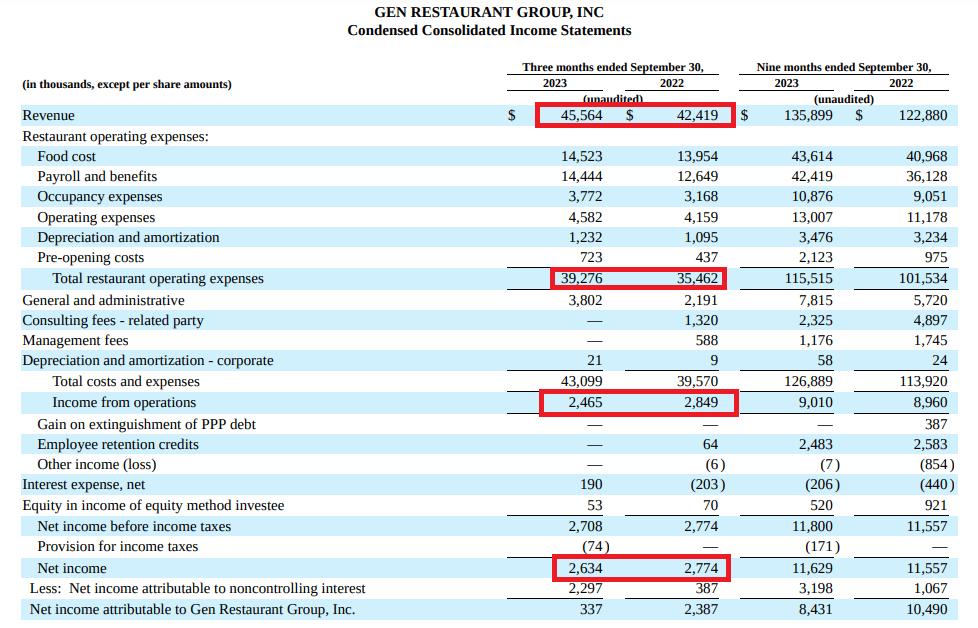
However, that’s all of GEN’s strengths for this article. There’s a reason why the company’s share price more than halved over a quarter year, right?
Weaknesses
As shown previously, fundamentals aren’t perfect. To highlight this more succinctly, here’s a quarter-over-quarter comparison of the highlighted factors:
| Q3 2023 | Q2 2022 | Change $ | |
| Revenue | $45.6M | $42.4M | $3.2M |
| Operating expenses | $39.3M | $35.5M | $3.8M |
| Operating income | $2.47M | $2.85M | -$0.38M |
| Net income | $2.63M | $2.77M | -$0.14M |
What the table above presents is some weakness in their operating expenses against their revenues. Margins have gone under pressure mainly as a result of higher restaurant expenses than revenues.
Since growth in expenses is attributed to expansion efforts, it’s worth comparing the numbers on a larger scale – 9 months over 9 months, this time.
| 9mo 2023 | 9mo 2022 | Change % | |
| Food Costs | $43.6M | $41.0M | 6.3% |
| Payroll and Benefits | $42.4M | $36.1M | 17.5% |
| Occupancy Expenses | $10.9M | $9.0M | 21.1% |
| Operating Expenses | $13.0M | $11.2M | 16.1% |
| Depreciation and Amortization | $3.48M | $3.23M | 7.7% |
| Pre-Opening Costs | $2.12M | $0.98M | 135.6% |
As far as 2023 is concerned, there have been 4 restaurant openings to take the total amount to 35 this year. That is a 9.68% increase, which can be used to compare whether the increase in costs can be attributed to more restaurants in operation or cost inflation.
Food had lower cost increases thanks to the added scale of GEN’s supply chain. Investors will not see drastic increases in depreciation and amortization until after each opening, hence why it’s only 7.7%.
Opening costs are significantly higher, however, it can be as much attributed to a higher budget as well as more restaurants being added per year. It’s not the same to open 2 restaurants in a year than to open 4 of them the year after, which is a 100% increase.
The last three expenses – payroll, occupancy, and operating – have seen a higher increase than what would be reasonable, especially for occupancy expenses. Payroll expenses can be attributed to general wage inflation and not California’s fast food wage increase bill.
Occupancy expenses can consist of rent, property taxes, insurance, and common maintenance fees that can include janitorial services and parking lot maintenance depending on the locations. Increases vary in different circumstances and can have their own labor increases if certain services are not treated as part of the payroll.
Operating expenses refer to other expenses in the restaurant and are not the same as general and administrative expenses, which are attributed to the corporate side.
Whatever the reason for the increases, it doesn’t remove the inefficiencies currently due to overall inflation. Scalability in its food supply system won’t carry the company alone. In order to best mitigate overall inflation, technological advances, for example, in other aspects of the restaurants would do best to mitigate runaway occupancy and operating expenses. Further streamlining the restaurant experience to require less workers can also help lower payroll costs and potentially give the company more flexibility to raise their wages.
Over the long term, the company will have to rethink its business model should margin weakness continue, as these could threaten the company’s existence.
Opportunities
Being a restaurant chain with only 34 restaurants allows for each restaurant opening to be a meaningful addition to the company overall. The prospect of reaching new markets within the nation brings new opportunities for additional brand recognition and fame across the country. Their success in California already gives GEN a preview of such success on a smaller scale, and now they are aiming to expand in the United States.
During GEN’s Q2 2023 earnings call, David Kim pointed out that with the wide market available, GEN will be able to serve guests with more than 250 restaurants, which is over 7 times the amount of restaurants available in the present. Should the company execute its expansion well, it is possible to see significant revenue increases, and profitability will follow along if the above-mentioned margin weaknesses cool down.
Being the largest restaurant chain offering Korean BBQ also opens the possibility of gaining viral success if its concept resonates more strongly with consumers, or a change in consumer behavior thanks to external factors such as organic influencer marketing (which I define as highly influential people in social media promoting the company without the company having approached them previously for such a partnership), word-of-mouth advertising, among other methods consumers use to spread the word of a perceived “excellent” experience.
Threats
Overall inflation can still threaten the company as consumers lose their purchasing power and the company will have a limited ability to increase their prices. This happens because GEN is a smaller restaurant chain with less recognition, which can hinder the company’s ability to raise prices further as a “brand premium” that consumers would be willing to pay. To support this, previous earnings calls have only mentioned modest price increases, which also explains why revenues have been trailing. The better news is that revenues will increase with the amount of customers visiting their restaurants, but it is still threatening the business from a margin standpoint.
Additionally, California’s fast food bill is one step that can contribute to overall cost inflation. Due to GEN not being a “limited-service restaurant,” the fast food bill’s minimum wage will not apply to the company. Should there be another bill that targets the previously unaffected population of restaurants, GEN will be forced to increase their operating efficiencies to stop the wage-inflation spiral (where wages increase, then companies increase prices in return, but then wages have to increase again to keep up). This will certainly challenge the company in the short term but can provide a long-term advantage if they manage to do so.
Additionally, consumer spending has been growing weaker as regular people’s savings run out and are forced to use debt to finance their situation. US savings are still low, which supports the aforementioned reality. The only thing that can help GEN is a secular boost in consumer spending for restaurants, and this would otherwise be linked to a change in consumer behavior, not improving macroeconomic factors. Higher unemployment accompanied by a recession can also threaten the company as well, as both are usually accompanied by lower consumer spending as regular people resort to paying exclusively for what’s necessary to live, or in some cases even have to decide between food and gas, among other necessities.
Valuation
To begin, what methods are relevant here for valuation?
- Revenue & revenue expectations
- Free cash flow (OCF – PPE as capex)
- EPS & EPS expectations
- Margins
- Equity
I will try to estimate revenue, EPS, and margins for 2023, 2024, and 2025, utilize current free cash flows as well as determine a “backed valuation” through equity. Results and expectations for the current year will take priority over expectations for 2024 and 2025 for valuation purposes.
For free cash flow, it is worth looking at the investing activities section of their cash flow statement to determine what counts as capital expenditures (CapEx) as the equation for free cash flow used will be as follows:
- Free cash flow = Operating Cash Flow – Capital Expenditures.
GENK Q3 2023 10-Q filing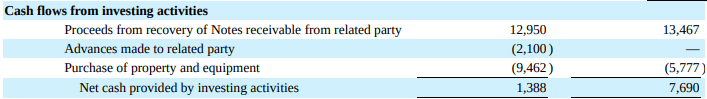
*First number column contains numbers for the 9 months of 2023 ended September 30, second column shows numbers for 2022 in the same period.
Based on the items shown, only “purchases of property and equipment” can count as capex as it is the only item listed in their investing activities that can be reasonably tied to their business.
Additionally, since only free cash flows for the last 9 months are available, I’ll use the average of the three quarters as a placeholder for the fourth quarter free cash flow. The same will apply for operating cash flows, which are $13.49 for the 9 months of 2023.
- Capex 9mo = $9.46M; Capex Q4 = 9.46/3; Capex Q4 = $3.15M
- Capex 2023 = 9.46+3.15 = $12.61M
- OCF Q4 = 13.49/3; OCF Q4 = $4.50M
- OCF 2023 = 13.49+4.50 = $17.99M
With that, here are the remaining numbers for free cash flow (fcf). Per share amounts are determined from adding class A shares (4.14 million) and class B shares (28.14 million) together (32.28 million).
| Operating Cash Flow 2023 | Capex 2023 | fcf Amount $ | Per Share |
| $17.99M | $12.61M | $5.38M | $0.17 |
Now, to determine margins. For the 9 months of each year, margins stand at:
| 2023 % | 2022 % | |
| Gross Margin | 15% | 17.37% |
| Operating Margin | 6.63% | 7.29% |
| Net Income Margin | 8.56% | 9.4% |
Gross margin considers restaurant expenses only, operating margin considers restaurant and administrative expenses and net income margin considers the net income shown in the income statement, which includes all expenses and gains.
I should also explain why net income appears larger than operating margins. That’s because GEN gained on employee retention credits and an item labeled “equity in income of equity method investee,” which pushed net income for the company higher. From what it seems, this is the income they obtained from an investment. It used the equity method, which determines their profits or losses based on its ownership interest. This will be a good thing to investigate later on to see what their investment is, or if it’s related to the notes recovered as shown in the previous image detailing their investing activities.
The decrease in gross margins looks larger than the decrease in operating and net income margins. That is the case indeed as comparatively, gross margins decreased by 13.7%, operating margins by 9.1%, and net margins by 9%.
With this and the potential for consumer weakness noted, modesty in one’s expectations will be necessary. I expect another 5% comparative decrease in net income margins for 2024 and margins being flat for 2025. For 2023, I’ll use $180 million as a reasonable base expectation since 2023 is mostly complete now, and use the same margins in the 9 months so far to determine net income for the year.
I expect revenue growth being tempered as consumers eat outside less, while helped by the addition of new restaurants, so I’ll expect a 3% growth rate for GEN in 2024. I expect at least 40 restaurants being open by 2025 and some recovery, so I’ll expect growth around 8% to be modest.
With these numbers in mind, here are my projections for future years:
| 2023 | 2024 | 2025 | |
| Revenue | $180M | $185.4M | $200.2M |
| Net Income Margins | 8.56% | 8.13% | 8.13% |
| Growth | 10% | 3% | 8% |
| Net Income | $15.41M | $15.07M | $16.28M |
| EPS | $0.48 | $0.47 | $0.50 |
With those numbers, all that’s left is to determine equity, which can be easily done by subtracting assets from liabilities or looking at stockholders’ equity near the bottom of the balance sheet.
- Equity: $35.01M; $1.08 per share
Currently, at Monday 18th’s closing price of $7.16, not much of the share price is backed by equity.
Now that we have these numbers, we can use them to determine a valuation.
Considering growth, it is worth using a standard net income and free cash flow ratio of 20 times to determine valuation. On a revenue standpoint, a rate of 3 times would be more reasonable. As the company is profitable, revenue will only consist of 16% of the valuation when combining each method. While only 2023 numbers will be used in this analysis, investors can use at their own risk my forward-looking numbers for their calculations. Some of the risks of doing so will be outlined at the end of the section.
For reference, total share count between class A and class B shares is 32.28 million.
| Amount | Ratio | Market Cap | Share Price | |
| Revenue | $180M | 3x | $540M | $16.72 |
| Net Income | $15.41M | 20x | $308.2M | $9.55 |
| Free Cash Flow | $5.38M | 20x | $107.6M | $3.33 |
Once weightings (Valuation * Weight) are added together…
| Revenue 16% | Net Income 42% | Free Cash Flow 42% | Market Cap | Share Price |
| $86.4M | $129.44M | $45.19M | $261.03M | $8.09 |
We have a fair share price of $8.09. At the moment, valuation for the company seems to be fair, and so there isn’t much expected upside from undervaluation.
However, there are some risks both to the upside and downside here. GENK is a rather volatile stock and has only been on a downward trend since August. Upside risk exists once selling pressure has been exhausted and more buyers accept the company’s current valuation. Additionally, my estimates are subjective and are based on my beliefs of what could happen in the future. They are not a guarantee and relying on them comes with the same risks as all forward-looking statements. Since past performance isn’t a guarantee of future results either, I can be wrong either on the downside or the upside, so due diligence is encouraged for all investors, as I could be underestimating or overestimating what 2024 may bear for us. Originally, the expectations for 2023 were for a recession, and so far, things have looked about as normal as they can get.
In the end, I suggest investors take estimates with some skepticism.
Financing Expectations
Currently, 10-year interest rates are around 4%, and due to the novelty of the business, one can reasonably expect an average of a 7% interest rate for new debt issued by the company with a 10-year maturity. Using equity and current profitability, the goal of this section is to see how much more capital can the company raise through debt without sinking into a deep debt hole. This is to understand how much life the company may have in the extreme case of needing to raise cash without diluting shareholders.
Currently, GEN has around $5.81 million in debt while they paid $284 thousand in interest during the last 9 months for an average of $94.67 thousand per quarter. Assuming an annual interest expense of $379 thousand, their debt averages around a 6.51% interest rate. My estimate for an average interest rate for future debt will be around 7%, which will be used for this estimate.
Currently, GEN’s stockholder equity is $35.01 million and their net profit for 2023 is expected to be $15.41 million.
Since they have a large load of cash ($32.149 million), it is also worth estimating how much that same cash would yield in interest as it has been bearing so far. Last quarter, their interest gain was $190 thousand, so their overall interest gain using the offset $94.67 thousand per quarter would be $284.67, or $1,138.68 per year. This would mean their cash currently yields an average of 3.5%.
This would mean that the real interest rate on the debt would be 3.5%, assuming the same interest applies to the extra funds.
To understand how much debt can the company take (disregarding equity), it is worth obtaining a multiple to apply to the net income, which is obtained by dividing 1 by the interest rate (0.07). The number we get is:
To prove that the equation works, we’ll now estimate the interest expense on the number we just got:
This means that the company can get $14.29 of debt for each dollar of net income in a year. The idea is to verify whether net income will be an issue for using the remaining equity of the company as the amount of money that can be financed. The idea is to avoid negative equity, estimate how much liquidity the company may be able to get from creditors and avoid having negative net income. Here’s how much debt can their current net income put in service for the company:
| Net income | Multiplier | Serviceable debt |
| $15.41M | 14.29 | $220.21M |
This means that based on their net income, they can service as much as $220.21 million in debt before going break even or negative. Since the company only has around $35.01 million in equity, the company can easily service such debt with a small impact to profitability. This does not take into account the extra funds earning interest, which can further boost the amount of debt serviceable on net income.
This means that the company would have around $35.01 + $32.15 = $67.16 million in liquidity before dire measures have to be taken to avoid bankruptcy, assuming that the company would use its entire liquidity.
Since the company is financially healthy, profitable, operating cash flow positive, and free cash flow positive, the company can easily handle its financing needs if not increase its cash stockpiles if management wishes to.
My Thoughts
Overall, the company looks healthy enough to invest in. The main risk lies in macroeconomics affecting revenues and profitability as well as investor sentiment dragging the company’s stock price down. Since the share price refused to go below $7 for good and traded within a narrow range close to share price since November 16, there may be a temporary bottom where investors can jump in should they see an opportunity. GEN trades slightly below fair price, but since the company was listed less than 8 months ago, it is possible for further downside to come as can happen with freshly-listed companies.
Additionally, a sharp decrease by 62.5% from the peak can open the company stock up to volatility, which can further exacerbate gains and losses depending on the direction share prices go. My strategy would be to invest cautiously until more data comes out that can give me more security that this company can become a success on its own. For these reasons, I rate the company a Hold (within SA Quant’s scoring spectrum, a 3.00) with a target price of $8 per share based on previous calculations.
Conclusion
GEN is a company that recently went public in a very successful IPO. However, as investor expectations met reality with the company’s results for Q2 and Q3 of 2023, the share price continued to decrease despite the recent market rally that helped boost share prices almost across the board. Some risks to take into mind that might be priced in are the possibility of further consumer weakening, which can lead to a lower-than-expected growth rate for the company, as well as margin pressures that have not been resolved yet.
While the company is garnering some attention from Gen Z and Millennials who like the concept and atmosphere the restaurants provide, only time will tell if their loyalty can keep up with potentially more troubling times ahead. As such, the company shares trade at fair price and I remain cautious about the stock for now.

 Q2 2024 Earnings Call Transcript")

