alberto clemares expósito/iStock via Getty Images
In December of 2022, I presented what was, at the time, considered an ‘outlier’ prediction: A New Bull Market Is Likely To Start In 2023
In this piece, I will evaluate the success of our 2023 prediction, and present my prediction for 2024.
In 2022, fear of inflation, rising Fed funds rate (FFR), quantitative-tightening, and lower corporate earnings resulted in the consensus view that 2023 would bring a recession and even-lower stock prices.
Here is the summary points of the December 2022 article:
- Recession is unlikely in 2023.
- Interest income will add to the economy and help drive stocks higher.
- Inflation won’t likely drop to the Fed’s target of 2%, but it will moderate enough to keep the FFR below 6%.
- Corporate earnings will continue to drop during H1 of 2023, but stocks should rally.
- If current net spending by the Government is maintained, we expect the SPX to hit 4900 in 2023.
Monetary Policy
Last year, I pointed out that inflation is always caused by a supply (shortage) issue, while shortages can have various causes: natural disasters, war, monopolies, and corruption being the main ones, and is not simply the result of “too much money”. Even the father of monetarism, Milton Friedman, conceded that inflation is not solely a monetary issue when he told the Financial Times that…
‘The use of quantity of money as a target has not been a success… I’m not sure I would as of today push it as hard as I once did.’ (FT, 7 June 2003).
Increasing the cost of money does not help boost supply and, therefore, it is not effective at combating inflation unless/until, as Volcker demonstrated, borrowing costs get too high to maintain private debt and the economy is choked into a recession.
FRED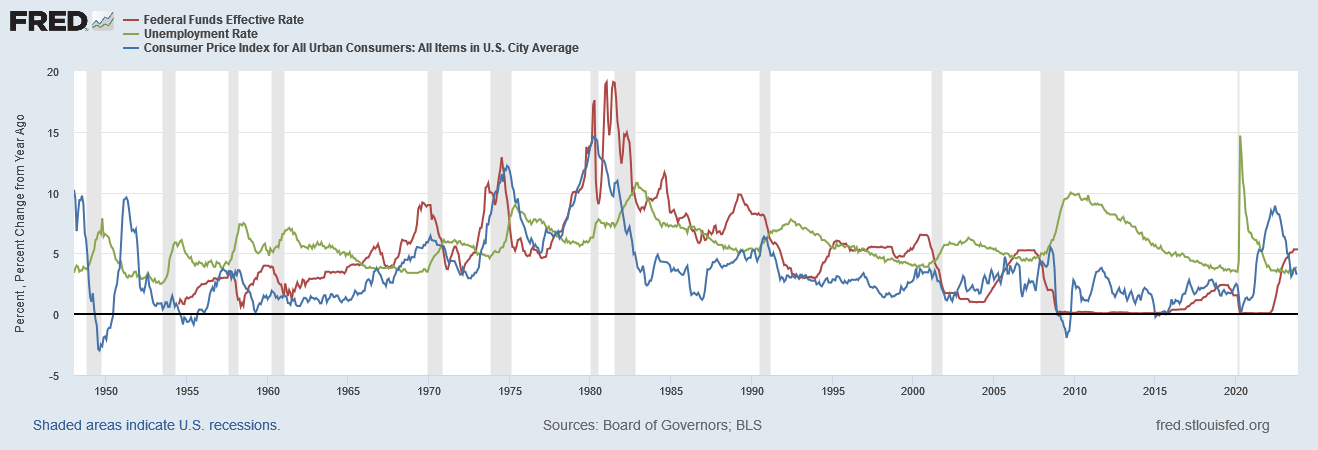
As I stated in 2022, interest rates below 6% are not high enough to cause financial stress and, therefore, will not cause a recession.
Although there is lots of talk about high levels of debt in the private sector, the bank credit:GDP ratio is back down to the pre-pandemic average (chart below)…
FRED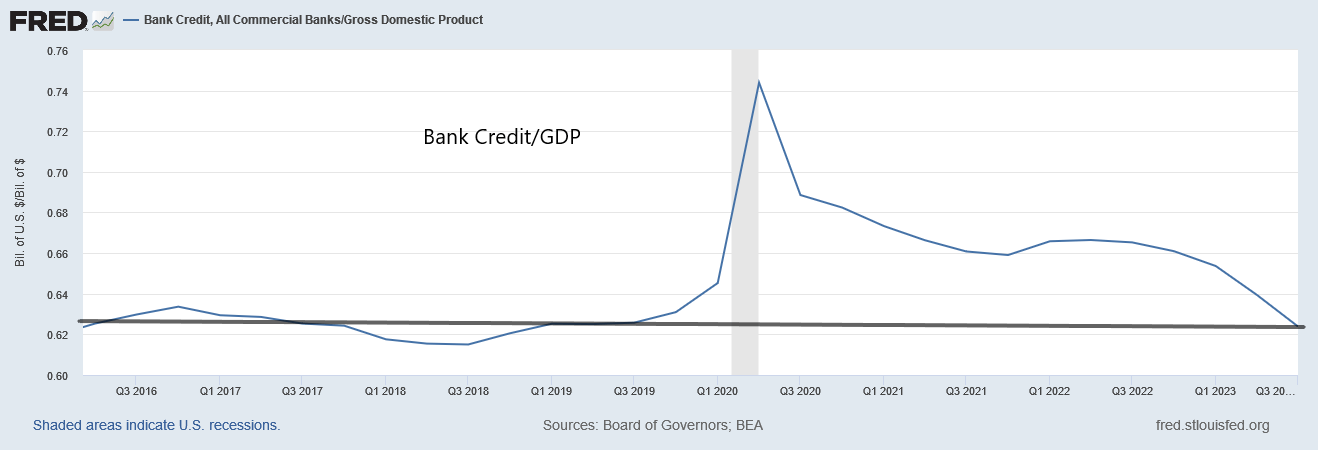
…and the delinquency rates on business loans are near-historic lows (chart below)…
FRED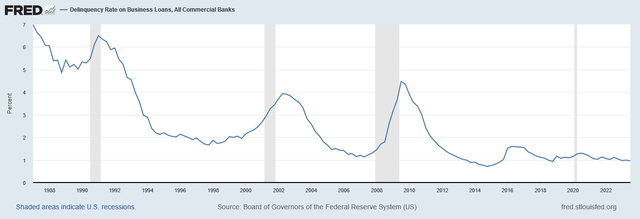
…so are delinquency rates on consumer loans, and the household debt service payments as a percent of disposable personal income (chart below)…
FRED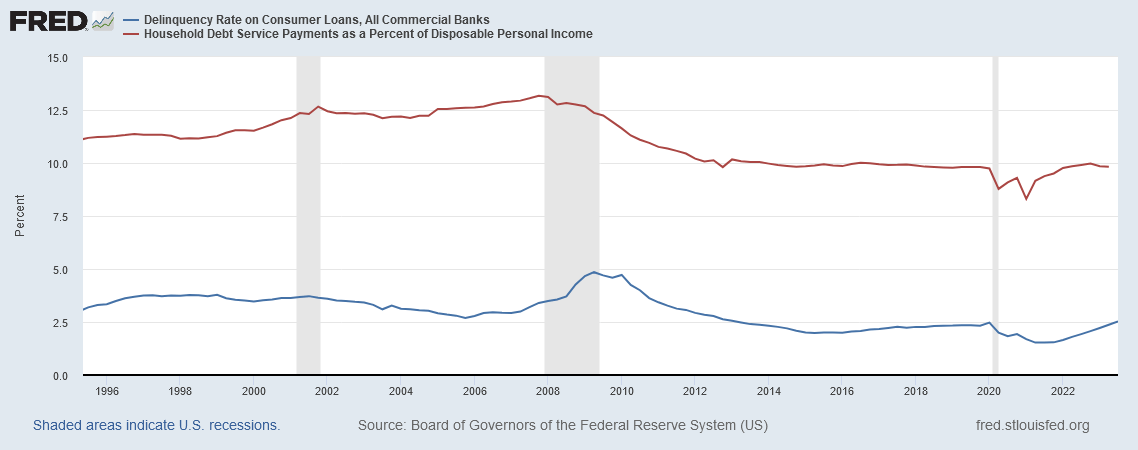
…and when it comes to margin debt, when viewed relative to the valuation of the collateral–the equity market–it is clear that margin debt is at historically low leverage levels (chart below).
FRED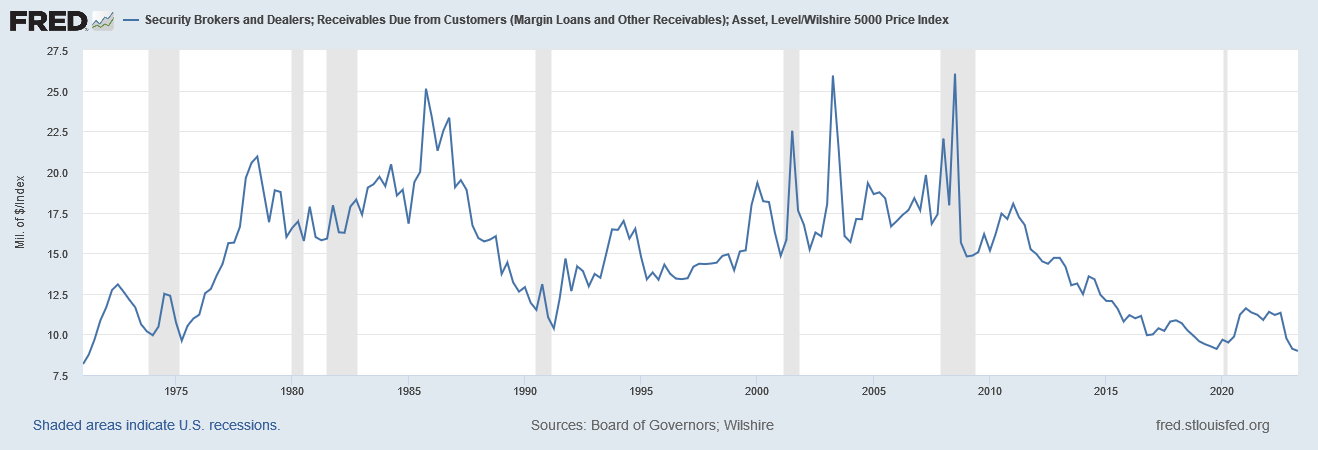
The private-sector is handling the 5% FFR without any sign of financial stress.
Inflation has moderated because supply chains have recovered from the pandemic shutdown–in spite of, not because of, higher interest rates.
US Inflation (Trading Economics)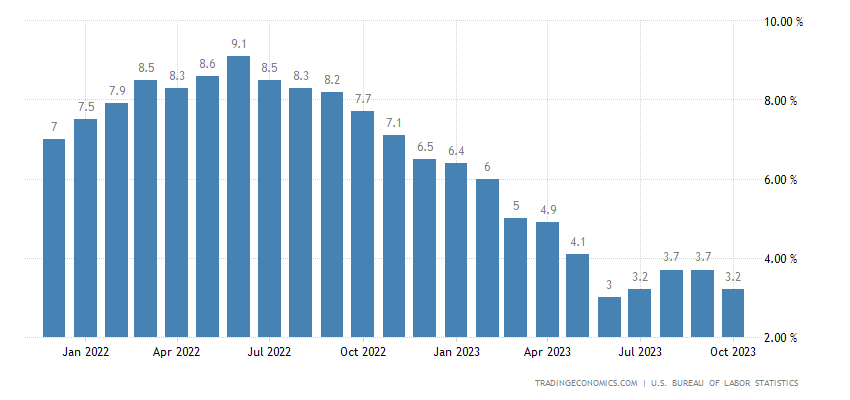
Recessions typically materialize between 6-18 months following the second 10y-2y rate inversion, and after unemployment starts to rise (chart below). The chart below highlights how the 10y-2y is still in its first inversion and unemployment remains relatively unchanged. The probability of a recession is not significant until at least 2025; the 10y-2y has to first rise, then re-invert, and unemployment has to rise dramatically before a recession (demand destruction) takes hold. (And if unemployment starts to rise in 2024, the Fed will stop hiking rates or start cutting rates, which will keep the terminal rate below 6%). A recession is unlikely in 2024, in my view.
ANG Traders, StockCharts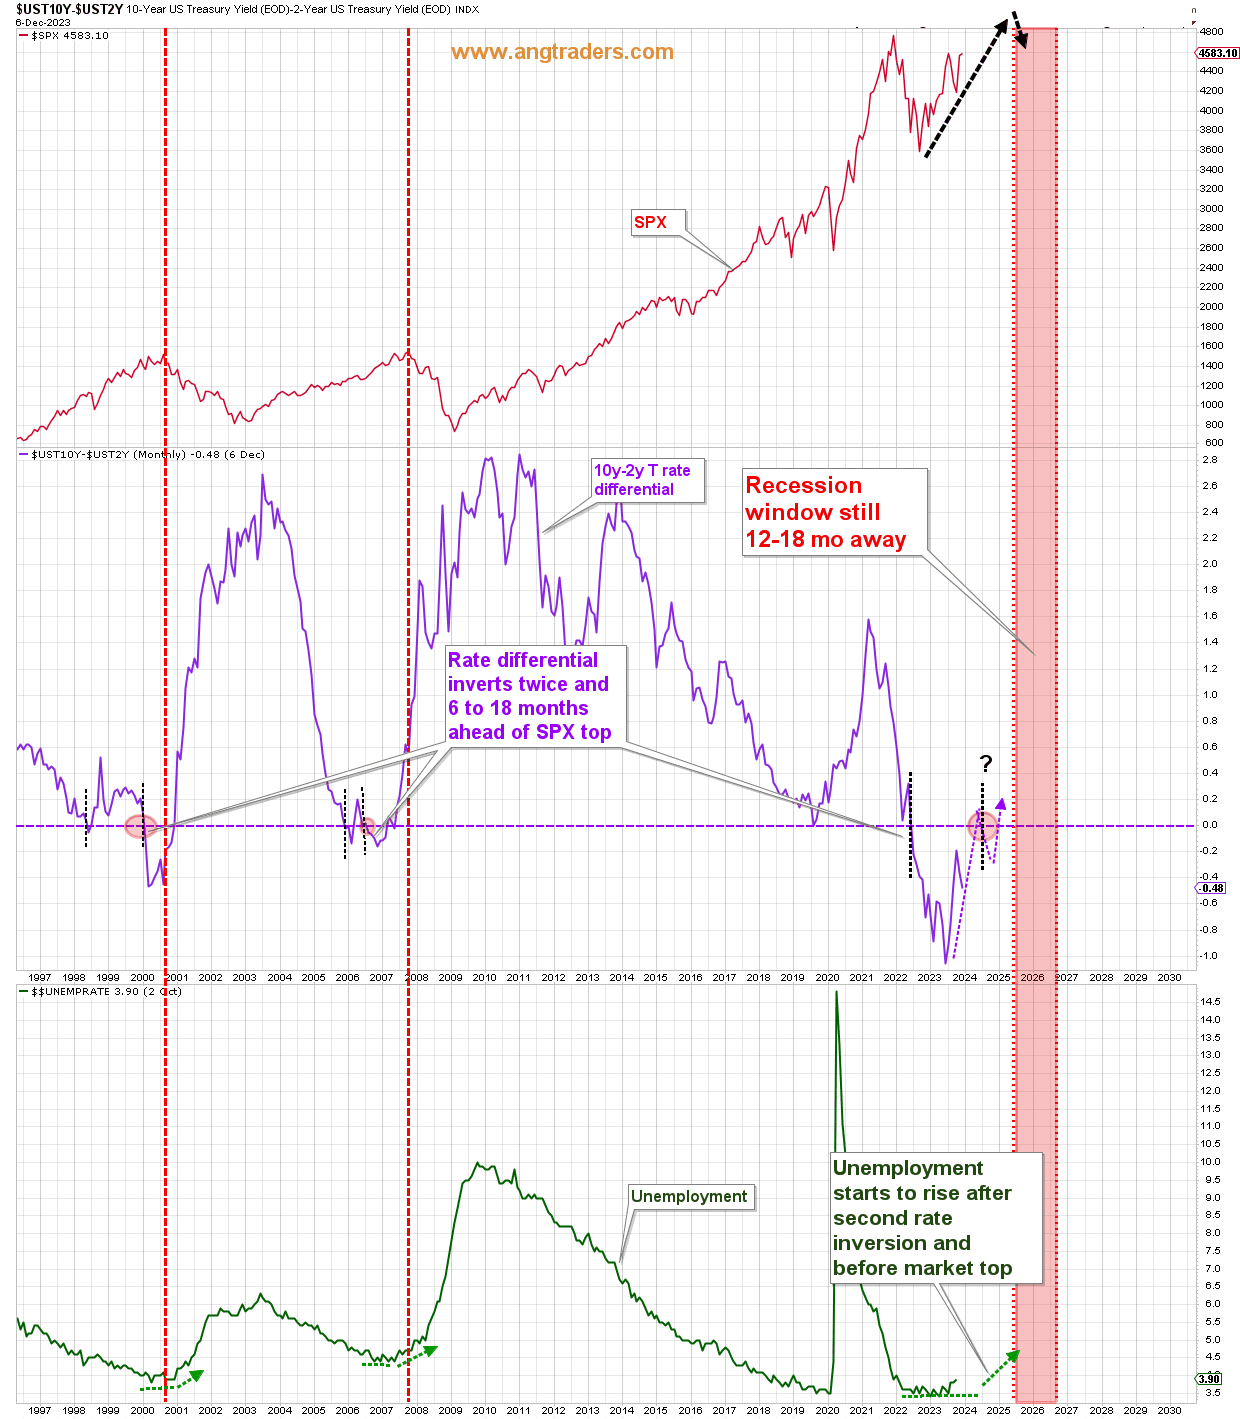
Fiscal-Policy
The primary source of money in the economy is the Federal Government through its spending and taxing policies; the Government adds new dollars to the economy (private-sector) whenever it spends to provision itself, and it drains dollars from the economy when it taxes money back.
When the Government spends more than it taxes back, the Treasury is said to have a budget deficit, but since it is the monetary-sovereign, not a household, its deficit represents the dollars that have been created and left in the economy.
Government deficits = Private surpluses
Taxes take money out of the private sector causing a surplus for the Government (red-area of chart below), while government spending adds money to the private sector which causes surpluses for the economy (green-area of chart below). Periods of increasing deficit-spending coincide with periods of SPX strength (blue arrows on chart below), and decreasing deficit-spending periods coincide with SPX weakness (pink arrows on chart below).
ANG Traders, StockCharts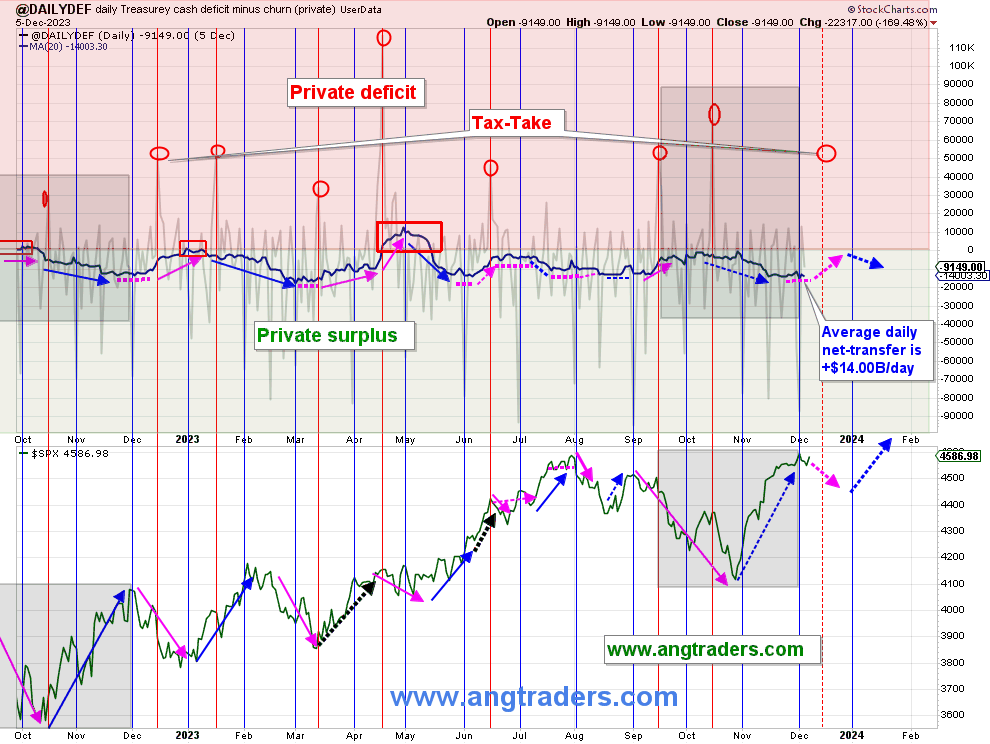
Government spending on interest-payments has surpassed spending on defense (chart below). Almost a trillion dollars have been created and transferred into private bank accounts. Although this transfer is regressive–since it flows to those that already have money and in proportion to how much money they have–it none-the-less increases the deficit which adds to the economy and has helped avoid the widely-expected recession.
Interest and Defense Spending (FRED)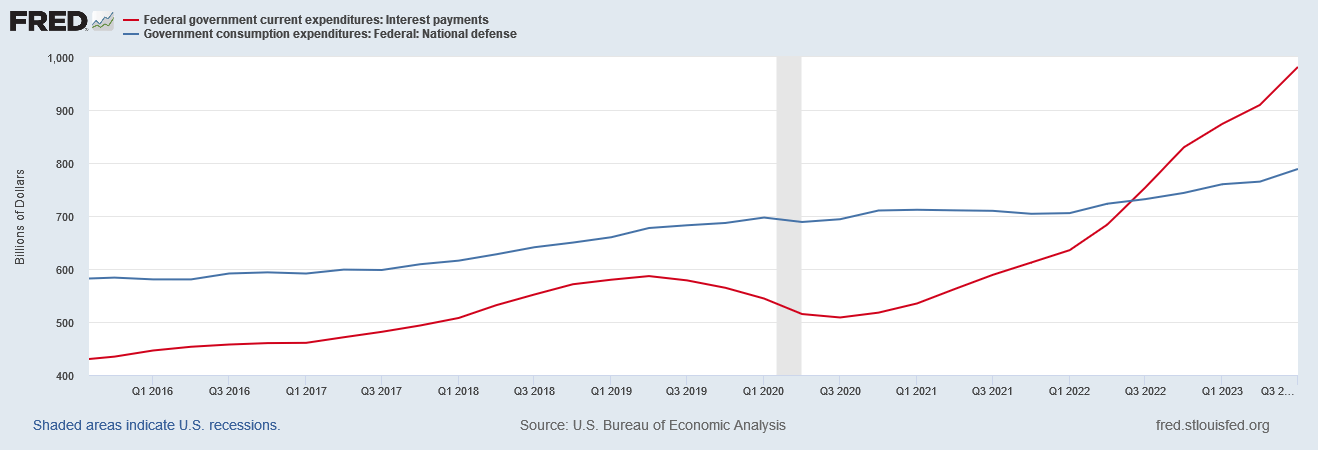
In fiscal-2023, the deficit net-transferred $1.7T into private bank accounts, compared to only $1.2T the year before. This increased liquidity which allowed the stock market to rise.
Monthly Treasury Statement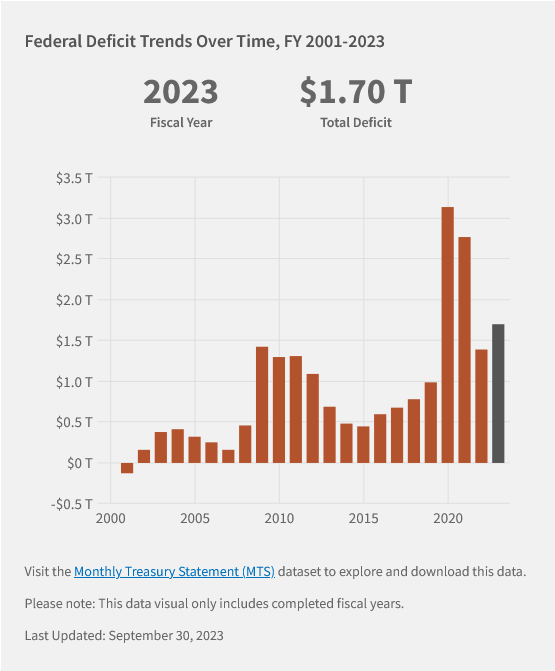
In the first two months of fiscal-2024, the deficit is $331B which is 4% higher than last year’s $318B. If this rate is maintained, then the net-transfer for fiscal 2024 would be $2.0T ($331B x 6) and the SPX is expected to advance higher with the same slope as it did in 2023 (green line below).
Net-transfer Rate (ANG Traders, StockCharts)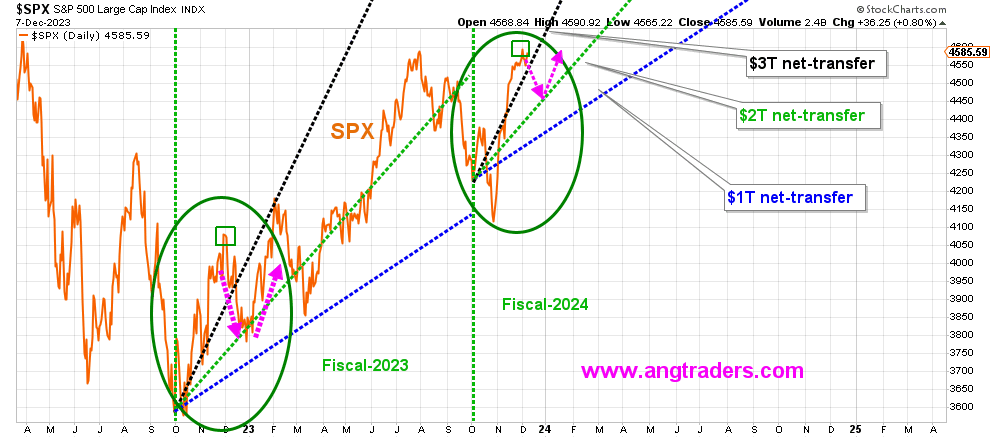
Liquidity (unencumbered dollars in the economy) is the primary driver of the stock market. Our proprietary liquidity model shows a high positive correlation with the SPX; rising and falling in tandem. Liquidity is shooting higher at the start of fiscal-2024, just admire it did last year at the start of fiscal-2023, (green arrows below).
Liquidity Model (ANG Traders, StockCharts)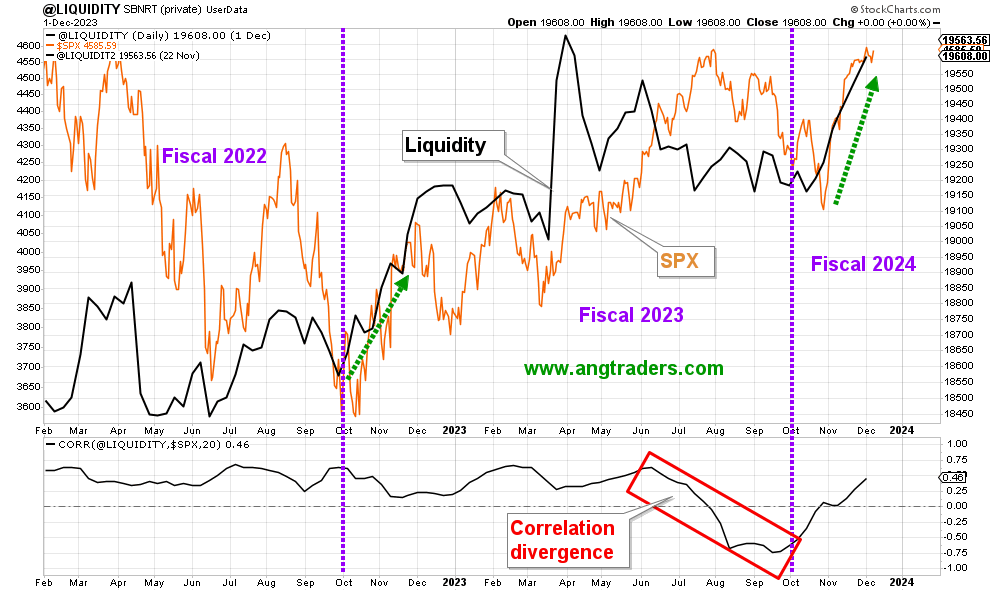
Corporate Earnings
As pointed out above, higher interest rates result in increased interest-income–almost $1T to persons and businesses–but higher rates also boost interest-expense for indebted corporations, which might bite into corporate profits.
The chart, below, shows that corporate debt-to-net-worth actually decreases (blue lines) as interest rates rise (red lines) and corporate profits (green lines) correlate positively with interest rates. Higher interest rates, boost the interest-income earned by the private sector which, in turn, flows to corporate profits.
FRED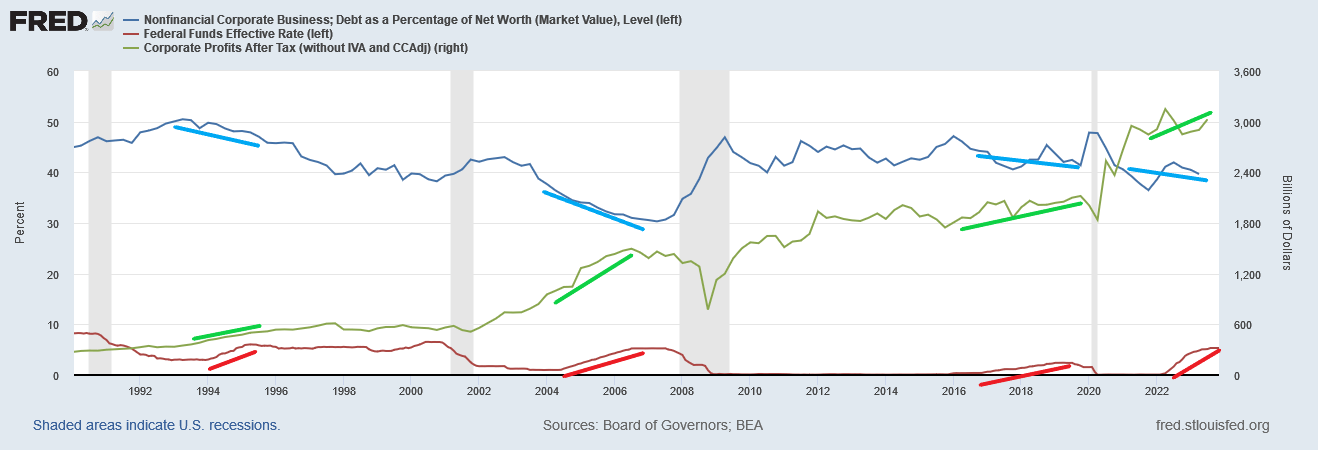
From last years’ article:
Corporate earnings continued to make record highs throughout 2022, but the SPX fell during that period.
This is similar to what happened in 2011 following the fiscal impulse coming out of the GFC, (blue-ovals on the chart below) and for the same reason; a big fiscal wave which gets reduced, but the transfer through to corporate earnings lags behind, while the stock market responds much faster to the reduced fiscal input. By the time corporate earnings start to drop (as they have done in Q4 2022), the stock market has made its lows and starts trading higher according to the new fiscal transfer rate.
ANG Traders, StockCharts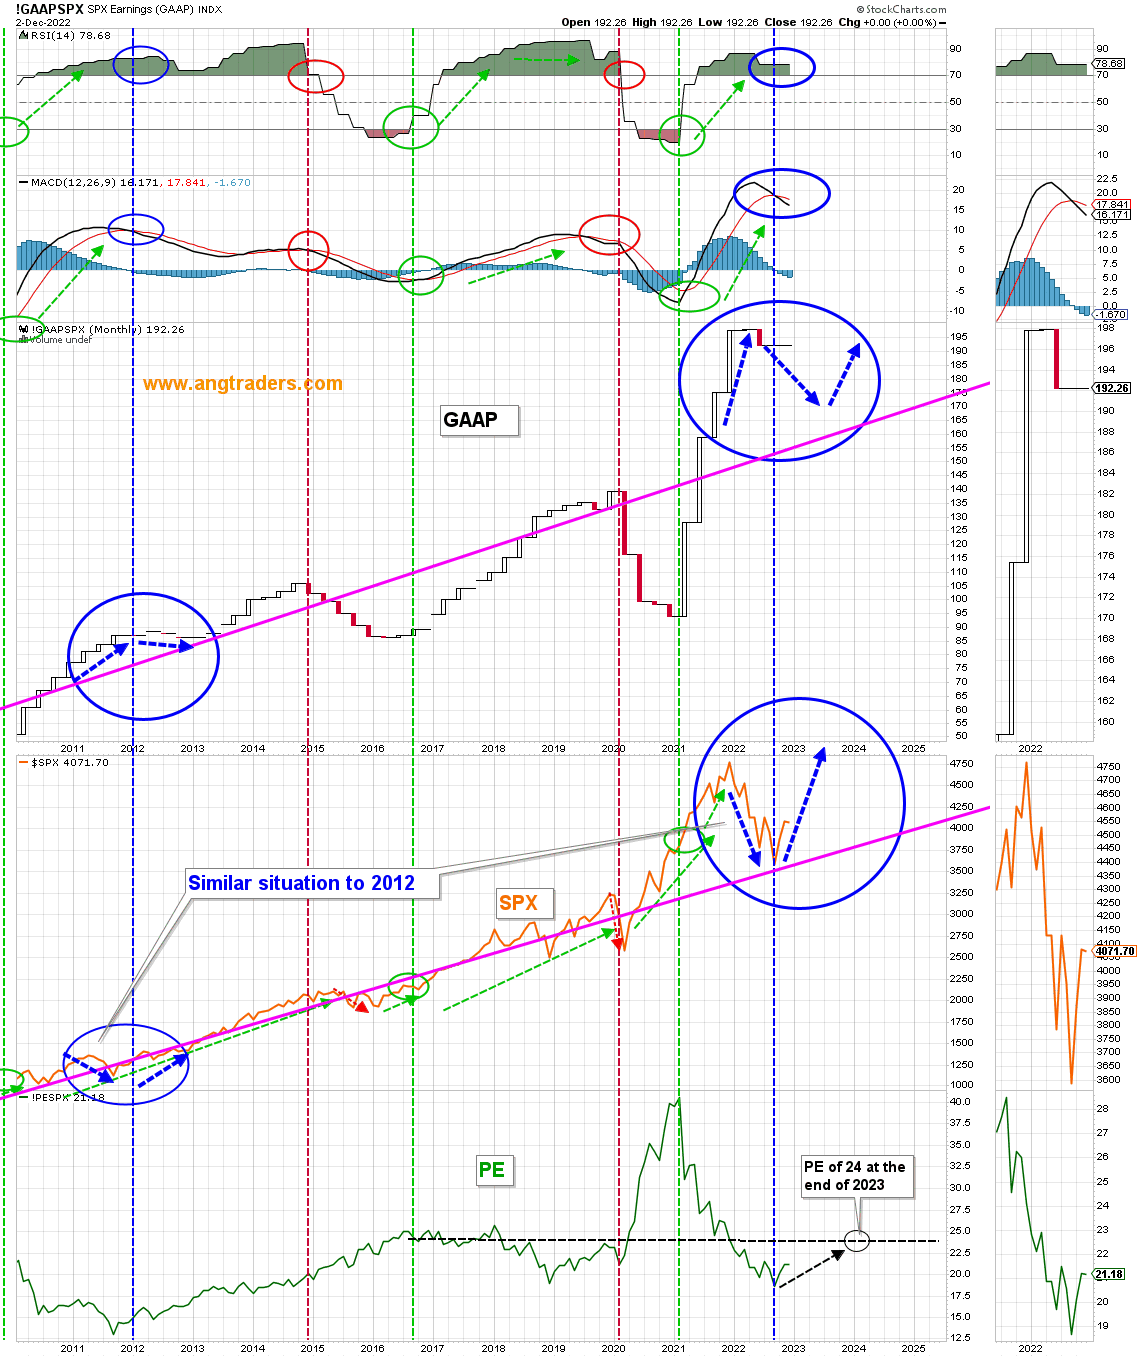
I predicted that the SPX would start to rise as the GAAP earnings continued to drop, and that the PE ratio would reach 24 in 2023. The chart below shows exactly that; the SPX rose, and the PE reached 24.
ANG Traders, StockCharts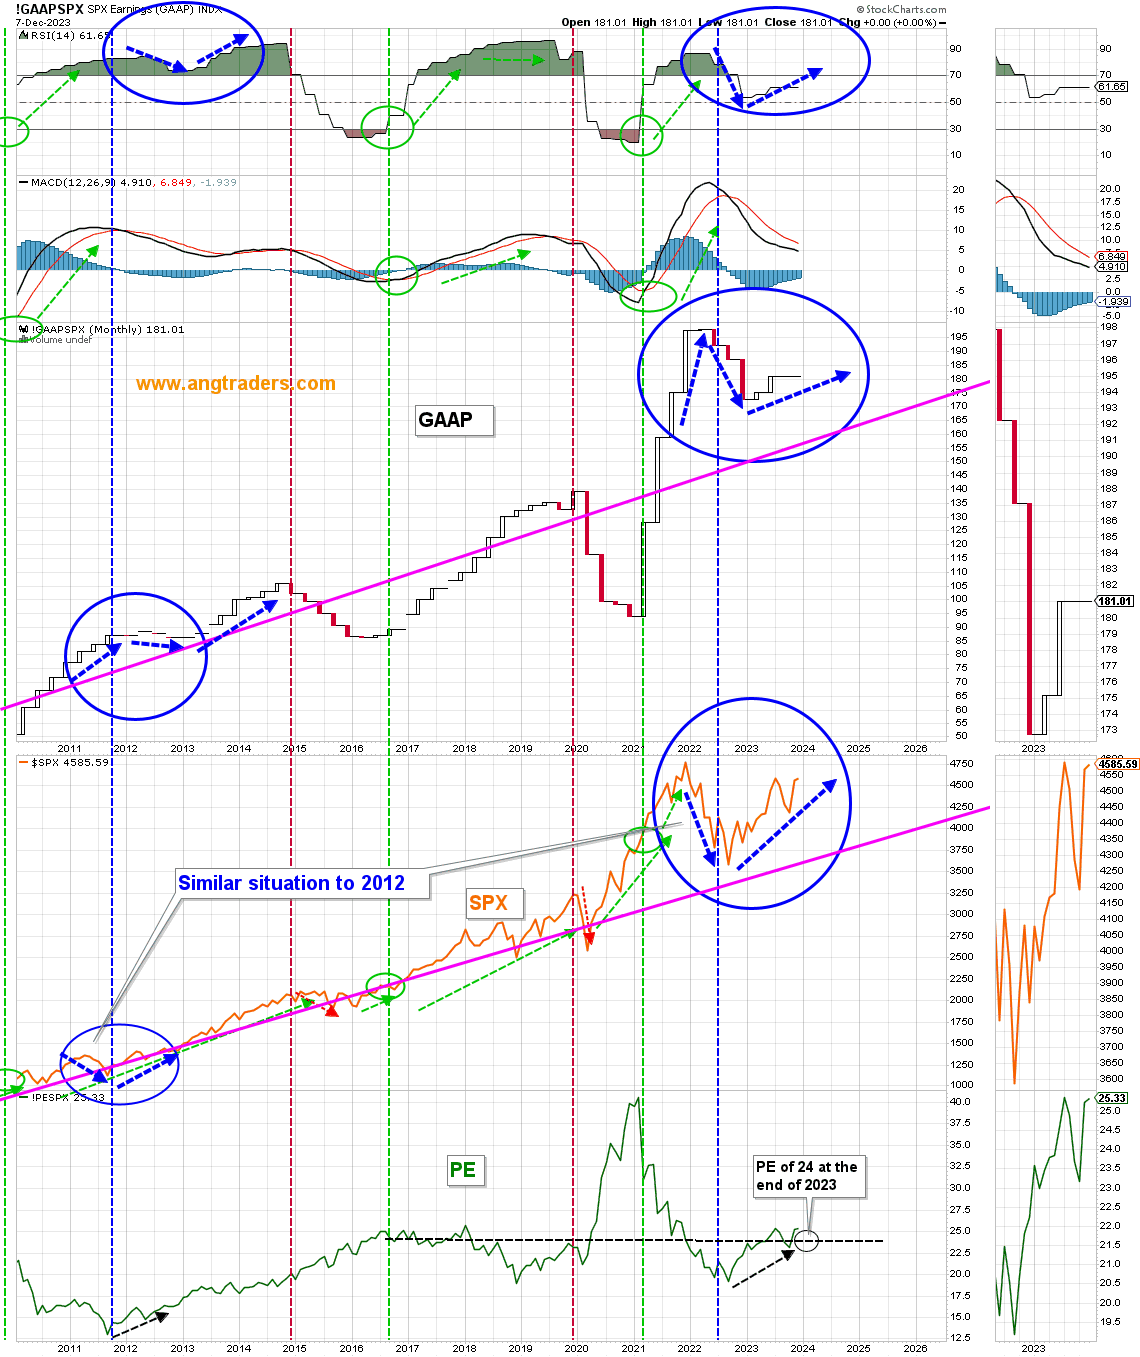
Last year, we predicted that the SPX could finish (depending on the level of deficit-spending) as low as 4500 and as high as 5800, but settled on 4900 as the most likely closing value for the S&P 500. As of this writing, and with 3-weeks left in the calendar-year, the SPX stands at 4585. It is a tight time-line, but we could still reach, 4900 by year end.
For 2024, I am expecting the deficit-spending to remain close to the $2T/year rate and the S&P 500 to finish the year at 5300 with the PE ratio at 26.
The Fly In the Ointment
As always, my predictions rest on the level of the deficit and, to a lessor extent, on the tightness of the monetary policy. The former, is 100% dependent on the politics of Congress, and the latter partially dependent on politics but mostly dependent on the feelings of Federal Reserve Bank members.
Even though the majority party in Congress is trying to reduce spending, since most of the spending is not discretionary–i.e. is automatic, such as social security and Medicare (military is officially discretionary, but nobody is willing to reduce that spending, and spending on interest-income is not directly controlled by Congress)–and since 2024 is a Presidential election year, I am assuming that spending will stay at 2023 levels until the November election. Neither party would dare cut social security or the military during an election year… but, if they did, then all bets are off.
After the election, however, the situation is less clear. If the Democrats take control of Congress and the Senate, then spending could boost if they go through with their “Green New Deal” spending. If the GOP retains control, then they might cut spending, but they are likely to cut taxes even more…which would actually boost the deficit.
In the end, my assessment is that net-transfers will not fall below last year’s $1.7T/year and that the SPX will rise to 5300 and the PE ratio to 26.
Editor’s Note: This article was submitted as part of Seeking Alpha’s Top 2024 Market Prediction competition, which runs through December 31. With cash prizes, this competition — open to all contributors — is one you don’t want to miss. If you are interested in becoming a contributor and taking part in the competition, click here to find out more and submit your article today!

 Q2 2024 Earnings Call Transcript")

