Vladimir Zakharov
Summary
Since the uptrend resumed on 10/27, small-cap value IJS gained 14.64%, better than large-cap growth SPYG, which gained 10.70%. There is a leader rotation from growth to value and from large-cap to small-cap. We believe that the current economic and market conditions are favorable for investing in IJS.
IJS – iShares S&P Small-Cap 600 Value ETF
Fund Details
Fund Type U.S. Equity
Issuer iShares
Inception 07/24/2000
Expense Ratio 0.18%
AUM $6.55B
# of Holdings 474
*Holdings as of 2023-11-29
The fund invests in small-capitalization stocks with relatively lower valuations.
As of December 1, 2023, the iShares S&P Small-Cap 600 Value ETF (NYSEARCA: IJS) has net assets of 6.55B and 1.60% yield. The YTD total return is 4.51%, with an expense ratio of 0.18%.
The holdings are concentrated in the following sectors: Financial Services 15.82%, Industrials 15.14%, Consumer Discretionary 20.56%, Real Estate 14.59%, Technology 10.20%, Healthcare 7.76%, Energy 3.94% and Basic Materials 3.69%. Consumer Staples, Utilities, and Communication Services all together contribute under 10%.
The holdings are well-distributed over a large number of stocks (474 as of 11/29/2023). The ten largest holdings hold only 8.30% of total assets.
Investment Thesis
I rate IJS as a BUY, with the expectation of healthy gains over the next couple of months.
There are a number of factors that maintain the thesis.
On the fundamental side, the recent decrease in Treasury bond interest rates creates a favorable business environment for small-cap stocks.
On the technical side, IJS made a strong trend reversal at the end of October. Since then, the fund has been in a sustained uptrend.
The market sentiment has switched from growth to value and from large to small-cap stocks. The small-cap stocks did not engage in the stock market rally over the last twelve months. The current price reversal is part of a “reversion to the mean” process.
The intermarket analysis is supporting a broad stock market rally for the remainder of this year. All four risk indicators used in my AMI service are flashing risk-ON.
Price Action
IJS lagged badly over most of 2023. Its total return of 4.50% versus a return of 21.38% for SPY is a result of market’s lack of breadth, most of the gains were made by large-cap growth stocks.
The chart below shows the price action over the last twelve months. It is obvious that since the end of October, IJS has been in a strong uptrend.
StockCharts.com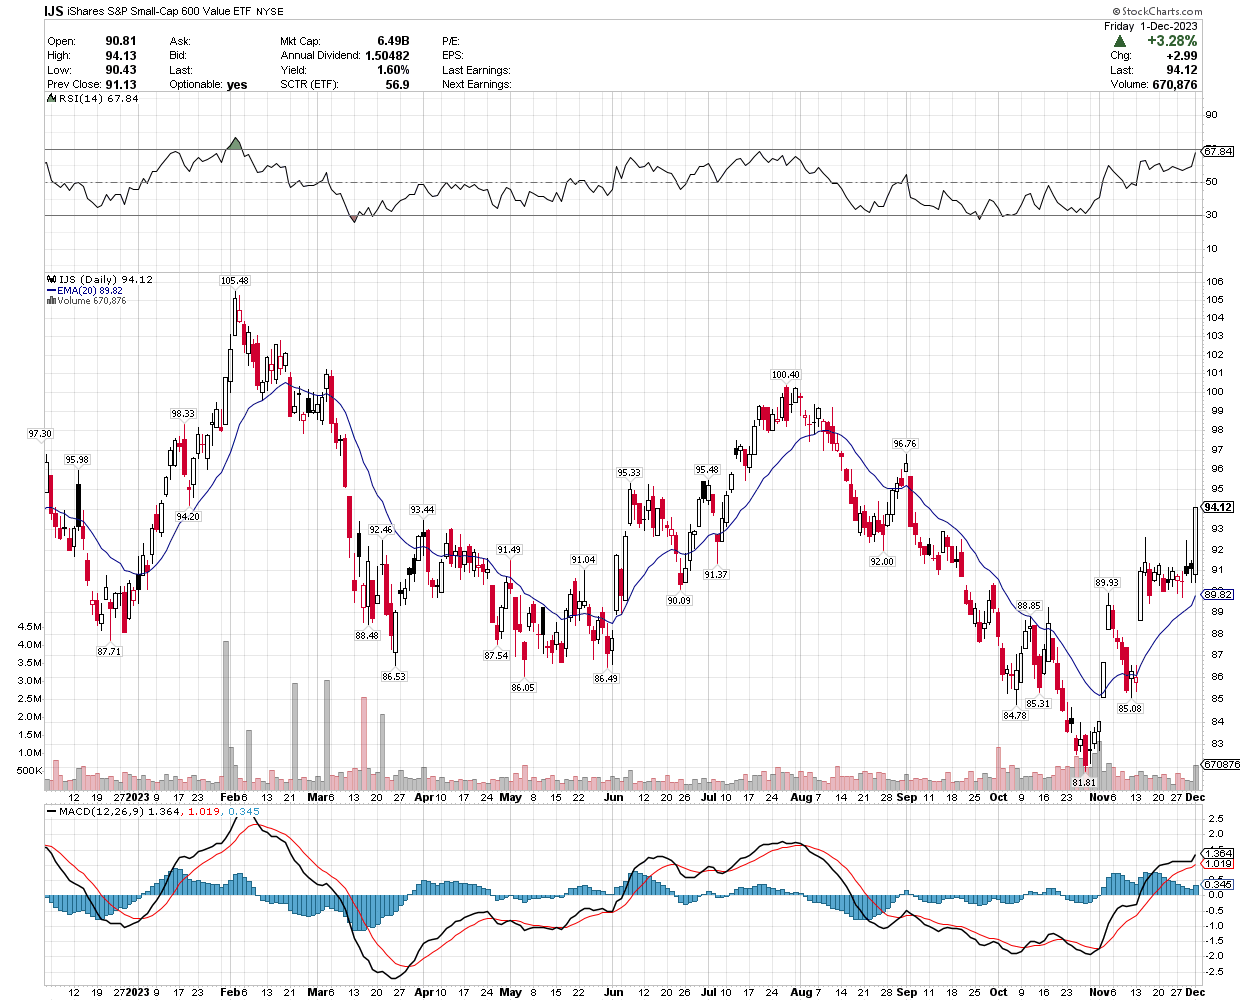
As an additional illustration, the next figure shows the total returns of four ETFs. We see that small-cap value has taken the top position since the market reversal. Large-cap growth is at the bottom now, although all are making decent gains.
StockCharts.com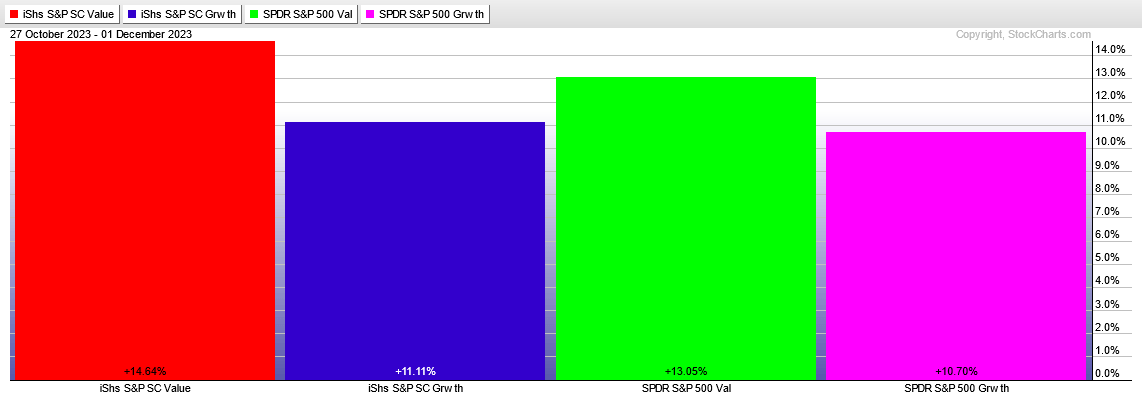
Market State
To ascertain the state of the market we compute the difference in total returns of the following four ETF pairs: (DBB, UUP), (XLI, XLU), (SLV, GLD) and (XLC, XLV) over an evaluation period. The evaluation period is variable. It is a function of market volatility.
Currently, the evaluation period is 78 trading days and all the pairs suggest risk-on.
Additionally, I watched the behavior of the market implied volatility. The figure below shows the volatility level over the last two months. During the month of October, VIX oscillated between 16 and 22. In November VIX declined steadily, reaching a low level under 13.
StockCharts.com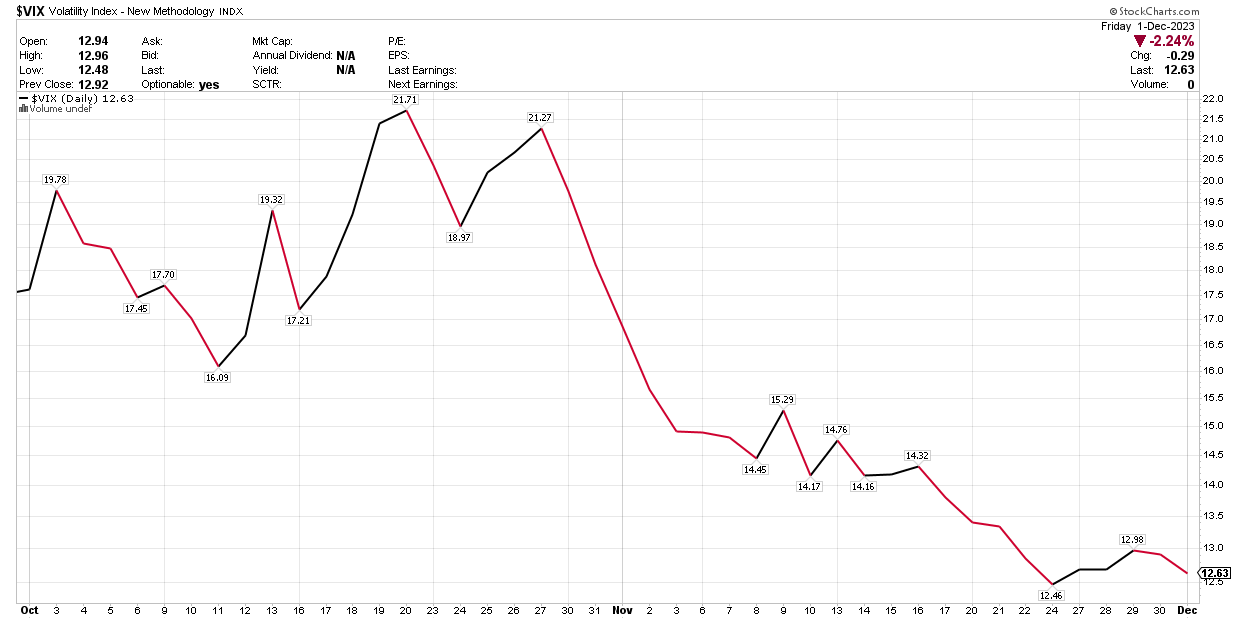
Conclusions
The indicators propose that the markets are in a risk-on state and that small-value stocks outperform. Therefore, we believe that now is a good time to invest in value funds and IJS is a good choice among the small-cap ETFs.
I rate IJS a BUY.

 Q2 2024 Earnings Call Transcript")

