Thesis:
Louisiana-Pacific (NYSE:LPX) is one of the largest engineered wood producers in North America supplying the construction industry. The company has been gradually shifting out of commodities and developing a differentiated product offering. These new products have significantly higher selling prices per SF so by converting its production capacity to higher-value production LPX is creating structural growth in its inherently cyclical industry.
LPX is a growing cyclical producer that experiences significant volatility as market conditions change but is able to deliver structural growth across the cycle. Companies admire that can, at times, be bought at attractive prices and the investment thesis does not rely entirely on mean reversion. The main issue with these is buying at the right price, especially if the structural growth is not that rapid.
As of late construction industry has been slowing down, OSB sales prices and volumes have plummeted and we calculate that LPX to deliver 70% less profit in 2023 as compared to last year. The peak cycle has now ended. On the other hand, OSB business still generates a c22% EBITDA margin and market pricing has stabilised. We believe that LPX is not yet cheap enough, though it is worth following this company closely as the deteriorating business environment might soon turn it into a buy.
ghornephoto/E+ via Getty Images
OSB industry is cyclical
LPX is one of the largest manufacturers of OSB (Oriented Strand Board) in North America. OSB is essentially a compressed and glued wood chipboard mainly used in residential construction as a structural and protective element. LPX produces simple commodity-type boards and also performance boards that have enhanced resilience to elements such as water or fire. OSB is essentially a commodity, though the performance boards command a price premium. The largest producers in the market are Louisiana-Pacific, West Fraser (WFG), Weyerhaeuser (WY) and Georgia-Pacific.
West Fraser IR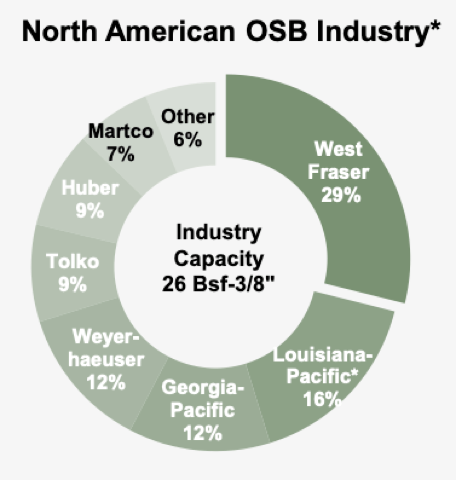
The revenues and profit margins in this industry are determined primarily by market forces and individual market players have limited pricing power. Over the last few years, OSB prices have been strong due to underinvestment in the market in the period prior, and also the increasing popularity of OSB in construction as plywood was pushed out. Increasing demand paired with limited capacity additions has kept the prices strong. Some observers blame the market concentration for persistently high prices.
Forisk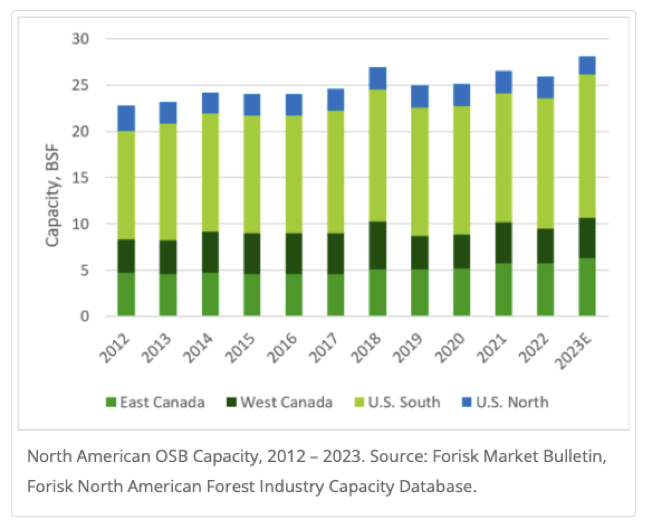
OSB prices and profit margins of LPX have been strong since 2016 but have now started to weaken significantly on the back of reduced construction activity. In the 9 months of FY2023, the OSB prices have declined c45% and the sales volume fell 20% as single-family housing starts have declined by c13%. The profits of LPX during the last twelve months have declined to the level last seen only in 2016.
Seeking Alpha
OSB board is mainly used in the residential construction market. Production itself is largely scaled and automated therefore as demand falls output cannot be easily curtailed unless entire production lines are shut and therefore suppliers produce pretty much right until the price stops covering the variable cost. OSB market production volumes fluctuate with the cyclical construction industry but suppliers experience even larger volatility as prices tend to fall also as volumes fall. In the first nine months of 2023, LPX’s OSB revenues have declined by 60%. The variable production cost of OSB is c$170-190 per MMSF 3/8”, while in the last 9 months, LPX has generated an average price on commodity OSB of c$290 per MSF. Prices did come down but the market is not in distress just yet.
LPX has also managed to build a sizeable OSB structural solutions business which now accounts for half of overall OSB production volumes. The company has recently launched thermal insulated OSB shearing and is producing a range of performance-enhanced OSB sheeting. The prices of the performance boards do advance in with OSB though they do command a 30 -100% price premium and are not as volatile. During FY2019, a year of very significant OSB price declines, structural solutions price has held up particularly well as the price premium has temporarily soared to 170%. We expect OSB Structural Solutions to continue helping LPX mitigate some of the OSB commodity market volatility.
Siding is a better business
Siding is the most expensive and the least volatile performance OSB product. Siding prices are practically not correlated to OSB commodity prices and as OSB prices fell during the first 9 months of 2023, they now command a 200% price premium to the commodity sheet. On top of that, the adoption of engineered wood siding is gradually increasing in the construction industry, offering structural growth opportunities for LPX.
It is no wonder that the management of LPX has decided to shift the focus of the business away from the boom and bust commodity OBS industry. The company has now started converting OSB plants into SmartSide-engineered wood siding production facilities. The share of structural solutions volume is also gradually increasing.
Louisiana Pacific IR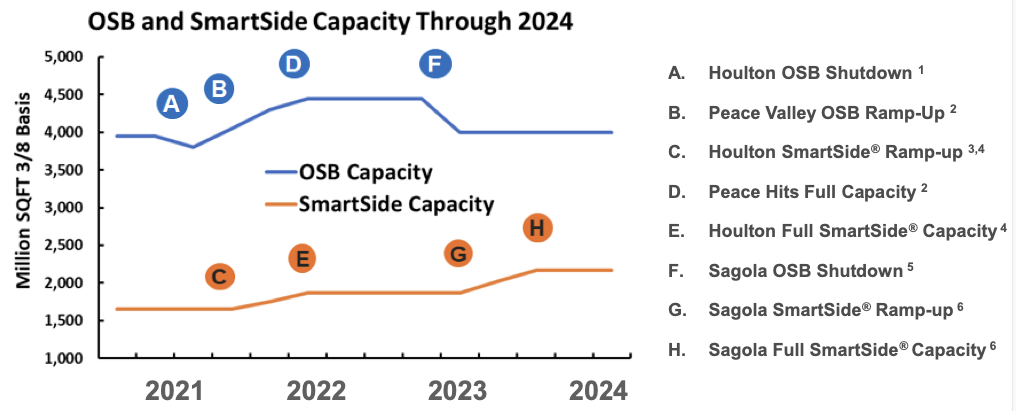
Engineered wood siding is quite similar in composition to OSB boards and therefore plant conversion is not technically demanding or expensive. Siding capacity following conversion is typically 75-85% of pre-conversion OSB capacity. On the other hand, engineered wood siding still has a limited market penetration and LPX is the dominant supplier. Any additional OSB siding capacity has to be met with market demand. LPX can convert plants quite easily but the market adoption and demand creation part is a rather challenging and patient process. The company has been increasing siding sales volumes by about 7% per annum.
SmartSide, a popular brand of engineered wood siding, was introduced by LPX in the early 1990s. It is made from wood strands or fibres, oriented for strength and durability, and treated with binders and resins for enhanced performance. It was designed to offer the aesthetic appeal of traditional wood siding with improved durability and resistance to elements. Engineered wood offers better aesthetic appeal than vinyl and is cheaper than fibre cement wood and brick. Vinyl has been losing popularity while fibre cement and engineered wood have been both gaining a share. We expect vinyl siding to continue losing market share.
Louisiana Pacific IR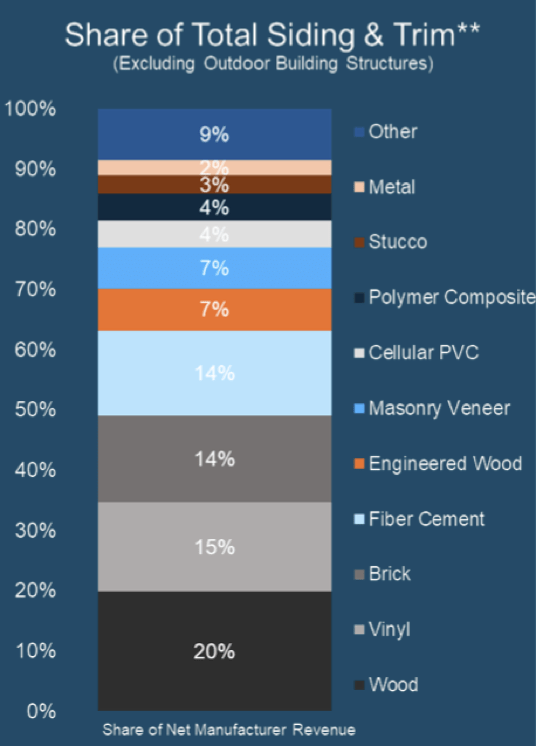
The total Siding and Trim market was worth about $15 bn in 2020, and LPX estimated the Engineered Wood siding market to account for 7% of the overall or c$1.1 billion. During FY2020 LPX SmartSide sales were $960, so it would appear that LPX dominates the market with a 87% market share. We would expect the market share of LPX to reject as the material becomes more popular, but as of now, LPX is the dominant supplier, the innovator and the leading brand in the market. We would expect LPX to preserve a strong position in the market for years to come. The main competitor in the engineered wood siding space is James Hardie (JHX), a large manufacturer of fibre cement siding.
Other OSB suppliers could potentially flood the engineered wood siding market if/once OSB business deteriorates, though we believe this is not likely. LPX is a large and cost-competitive manufacturer and they have the leading brand and reliability track record in the industry. The siding is expensive to install and is expected to last 30-50 years. If some industry newcomers cannot offer significantly lower prices and do not have a long track record and a well-regarded brand, there is no reason for customers to pick them over LPX. Any potential industry newcomers are likely to struggle for a number of years before they can build a strong position. LPX can be expected to preserve a strong position in the siding market for years to come, they just need to convince more customers that their siding will last a long time with little maintenance.
While engineered wood siding is increasing in popularity due to its durability and versatility, there have been some historical issues associated with it. Early versions of some engineered wood siding products faced challenges related to moisture absorption, which could direct to issues admire swelling, warping, and, in extreme cases, rot. This was particularly a concern if the siding was not properly installed, sealed, or maintained. Advancements in technology and product formulations have addressed many of these issues, but the repetitional damage was sustained.
It is important to note that engineered wood siding still requires correct installation to deliver optimum performance. Installation requires 3/16 inch gaps at butt joints and edges need to be sealed with caulk or clips. Careless installation can result in moisture damage or cracking at butt joints. Caulk might have to be reapplied periodically representing an added maintenance cost. The majority of siding produced by LPX is sold not painted just primed. Third-party painting represents an additional quality risk factor. LPX has improved their product but they still need to work on making sure painters and installers follow the correct procedures and that the customers are well-informed of all the maintenance needs and limitations, especially in the more humid and cold parts of the country. With time, the reputation will be repaired.
It does not look cheap at the moment
LPX is a cyclical business with strong underlying growth trends due to increasing the share of revenue from differentiated products. The underlying growth, on the other hand, is constrained by the speed of adoption of engineered wood siding. Sales volumes of SmartSide have been growing at about 7% and we expect these trends to be maintained.
As siding capacity increases the older commodity OSB plants are being shut for conversion, overall production volume does not change, but as production moves towards siding, which sells for roughly 2-3x the normalised price of OSB board, the same production capacity will produce 2-3x more sales. This growth will likely be achieved with limited capital spending needs.
|
LPX |
2016 |
2017 |
2018 |
2019 |
2020 |
2021 |
2022 |
9m 2023 |
Cagr |
2023 |
2024 |
2029 |
Cagr |
|
Sales Volume MMSF |
5503 |
5546 |
5552 |
5,008 |
5247 |
5345 |
5577 |
0% |
5600 |
5600 |
0% |
||
|
Siding |
1195 |
1300 |
1360 |
1,265 |
1429 |
1667 |
1830 |
1,183 |
7% |
2100 |
3000 |
7% |
|
|
OSB—commodity |
2,818 |
2,642 |
2,582 |
2,144 |
2253 |
2014 |
1944 |
1,137 |
-6% |
1700 |
600 |
-19% |
|
|
OSB—solutions (incl. SA) |
1490 |
1,604 |
1,610 |
1,599 |
1565 |
1664 |
1803 |
1,521 |
2% |
1800 |
2000 |
2% |
|
|
Sales |
1,779.3 |
3,488 |
3,552 |
2,471 |
3,399 |
5,944 |
5,593 |
2,748 |
10% |
2,322 |
2,740 |
3,620 |
6% |
|
Siding |
752.3 |
884.0 |
942 |
917 |
959 |
1,170 |
1,469 |
996 |
11% |
1,322 |
1,680 |
2,700 |
10% |
|
OSB |
1,027 |
1,302 |
1,305 |
777 |
1,220 |
2,387 |
2,062 |
876 |
10% |
1,000 |
1,060 |
920 |
-3% |
|
OSB comm |
632 |
582 |
249 |
494 |
1,008 |
739 |
332 |
3% |
340 |
120 |
-19% |
||
|
OSB solutions (incl. SA) |
670 |
723 |
528 |
726 |
1379 |
1323 |
544 |
15% |
720 |
800 |
2% |
||
|
EBITDA, adj |
339 |
646 |
626 |
183 |
761 |
1877 |
1389 |
349 |
419 |
533 |
740 |
7% |
|
|
Siding |
156 |
220 |
235 |
169 |
249 |
289 |
339 |
198 |
9% |
264 |
386 |
621 |
10% |
|
OSB |
247 |
490 |
454 |
10 |
519 |
1531 |
1034 |
161 |
16% |
220 |
212 |
184 |
-3% |
|
SA |
25 |
33 |
40 |
34 |
42 |
113 |
77 |
31 |
18% |
||||
|
Corp &other |
-89 |
-97 |
-103 |
-30 |
-49 |
-56 |
-61 |
-41 |
-65 |
-65 |
-65 |
||
|
EBITDA Margin |
|||||||||||||
|
Siding |
21% |
25% |
25% |
18% |
26% |
25% |
23% |
20% |
20% |
23% |
23% |
||
|
OSB |
26% |
40% |
38% |
6% |
46% |
69% |
54% |
22% |
22% |
20% |
20% |
||
|
Prices (USD/SF) |
|||||||||||||
|
Siding |
0.63 |
0.68 |
0.69 |
0.72 |
0.67 |
0.70 |
0.80 |
0.84 |
3% |
0.8 |
0.9 |
2% |
|
|
OSB comm |
0.24 |
0.24 |
0.23 |
0.12 |
0.22 |
0.50 |
0.38 |
0.29 |
10% |
0.2 |
0.2 |
0% |
|
|
OSB Solutions |
0.42 |
0.45 |
0.33 |
0.46 |
0.83 |
0.73 |
0.36 |
12% |
0.4 |
0.4 |
0% |
LPX financials and our estimates
We assume that siding and structural solutions OSB sales volumes will continue increasing gradually at the same rate of 7%, while commodity OSB volumes will continue declining and prices will settle at low levels. We expect prices of siding to appreciate with inflation as it is not a commodity. In a stable margin environment, we would expect LPX to be able to grow sales and EBITDA at a rate of 6-7%, given the assumptions provided in the table above.
|
LPX Valuation |
2022 |
2023 |
2024 |
|
EBITDA |
1389 |
419 |
533 |
|
Depreciation |
0 |
135 |
135 |
|
Capex |
450 |
300 |
220 |
|
Maintenance |
135 |
135 |
|
|
EBIT |
284 |
398 |
|
|
Interest |
11 |
11 |
|
|
PBT |
273 |
387 |
|
|
57 |
81 |
||
|
Earnings |
216 |
306 |
|
|
PE |
20 |
14 |
|
|
Value |
|||
|
Market value |
4400 |
||
|
FCF |
51 |
221 |
|
|
FCF Yield |
4.9% |
5.0% |
LPX financials and our estimates
We calculate a normalised EBITDA level of about $530 million and normalised net earnings of $300 million, given the assumptions in the table above. LPX is currently trading at 14-15X adjusted earnings and offers slow structural growth and cyclical end markets. It is most likely fairly valued at the moment.
We normally seek base case returns of around 15% IRR. If we expect the profits and free cash flow to grow at c7%, we would admire to purchase the business at an 8% FCF yield to give us an overall c15% yield on our purchase price. Currently, LPX is trading at a c5% yield assuming a normalised capex level of $220 million. We would admire to purchase the shares at a price of c$40-50 USD per share.
A volatile end market is a risk factor but it also can furnish opportunities to buy good quality businesses at attractive prices. OSB markets have now stabilised at a rather attractive price, but advance demand reduction or commissioning of more capacity could dent the OSB market advance.
Risks
- Siding volume and pricing growth could falter to materialise.
- OSB market, including the OSB Structural Solutions, could fall out of balance again and depress prices for a number of years.
Conclusions
Louisiana-Pacific is a commodity business transitioning to speciality products. Conversion of manufacturing capacity to Siding and Structural Solutions will yield higher revenues and more stable profit margins across the cycle. Currently, the business is coming out of the OSB peak cycle and commodity market prices and business profits have declined significantly. The share price of LPX, on the other hand, has remained resilient. We would admire to own LPX due to its structural growth, though the current price is not attractive enough.
Editor’s Note: This article discusses one or more securities that do not trade on a major U.S. exchange. Please be aware of the risks associated with these stocks.

 Q2 2024 Earnings Call Transcript")

