champpixs
Market Recap
The Santa Rally started early this year, equities finally snapped from a 3-month losing streak and boy did we see some nice gains in November. Vanguard’s High Dividend Yield ETF (VYM) returned 6.26%, the SPDR S&P 500 Trust ETF (SPY) rocked an even better 9.13%, and my watchlist topped them both with a return of 11.89%. Year-to-date VYM finally has a positive return, +0.91%, my watchlist is up 9.45% but SPY is performing the best with a gain of 20.67%. Since inception, November 2020, my watchlist continues to trail both VYM and SPY on an annualized basis but it did make up some ground last month. The since inception returns are; 11.98% for my watchlist, 13.35% for VYM and 13.11% for SPY.
My watchlist has a bigger focus on growth and therefore tends to underperform when market sentiment is poor but it outperforms when market sentiment is favorable. Over the long term positive market periods last longer than negative market periods, therefore I am optimistic my watchlist will catch-up and outperform both SPY and VYM in the coming months and years.
The main purpose of a high dividend yield portfolio is not to outperform the broad market but to create a passive income stream that is relatively safe, reliable, and one that can grow in the future. The top 10 stocks on my watchlist for December 2023, collectively, offer a 4.20% dividend yield that is more than double the dividend yield of the S&P 500. These 10 stocks have also grown their dividends at a historical rate of 18.69% per year during the last five years. Collectively, all 10 stocks appear to be potentially about 42% undervalued right now based on dividend yield theory.
The best way to create a strong high yield dividend portfolio is with a buy-and-hold strategy. This strategy forces you to think about the stocks you set up to invest your capital into as the scheme is to hold the positions indefinitely. Applying this approach over the long term while focusing on potentially undervalued stocks allows investors to create alpha through capital appreciation. While this may not pan out for every position, diversifying your high-yield portfolio across 20 or more unique stocks will boost the odds of picking up shares of certain stocks when they are trading for bargain prices. The beauty of a long-term outlook is time; you can sit back and expect for the valuation to revert to historical norms, all the while collecting a generous passive income stream.
Watchlist Criteria
Creating the high yield watchlist, I had four areas of interest that I focused on: basic criteria, safety, quality, and stability. First off, the basic criterion aims to narrow down the list of stocks to those that pay a dividend, offer a yield above 2.75%, and trade on the NYSE and NASDAQ. The next set of criteria focuses on safety because that is a crucial part of a high yield investing strategy. The filter excludes companies with payout ratios above 100% and companies with negative 5-year dividend growth rates. Another level of safety can be associated with larger companies; therefore, the watchlist narrows in on stocks with a market cap of at least $10 billion. The next set of criteria set out to narrow down the list to include higher quality businesses.
The three filters for quality are: a wide or narrow Morningstar moat, a standard or exemplary Morningstar stewardship, and an S&P quality rating of B+ or higher. A Morningstar moat rating represents the company’s sustainable competitive advantage, the main difference between a wide and narrow moat is the duration that Morningstar expects that advantage to last. Companies with a wide moat are expected to maintain their advantage for the next 20 years, whereas companies with a narrow moat are expected to maintain their advantage for the next 10 years. The Morningstar stewardship evaluates the management team of a company with respect to shareholders’ capital.
The S&P quality rating evaluates a company’s earnings and dividend history. A rating of B+ or higher is associated with above-average businesses. The last set of criteria focuses on the stability of a company’s top-line and bottom-line growth. The filter eliminates companies with negative 5-year revenue or earnings per share growth rate. I believe a company that is growing both their top-line and bottom-line has the ability to furnish growth to its investors in the future.
All of the stocks that pass the initial screener criteria (49 this month) are then ranked based on quality and valuation. advocate, I sort the stocks in descending order based on the best combination of quality and value and select the top 10 stocks that are forecasted to have at least a 12% annual long-term return.
December 2023 Watchlist
Here is the watchlist for December 2023. There are three changes from the prior month: BlackRock (BLK), initiate Natural Resources (PXD) and Skyworks Solutions (SWKS) drop out and are replaced by CRH plc (CRH), EOG Resources (EOG) and NextEra Energy (NEE). The data shown in the image below is as of 11/30/23.
Created by Author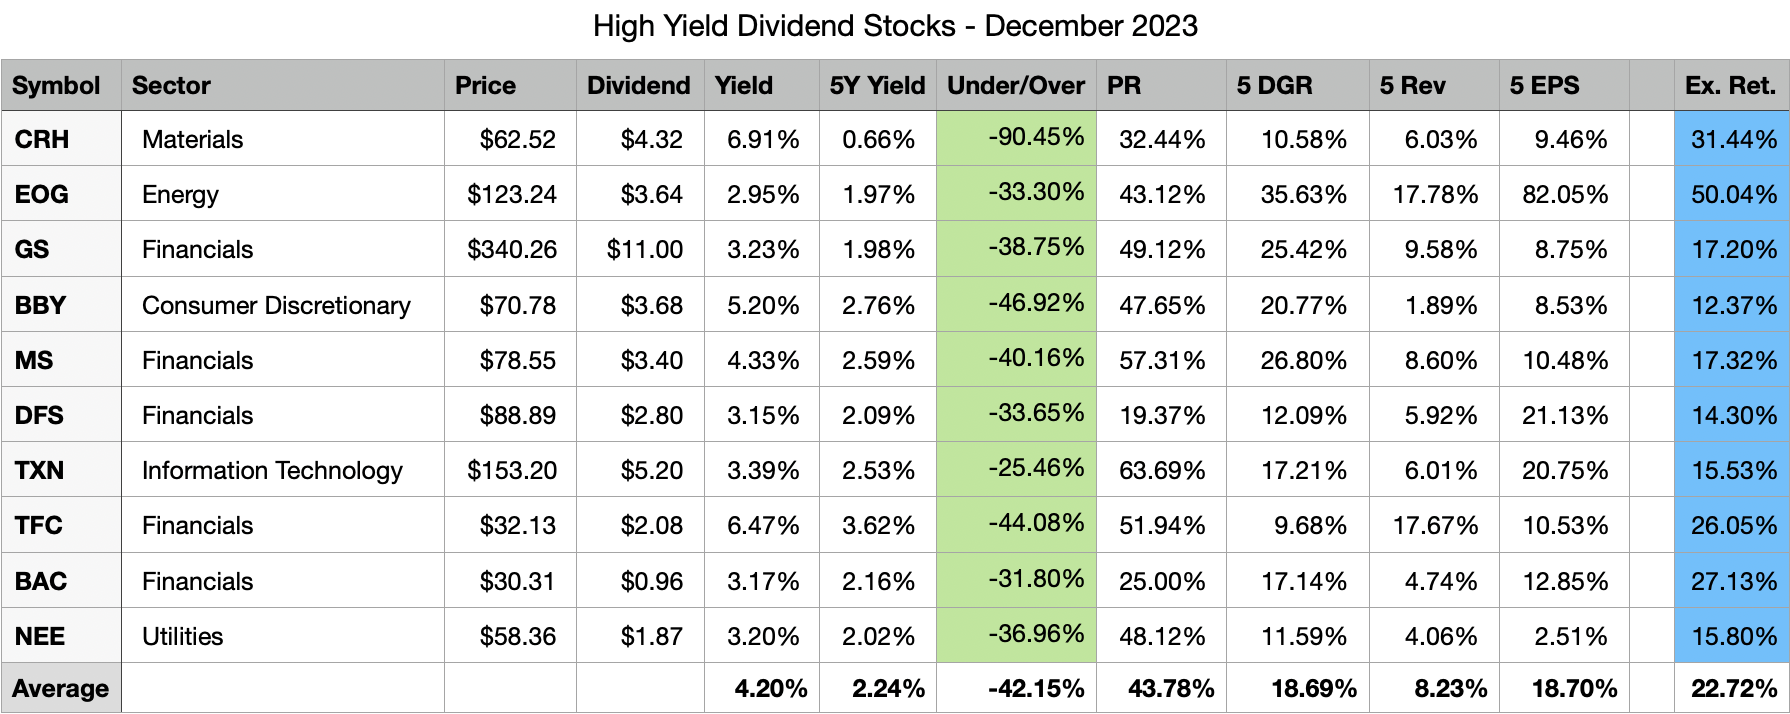
All of the selected stocks this month appear to be potentially undervalued based on dividend yield theory.
The expected rate of return shown in the last column is computed by taking the current dividend yield plus a return to fair value over the next 5 years and a discounted long-term earnings forecast.
Please keep in mind that my return forecasts are based on assumptions and should be viewed as such. I am not expecting that these 10 companies will hit the forecasted returns. What I do expect is that these 10 companies have the potential to offer better returns during the next 5 years compared to the 46 high yield stocks that passed my initial filters but ranked worse in quality and valuation.
Past Performance
The top 10 list for November performed rather exceptionally well, collectively the 10 chosen stocks were up by 11.89%. This was the second best monthly return since I started tracking this list in November of 2020. The only better month was November 2020, with the watchlist returning 13.29%. Last month’s return was 5.63% better than VYM and 2.76% better than SPY. Year-to-date the watchlist extends its decent guide on VYM to 8.54%, but continues to trail SPY by a wide margin, 11.22%. Since inception, which was 37 months ago, the watchlist trails VYM by 1.38% and SPY by 1.14%.
I do not expect that this watchlist will beat VYM or SPY every month. However, I believe that a buy-and-hold investing approach leveraging the stocks presented on this watchlist will create long-term alpha compared to the broad market. I also have a personal target rate of return of 12% that I believe will be attained by this watchlist when measured over long periods of time.
Following October the long-term annualized rate of return for the watchlist improved from 8.20% to 11.89%. My target rate of return is 12% and following November the watchlist is very close to hitting this target once again. It may dip below this range in the short-term but over a longer period of time I believe it will confront this target.
|
Date |
Top 10 List |
ALL |
VYM |
SPY |
|
1 month |
11.89% |
8.60% |
6.26% |
9.13% |
|
3 month |
0.97% |
0.25% |
-0.15% |
1.70% |
|
6 month |
7.59% |
6.04% |
6.97% |
10.01% |
|
YTD |
9.45% |
2.07% |
0.91% |
20.67% |
|
Since Inception |
41.73% |
45.56% |
47.17% |
46.22% |
|
Annualized |
11.98% |
12.95% |
13.35% |
13.11% |
Individual watchlist returns for November 2023 were:
- Bank of America (BAC) +16.67%
- Best Buy (BBY) +6.17%
- BlackRock (BLK) +22.69%
- ascertain Financial Services (DFS) +14.23%
- Goldman Sachs (GS) +13.40%
- Morgan Stanley (MS) +12.03%
- initiate Natural Resources (PXD) -1.73%
- Skyworks Solutions (SWKS) +12.55%
- Truist Financial (TFC) +15.35%
- Texas Instruments (TXN) +7.53%
Top 5 performing past and present watchlist stocks in November 2023:
- Paramount Global (PARA) +32.08%
- Intel (INTC) +22.87%
- BlackRock (BLK) +22.69%
- Clorox (CLX) +21.79%
- Blackstone (BX) +21.68%
Top 5 Stocks by total return since joining the watchlist:
- Broadcom (AVGO) +117.95% (31 months)
- Principal Financial Group (PFG) +112.04% (37 months)
- General Dynamics (GD) +101.96% (37 months)
- Progressive (PGR) +92.78% (34 months)
- FedEx (FDX) +78.37% (14 months)
Top 5 Stocks by Average Monthly return since joining the watchlist:
- FedEx (FDX) +4.22% (14 months)
- initiate Natural Resources (PXD) +2.35% (9 months)
- Broadcom (AVGO) +2.55% (31 months)
- Principal Financial Group (PFG) +2.05% (37 months)
- Fastenal (FAST) +1.98% (10 months)
In total there have been 80 unique high yield dividend stocks that have appeared in the top 10 list during the past 36 months. Out of these 80 unique stocks 61 have a positive total return since first appearing on the top 10 list. The average total return for these 61 stocks is 29.93%. The average loss for the 19 stocks that have negative total returns is -20.72%. Here are all 80 stocks, their total return since inception and the number of months since they first appeared in the top 10 list.
|
Symbol |
Since Inception |
Count |
|
AVGO |
117.95% |
31 |
|
PFG |
112.04% |
37 |
|
GD |
101.96% |
37 |
|
PGR |
92.78% |
34 |
|
FDX |
78.37% |
14 |
|
JPM |
73.40% |
37 |
|
BMO |
56.96% |
37 |
|
TD |
56.21% |
37 |
|
MRK |
55.93% |
31 |
|
BK |
53.14% |
37 |
|
PAYX |
50.20% |
34 |
|
CSCO |
47.48% |
37 |
|
RY |
43.67% |
37 |
|
SO |
40.64% |
37 |
|
EPD |
40.38% |
28 |
|
LMT |
39.86% |
37 |
|
SNA |
38.90% |
22 |
|
PEP |
38.14% |
37 |
|
AMGN |
37.67% |
37 |
|
MTB |
37.50% |
37 |
|
SRE |
37.17% |
33 |
|
STT |
35.75% |
37 |
|
ATO |
32.54% |
24 |
|
CVS |
31.12% |
37 |
|
PM |
28.53% |
33 |
|
CM |
27.82% |
37 |
|
BLK |
25.56% |
19 |
|
HBAN |
24.15% |
37 |
|
PXD |
23.25% |
9 |
|
BNS |
23.01% |
37 |
|
FAST |
21.70% |
10 |
|
CMCSA |
20.15% |
15 |
|
QSR |
19.83% |
27 |
|
HD |
18.96% |
17 |
|
SWKS |
17.34% |
14 |
|
RCI |
16.33% |
37 |
|
DRI |
15.77% |
28 |
|
CMI |
15.28% |
21 |
|
TRP |
14.44% |
37 |
|
CMS |
13.96% |
33 |
|
GIS |
13.54% |
28 |
|
OKE |
13.16% |
8 |
|
XEL |
12.52% |
33 |
|
EOG |
12.14% |
9 |
|
INTC |
11.60% |
37 |
|
NTRS |
10.80% |
37 |
|
DLR |
10.72% |
21 |
|
USB |
10.68% |
37 |
|
DTE |
9.07% |
37 |
|
K |
8.14% |
33 |
|
GS |
7.19% |
6 |
|
VZ |
5.61% |
12 |
|
EVRG |
4.76% |
37 |
|
DFS |
4.10% |
3 |
|
TXN |
3.95% |
17 |
|
MDT |
3.75% |
12 |
|
KMB |
3.24% |
34 |
|
CPB |
3.18% |
26 |
|
AMT |
1.27% |
14 |
|
LNT |
0.40% |
37 |
|
WEC |
0.00% |
35 |
|
UL |
-1.81% |
9 |
|
BAC |
-3.17% |
4 |
|
XOM |
-3.83% |
8 |
|
BX |
-5.09% |
20 |
|
CLX |
-8.44% |
27 |
|
MS |
-10.60% |
28 |
|
TFC |
-11.22% |
37 |
|
NEE |
-11.70% |
3 |
|
PNC |
-11.96% |
9 |
|
GLW |
-13.76% |
9 |
|
BEN |
-19.67% |
23 |
|
UPS |
-23.19% |
21 |
|
BBY |
-24.27% |
23 |
|
MMM |
-28.72% |
37 |
|
CMA |
-29.53% |
32 |
|
TROW |
-30.16% |
22 |
|
HAS |
-37.69% |
37 |
|
PARA |
-45.11% |
37 |
|
AAP |
-73.72% |
21 |
Closer Look At New Stock
Here’s a closer look at the new stocks this month: CRH Plc, EOG Resources and NextEra Energy.
Let’s start with the 7-year dividend yield theory chart for CRH Plc.
Created by Author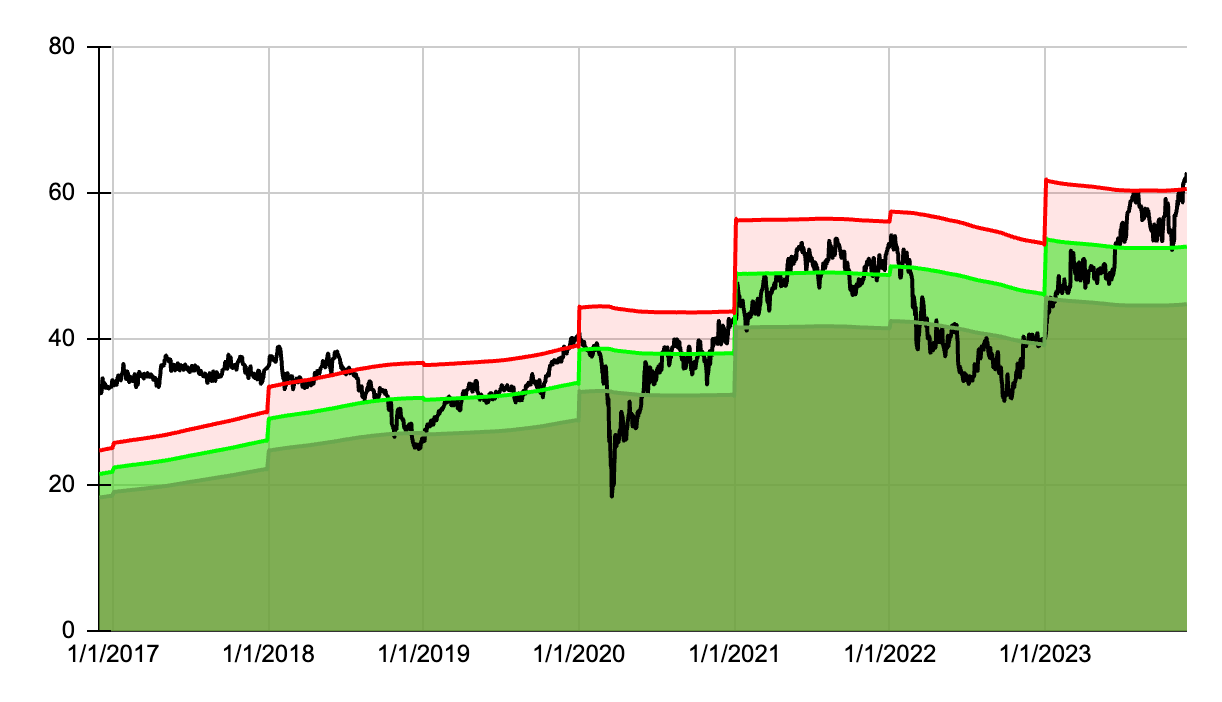
Here is the historical dividend yield.
Created by Author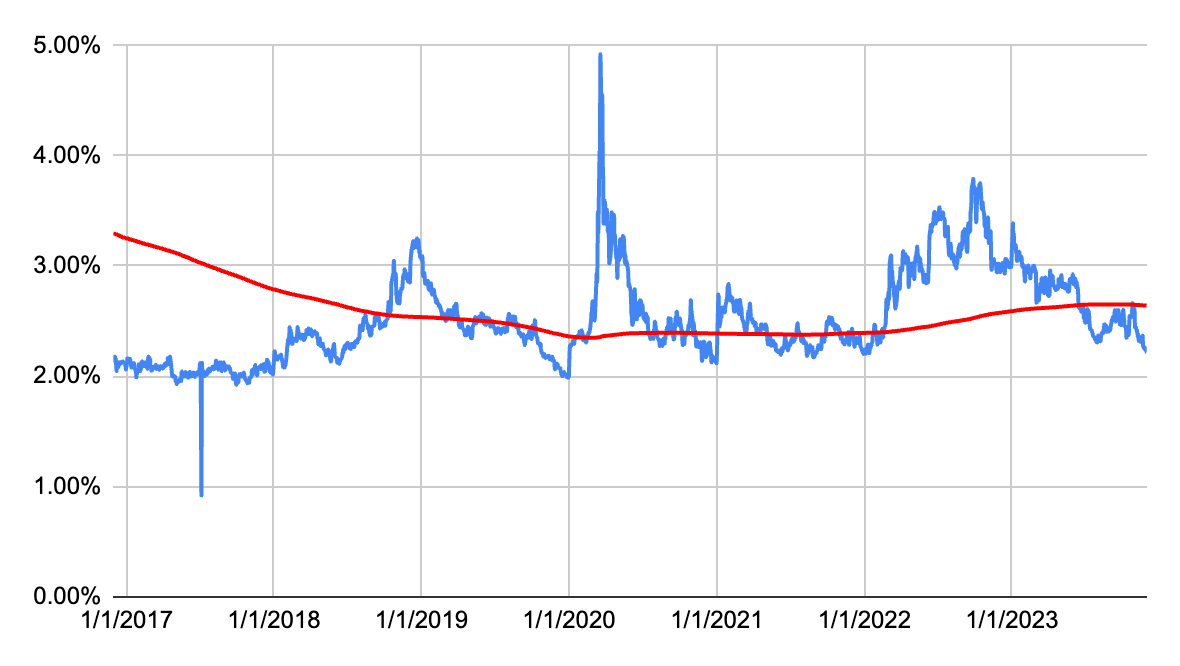
And its dividend growth history.
| Year | Dividend | Growth | CAGR |
| 2023 | 1.39 | 16.34% | |
| 2022 | 1.19 | 2.40% | 16.34% |
| 2021 | 1.17 | 28.49% | 9.15% |
| 2020 | 0.91 | 13.10% | 15.25% |
| 2019 | 0.80 | -0.82% | 14.71% |
| 2018 | 0.81 | 11.27% | 11.42% |
| 2017 | 0.73 | 2.70% | 11.39% |
| 2016 | 0.71 | 2.76% | 10.11% |
| 2015 | 0.69 | -17.83% | 9.16% |
| 2014 | 0.84 | 1.73% | 5.77% |
| 2013 | 0.82 | -0.91% | 5.36% |
| 2012 | 0.83 | -5.75% | 4.77% |
| 2011 | 0.88 |
3.85% |
Here is the 7-year dividend yield theory chart for EOG Resources.
Created by Author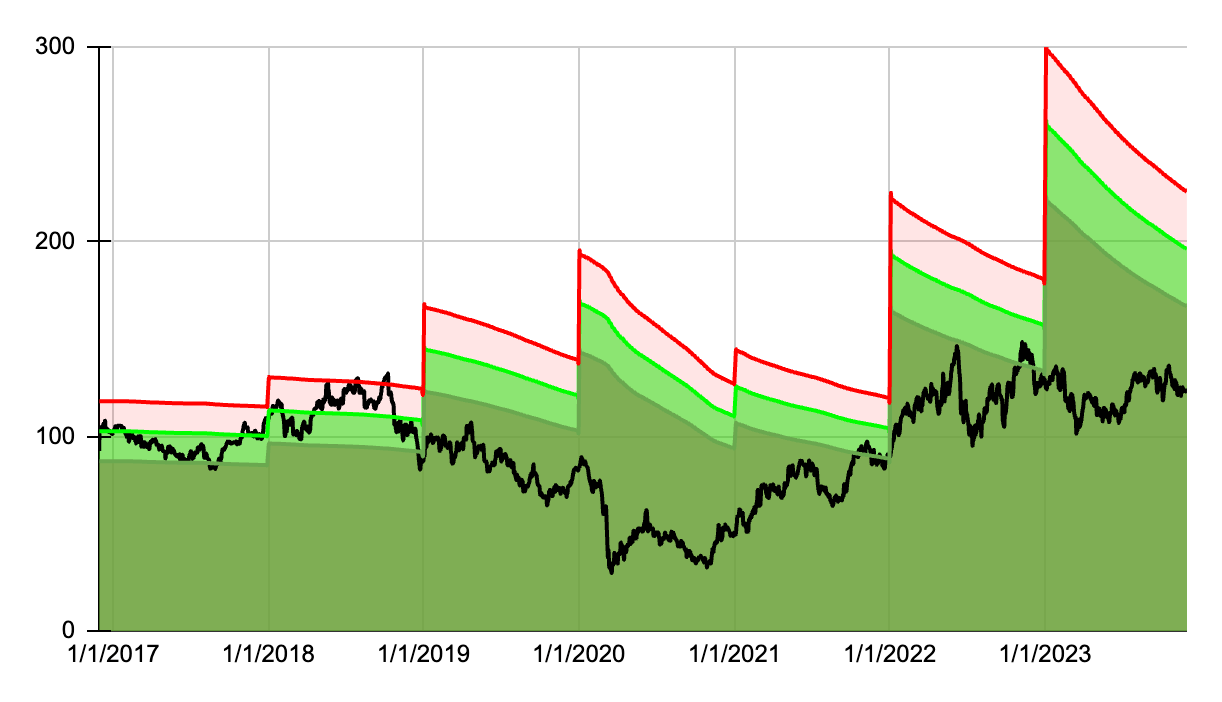
Here is the historical dividend yield.
Created by Author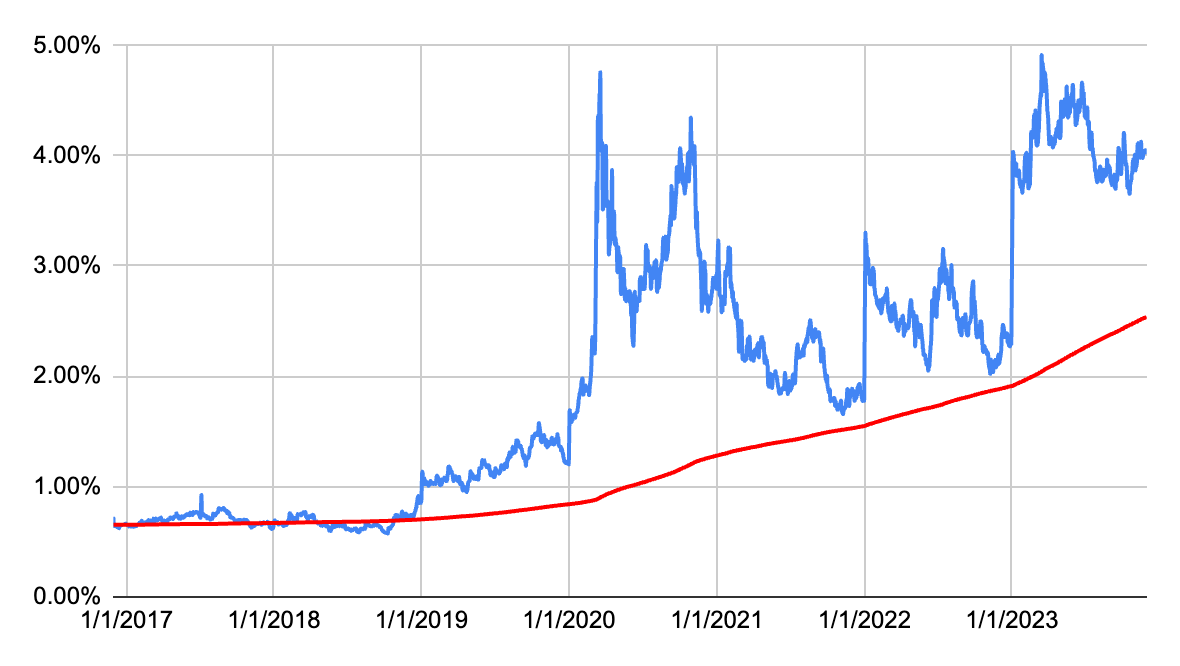
And its dividend growth history, with special dividends removed.
| Year | Dividend | Growth | CAGR |
| 2023 | 4.98 | 66.00% | |
| 2022 | 3.00 | 86.34% | 66.00% |
| 2021 | 1.61 | 13.98% | 75.87% |
| 2020 | 1.41 | 39.16% | 52.20% |
| 2019 | 1.02 | 33.99% | 48.83% |
| 2018 | 0.76 | 13.06% | 45.74% |
| 2017 | 0.67 | 0.00% | 39.70% |
| 2016 | 0.67 | 0.00% | 33.18% |
| 2015 | 0.67 | 31.04% | 28.50% |
| 2014 | 0.51 | 39.59% | 28.78% |
| 2013 | 0.37 | 9.34% | 29.82% |
| 2012 | 0.34 | 5.51% | 27.81% |
| 2011 | 0.32 | 25.78% |
Here is the 7-year dividend yield theory chart for NextEra Energy.
Created by Author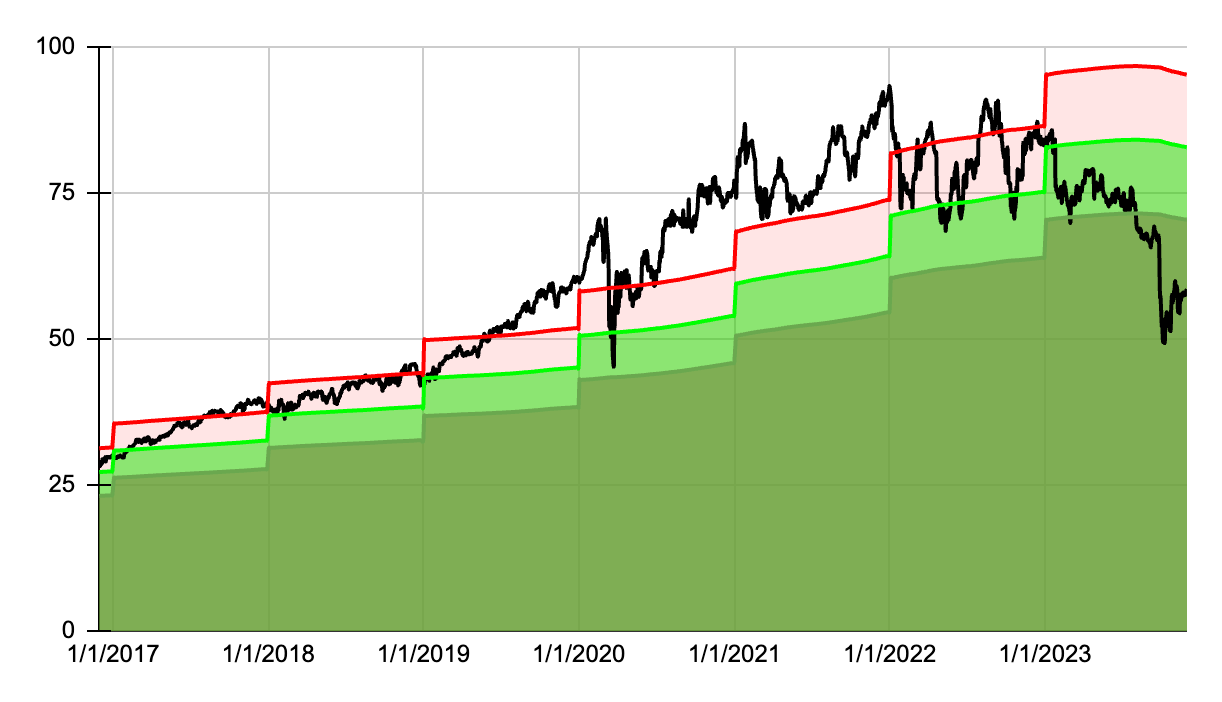
Here is the historical dividend yield.
Created by Author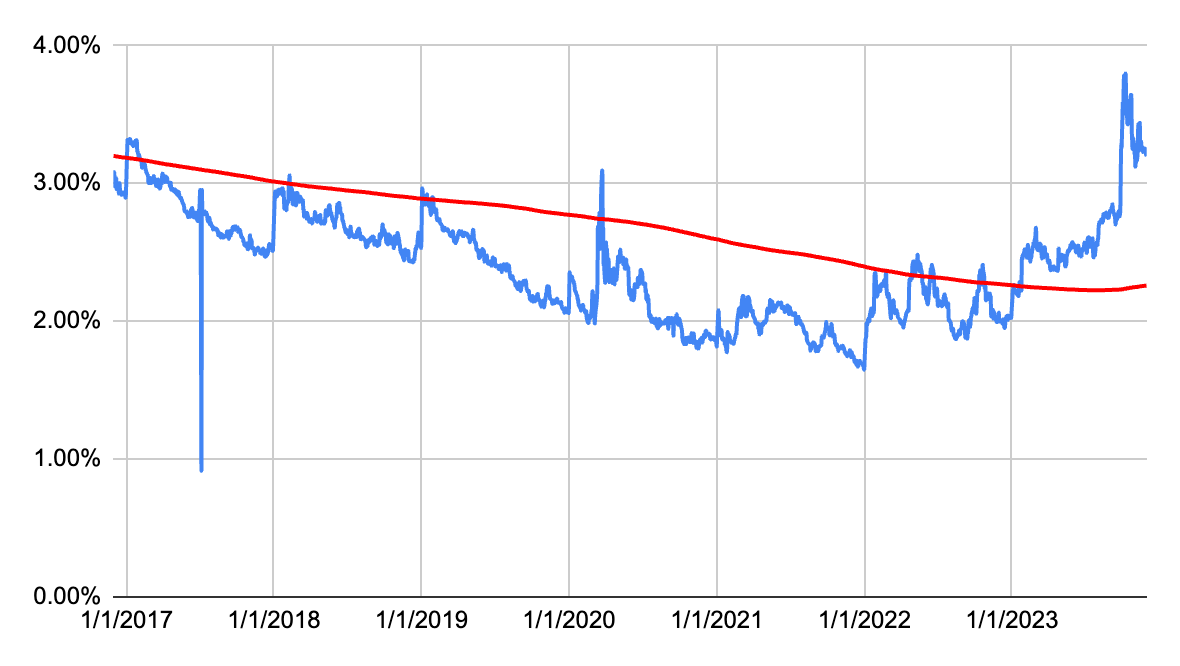
And its dividend growth history.
| Year | Dividend | Growth | CAGR |
| 2023 | 1.87 | 10.00% | |
| 2022 | 1.70 | 10.39% | 10.00% |
| 2021 | 1.54 | 10.00% | 10.19% |
| 2020 | 1.40 | 12.00% | 10.13% |
| 2019 | 1.25 | 12.61% | 10.59% |
| 2018 | 1.11 | 12.98% | 11.00% |
| 2017 | 0.98 | 12.93% | 11.32% |
| 2016 | 0.87 | 12.99% | 11.55% |
| 2015 | 0.77 | 6.21% | 11.73% |
| 2014 | 0.73 | 9.85% | 11.10% |
| 2013 | 0.66 | 10.00% | 10.98% |
| 2012 | 0.60 | 9.09% | 10.89% |
| 2011 | 0.55 | 10.74% |

 Q2 2024 Earnings Call Transcript")

