Olivier Le Moal
To be upfront, I have long admired Boaz Weinstein, the portfolio manager for the Saba Closed-End Funds ETF (BATS:CEFS). Mr. Weinstein is one of the most well-known hedge fund managers in the past decade and was the youngest ever managing director at Deutsche Bank prior to starting Saba Capital. Saba Capital was named Risk.net’s hedge fund of the year in 2021 for successfully navigating the COVID crisis and its aftermath.
I admire Mr. Weinstein and Saba Capital not only for their astute investment acumen, but also for their outspoken criticism of underperforming closed-end funds, of which I have reviewed many since taking up the pen last year.
While fund management groups like Franklin Templeton seem content to collect fat fees on grossly underperforming funds like the Templeton Global Income Fund (GIM), with a -1.2% average annual return over 10 years, Mr. Weinstein and Saba Capital are actually investing their own capital into underperforming funds and agitating for change within the closed-end fund industry.
The CEFS ETF allows investors to leverage Saba’s deep expertise in picking and hedging closed-end funds. CEFS’ investment results speak for themselves, as the fund has significantly outperformed passive closed-end fund-of-fund ETFs over a 1/3/5 year timeframe. It has also matched a balanced fund’s total returns with significantly higher income. I rate the CEFS ETF a buy.
Fund Overview
The Saba Closed-End Funds ETF is an actively managed ETF that aims to generate high current income from investing in closed-end funds trading at a discount to their net asset values (“NAV”), with interest rate hedges to protect the fund from rising interest rates.
The CEFS ETF allows retail investors to invest alongside Saba Capital’s fund managers who have years of experience trading and hedging closed-end funds.
CEFS’ investment process includes proprietary screens that analyze closed-end funds across a variety of factors including yield, discount to NAV, and quality of underlying securities. The CEFS ETF will also actively trade the portfolio holdings in order to capture widening and narrowing discounts to NAV.
The CEFS ETF has $123 million in assets and charges a 1.1% management fee. Including acquired fees from the underlying closed-end funds, the CEFS ETF has a total expense ratio of 2.42% (Figure 1).
Figure 1 – CEFS overview (sabaetf.com)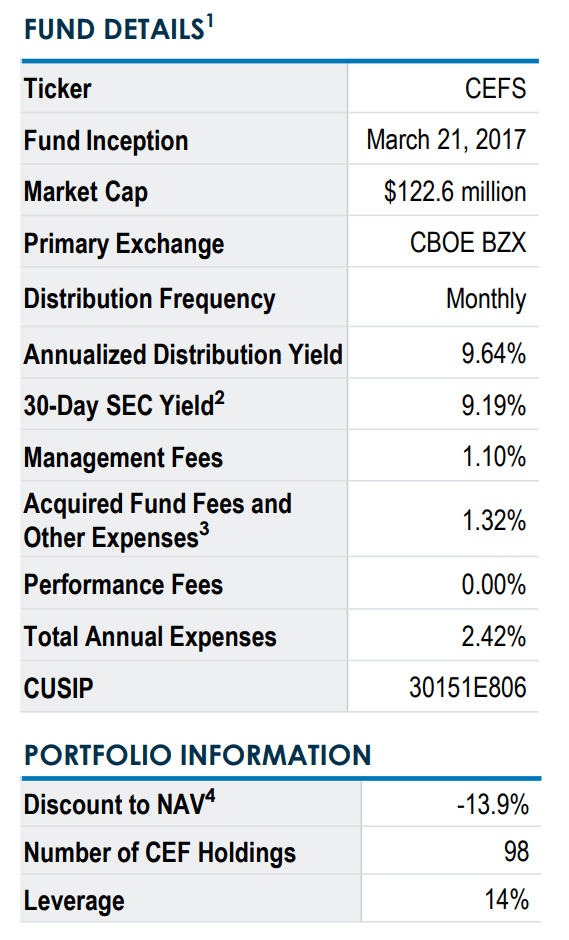
Portfolio Holdings
CEFS’ portfolio contains 98 closed-end fund holdings with an average discount to NAV of 13.9%. In terms of asset class allocation, 55% of the underlying funds are considered equity funds, while 45% are fixed income funds (Figure 2).
Figure 2 – CEFS asset class allocation (sabaetfs.com)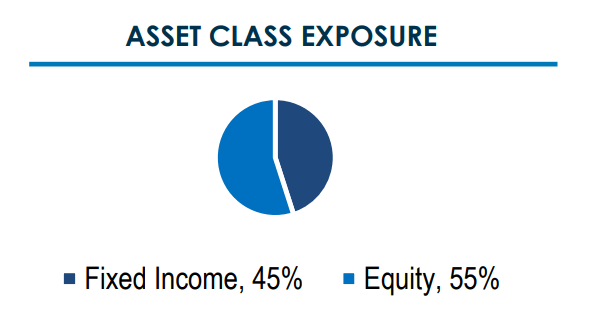
Figure 3 shows the top 10 holdings of the CEFS ETF, which account for 67.8% of the portfolio.
Figure 3 – CEFS top 10 holdings (sabaetfs.com)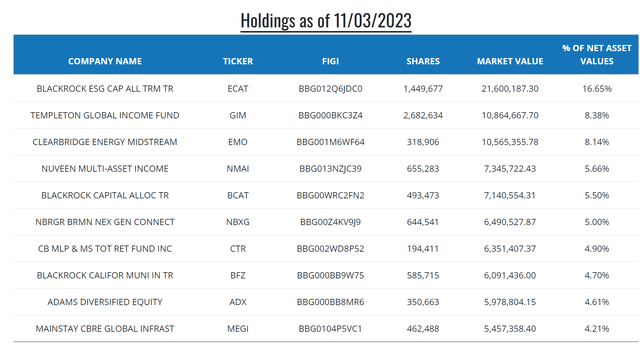
Investors should note that some of these positions involve funds like the BlackRock funds in which Saba Capital is involved in activist battles, while others, like the Adams Diversified Equity Fund (ADX), do not appear to have any active proxy litigation to date.
Distribution & Yield
One of the main features of closed end funds is their high distribution yields. That is the main reason why many retirees swear by them to fund their retirement lifestyles.
Unfortunately, too often, we come across closed-end funds like the Templeton Global Income Fund that promises investors a 9.0% distribution yield, but has actually earned an average annual return of -1.2% over 10 years (Figure 4).
Figure 4 – GIM historical returns (morningstar.com)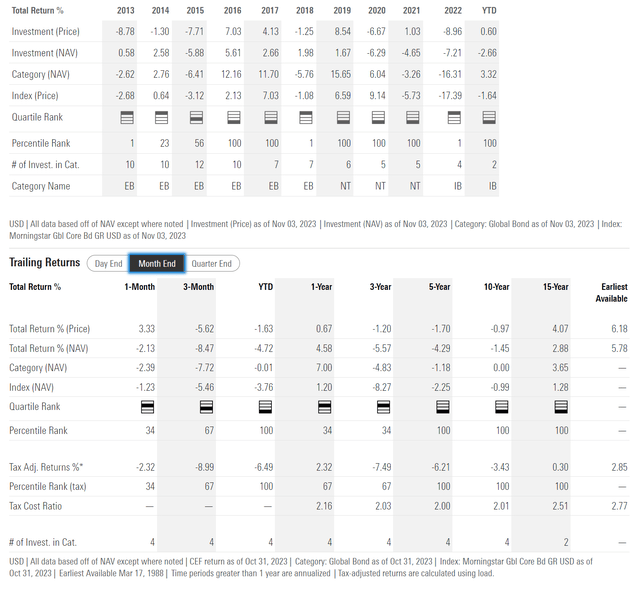
In effect, investors are just paid back their own capital in the form of the distribution. Over time, investors in these amortizing ‘return of principal’ funds lose out on both principal (from NAV liquidated to pay the distribution) and income (distributions shrink as NAV declines).
For example, over the past decade, GIM’s NAV and share price have declined by 51.2% and 51.7% respectively (Figure 5)
Figure 5 – GIM’s NAV has shrunk by 50% over a decade (morningstar.com)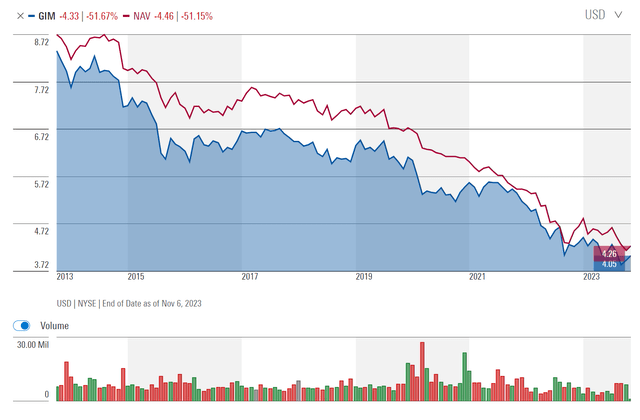
Annual distributions for the GIM fund has also scaled lower from $0.67 in 2013 to $0.36 in the trailing twelve months (Figure 6).
Figure 6 – GIM’s distribution has scaled lower in line with NAV declines (Seeking Alpha)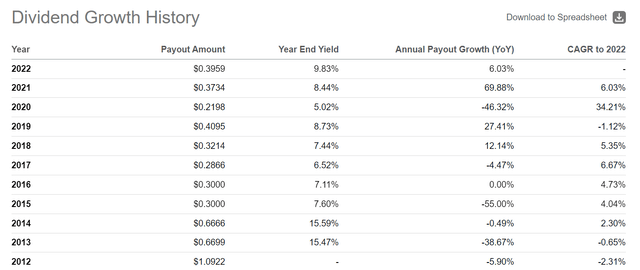
Fortunately, the Saba Closed-End Funds ETF appears to do a much better job of earning returns to fund its generous 10.1% distribution rate (Figure 7), as the CEFS ETF has delivered annualized returns of 7.6% since inception to September 30, 2023.
Figure 7 – CEFS pay a 10.1% distribution rate (sabaetfs.com) Figure 8 – CEFS earn a solid 7.6% annual return to fund its distribution (sabaetfs.com)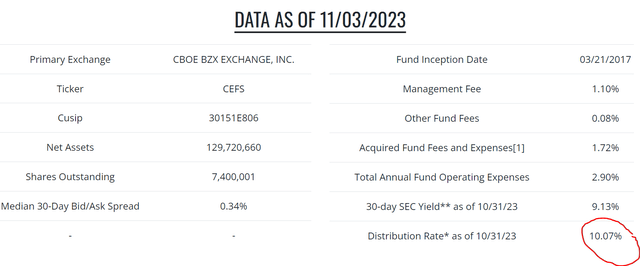

CEFS May Be Better Than Balanced Funds
Another way we can think about the CEFS ETF is to compare it to the traditional 60/40 portfolio that has been the core holding of many investors’ portfolios.
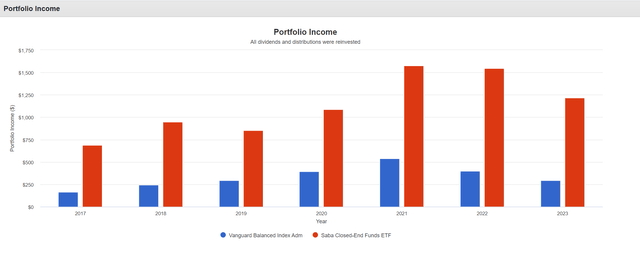
Since inception, the CEFS ETF has delivered comparable returns to the Vanguard Balanced Index Fund (VBIAX) (Figure 9) while generating significantly higher portfolio income (Figure 10).
Figure 9 – CEFS has delivered total returns similar to VBIAX (Author created with portfolio visualizer) Figure 10 – With significantly higher income (Author created using Portfolio Visualizer)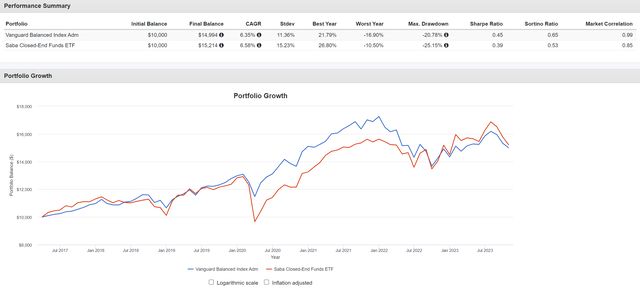
However, one drawback of CEFS is it is more volatile, with a portfolio volatility of 15.2% compared to 11.4% for VBIAX.
Comparing CEFS To Peers
In the past, I have written about the Invesco CEF Income Composite ETF (PCEF) and the Amplify High Income ETF (YYY), both of which use a passive fund-of-funds approach to invest in closed-end funds. How does CEFS compare against these two peers?
First, in terms fee structure, CEFS is definitely not the cheapest, with a total expense ratio of 2.42% compared to 1.99% for PCEF (Figure 11).
Figure 11 – CEFS vs. peers, fee structure (Seeking Alpha)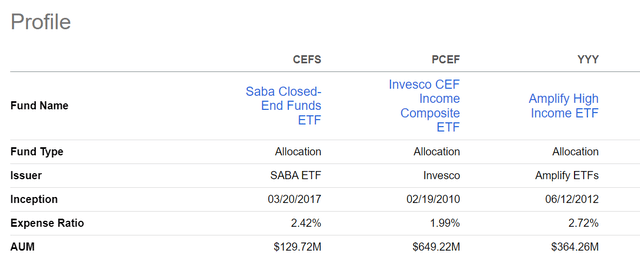
However, CEFS makes up for higher expenses with significantly higher total returns, with CEFS returning 12.3% on a 1 year horizon vs. 2.5% for PCEF and 7.3% for YYY (Figure 12).
Figure 12 – CEFS vs. peers, 1 year total returns (Seeking Alpha)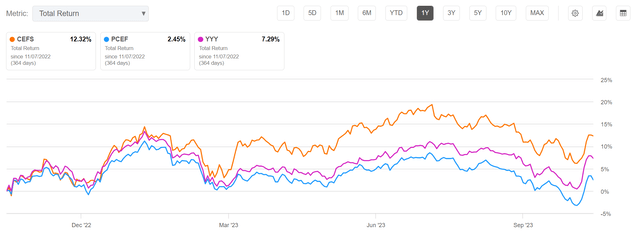
On a 3 year horizon, CEFS’ outperformance is even more extreme, with a 27.0% total return compared to 4.9% for PCEF and 3.1% for YYY (Figure ).
Figure 13 – CEFS vs. peers, 3 year total returns (Seeking Alpha)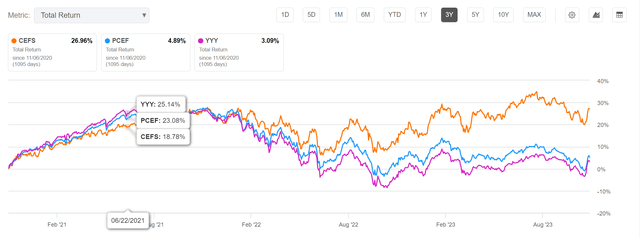
Ditto for 5 years (Figure 14).
Figure 14 – CEFS vs. peers, 5 year total returns (Seeking Alpha)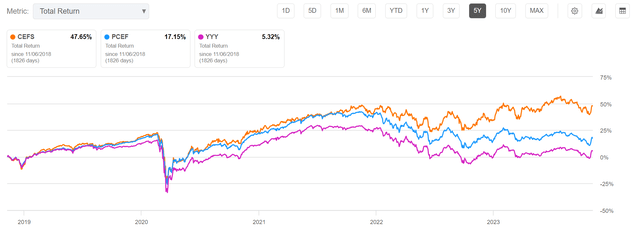
Saba’s managers have definitely displayed significant alpha in picking the right CEFs and hedging their interest rate risks with derivatives.
Conclusion
The Saba Closed-End Funds ETF allow investors to invest right alongside Saba Capital’s award winning portfolio managers. Historically, the CEFS ETF has matched a 60/40 balanced fund in terms of total returns while distributing significantly higher income. Compared to passive closed-end fund-of-fund ETFs like PCEF and YYY, the CEFS ETF has displayed significant alpha over all measurement timeframes.
I would recommend the CEFS ETF for income-oriented investors seeking exposure to a portfolio of closed-end funds.


