
shapecharge
Capital Southwest (NASDAQ:CSWC), a prominent investment firm, is scheduled to release Q2 2024 earnings results on October 30, 2023. Investors closely watch the expected earnings per share (EPS) of $0.65, especially given the company’s history of outperforming market expectations. In Q1 2024, Capital Southwest displayed a solid financial foundation with its credit portfolio and an equity portfolio that reflects a firm financial footing. This article delves into a technical examination of Capital Southwest’s stock price to determine its future trajectory and potential investment prospects. Notably, while the stock sustains its long-term upward trend, there’s a possibility of a short-term dip. The Q2 2024 earnings announcement will be a pivotal factor in guiding the stock’s subsequent price movement.
Financial Outlook
Capital Southwest is scheduled to unveil its quarterly earnings report on October 30, 2023. Market experts anticipate the company to report an EPS of $0.65. Supporters of Capital Southwest are not only keen to see outcomes that exceed these forecasts but also hopeful for optimistic projections in the next quarter. During Q1 2024, the forecasted EPS was $0.63, but the actual figure reached $0.65, instigating a 3.88% price adjustment next day. In Q4 2023, the predicted EPS was $0.61, and the company achieved an EPS of $0.65, causing a minimal price shift of 0.22%. For Q3 2023, while the EPS forecast was $0.56, the actual was $0.62, translating to a 4.7% stock price change. In Q2 2023, both projected and realized EPS stood at $0.52, leading to a 2.39% price change. With such consistently affirmative outcomes, long-standing stakeholders are likely optimistic about the forthcoming earnings announcement. Nevertheless, initial reactions post-release could stir volatility, potentially driving the stock price towards a technical support level—a scenario that may be perceived as a golden buying opportunity by investors.
For Q1 2024, Capital Southwest reported a robust financial performance. The company’s total investment portfolio stood at $1.3 billion, of which $1.1 billion was attributed to its credit portfolio, comprising 97% of 1st Lien Senior Secured Debt. The credit portfolio witnessed an infusion of $108.0 million in new committed credit investments. Furthermore, the weighted average yield on debt investments was 12.9%, with current non-accruals having a fair value of $22.4 million, representing 1.7% of the total investment portfolio. In addition, Capital Southwest’s equity portfolio, excluding its investment in the I-45 Senior Loan Fund (I-45 SLF), was pegged at $122.5 million, with $3.9 million designated for new equity co-investments.
Capital Southwest’s investment in the I-45 SLF was valued at $51.9 million, with the I-45 SLF portfolio worth $131.7 million. This portfolio, which encompasses 33 issuers, primarily consists of 95% 1st Lien Debt. The I-45 SLF had an outstanding debt of $78.0 million and a fund leverage ratio of 1.20x debt to equity at fair value. Notably, the I-45 SLF dispensed a $2.1 million quarterly dividend to Capital Southwest, translating to an annualized yield of 16.5%. Overall, Capital Southwest’s pre-tax net investment income for the quarter was $25.0 million, or $0.67 per weighted average share outstanding. The company announced dividends, comprising a regular dividend of $0.54 per share and a supplemental dividend of $0.05, resulting in total dividends of $0.59 per share for Q1 2024.
Bowen Diehl, the President and CEO, expressed that Q1 2024 was a significant period for Capital Southwest. The company realized solid originations in six new and seven existing portfolio companies. The well-performing portfolio generated $0.67 of pre-tax net investment income for the quarter, adequately covering the regular and supplemental dividends. On the capitalization side, the company raised $45.6 million through its equity at-the-market program at 110% of the prevailing NAV per share during the quarter.
Technical Outlook
The long-term technical forecast for Capital Southwest appears decidedly bullish, as illustrated in the monthly chart below. The chart depicts a rounding bottom formation over an extended timeframe. A low point of $1.78 was recorded in 2009, serving as a base for a robust uptrend in the following years. In 2014, the rounding bottom’s neckline was breached at around $6, leading to a surge in price. Notably, post-2014, there was a significant dip back to the $6 neckline, presenting prime buying opportunities for long-term investors – first in 2016 and again in 2020. Both opportunities culminated in a strong market rally, reaching record highs of $23.35.
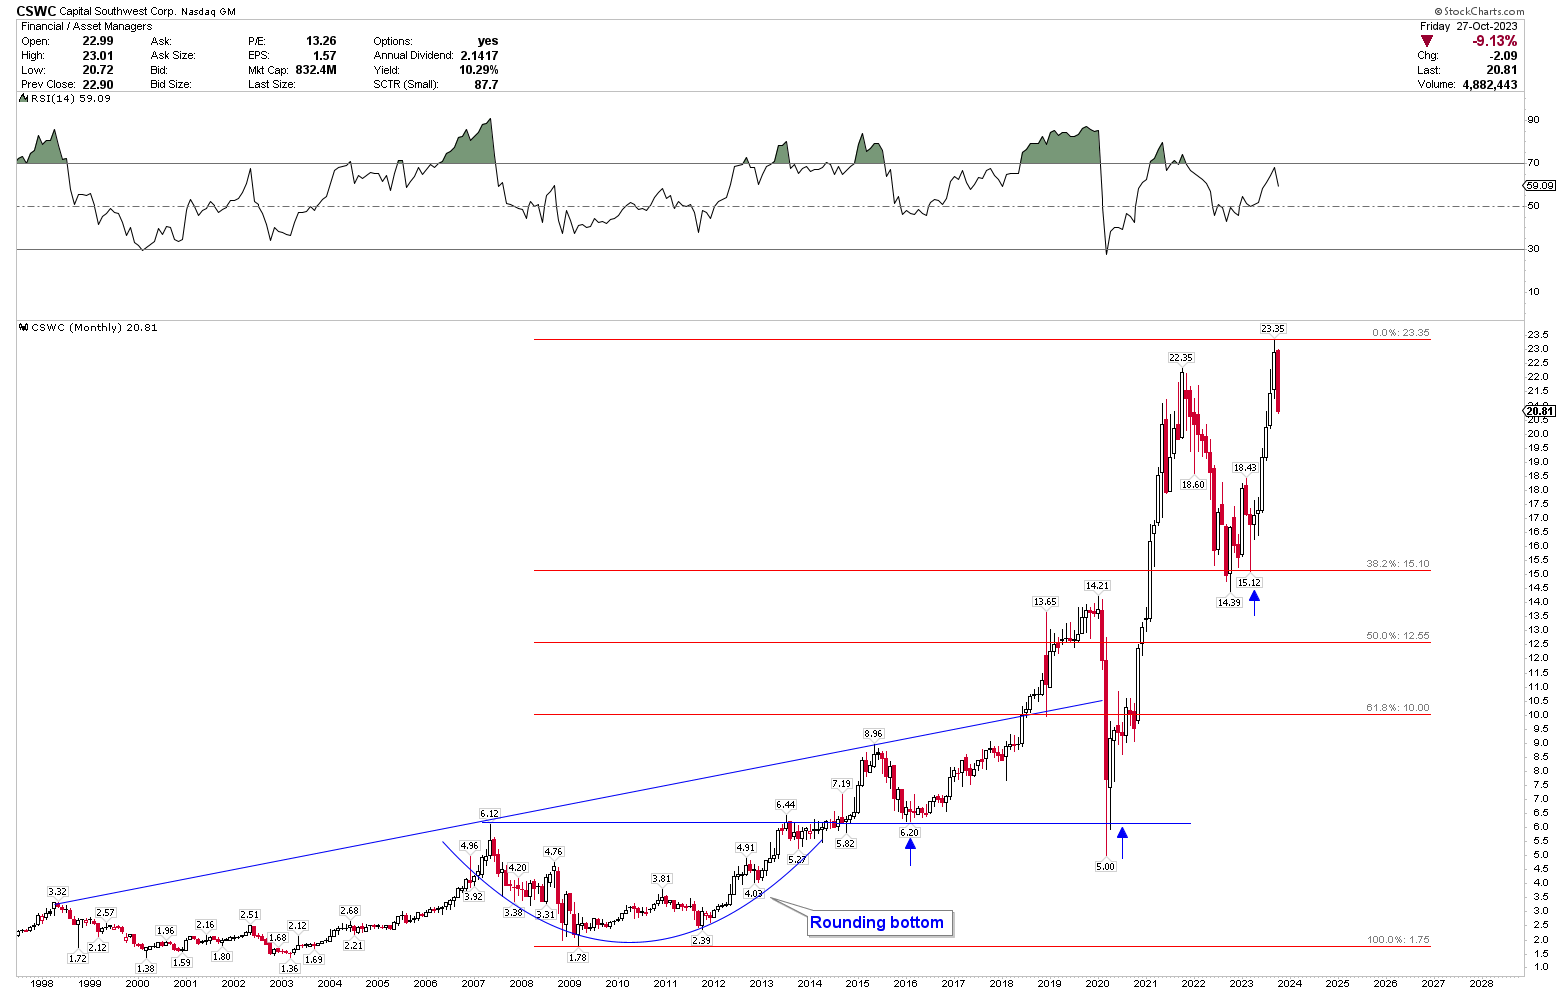
CSWC Monthly Chart (StockCharts.com)
The robust price trajectory for Capital Southwest is attributed to the bounce-back from the 2009 financial downturn and various influential factors. Post-2009, the U.S. economy expanded, bolstered by proactive monetary policies, paving the way for a conducive financial environment for businesses.
The monthly chart also features the Fibonacci retracement, spanning from the 2009 low of $1.78 to the peak of $23.35. Observations suggest that if the market undergoes a pullback from current levels, immediate price support can be expected at around $15, corresponding to the 38.2% Fibonacci retracement. The negative performance for October 2023 hints at a potential pause in the uptrend, with a possibility of a temporary correction before a subsequent rise.
Moreover, the weekly chart below further elucidates this with an inverted head and shoulder pattern, pinpointing the head at $14.39 and shoulders at $15.31 and $15.12. This pattern’s neckline breached around $18, leading to a price surge. The last month’s weekly candles, however, hint at a downturn, signaling potential corrections. An “inside week” candle formation, which broke to the downside, implies the market is accumulating momentum and potentially leaning downward. If the decline persists, solid support is anticipated around the $18 neckline of the inverted head and shoulder. The weekly RSI also signals a potential correction from an overbought zone.
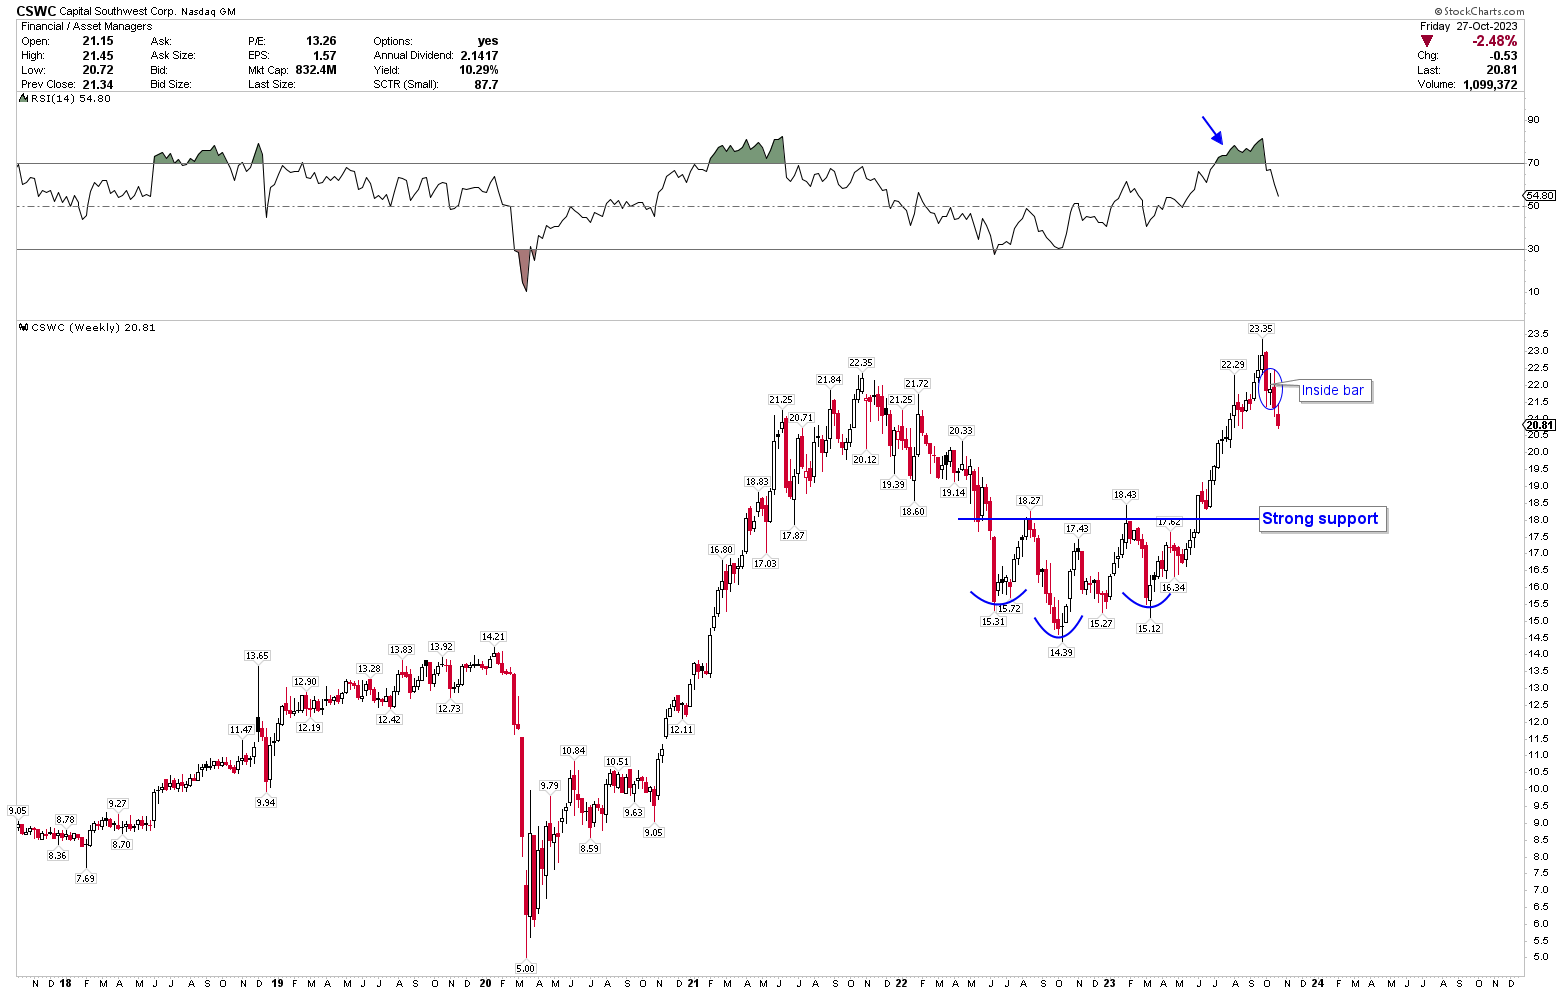
CSWC Weekly Chart (StockCharts.com)
The recent downward trend is also evident in the daily chart, showcasing a head and shoulders pattern. Here, the head is at $23.25, and the shoulders are at $22.294 and $22.470. The neckline is $20, and a weekly close beneath this could pave the way for an extended decline.
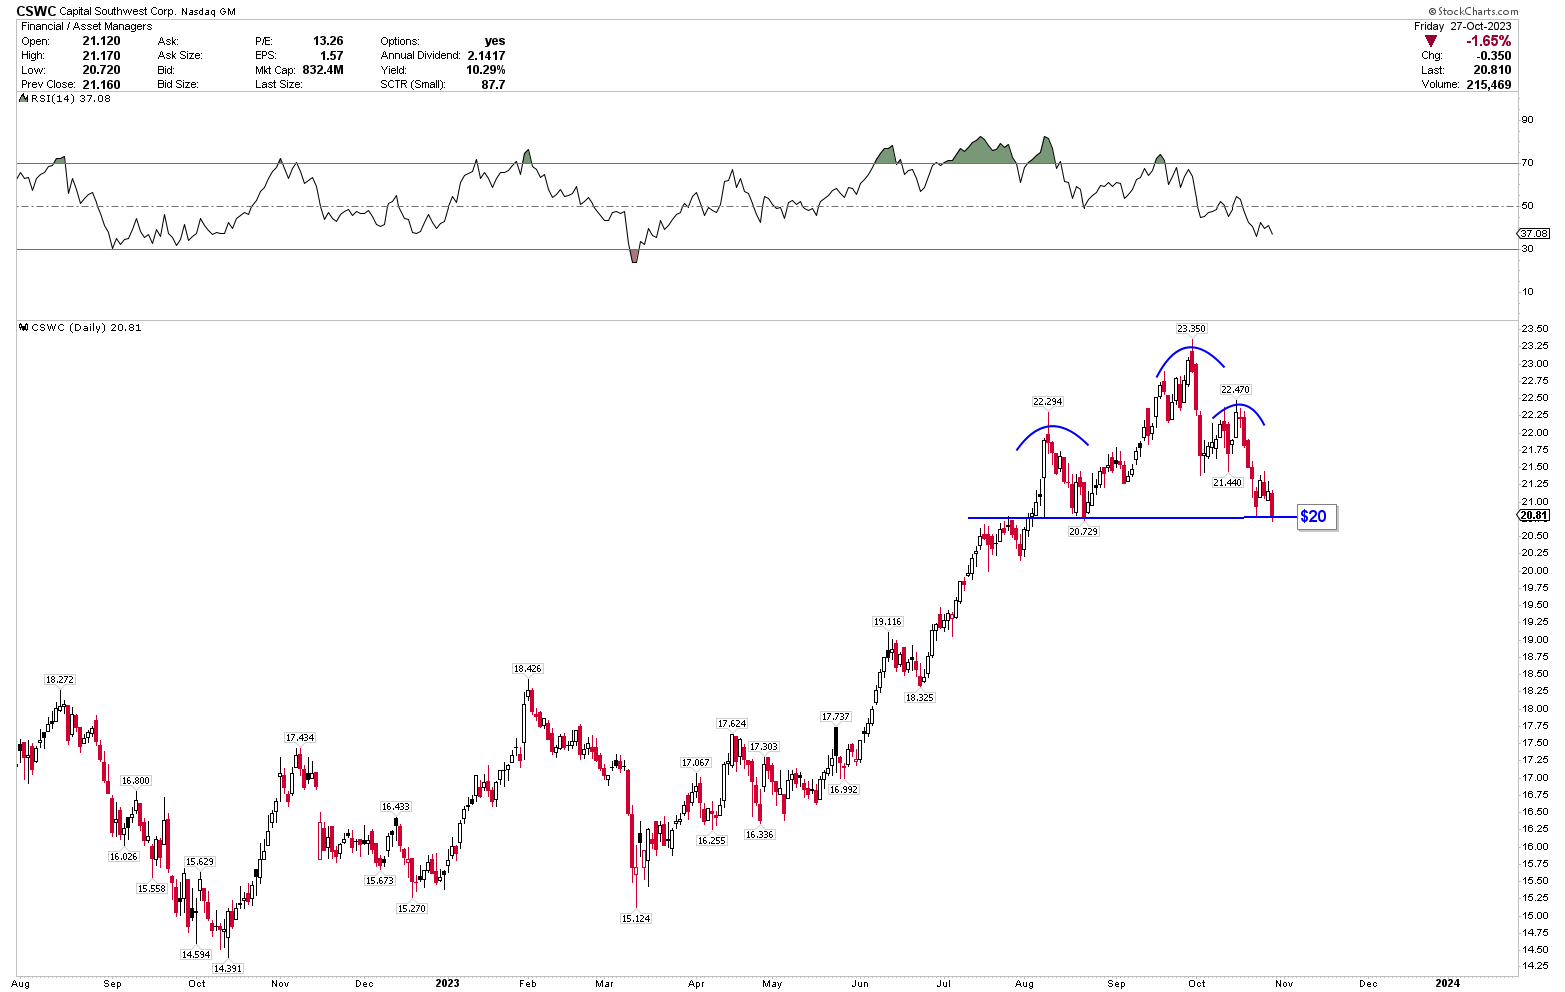
CSWC Daily Chart (StockCharts.com)
While the long-term perspective for Capital Southwest remains bullish, there are signs of a short-term correction, particularly with the recent head and shoulders pattern and the negative monthly performance for October. Yet, any short-term dip in Capital Southwest could be perceived as an attractive entry point for those with a long-term investment horizon.
Market Risk
Capital Southwest’s stock performance shows notable sensitivity to earnings releases, with historical data indicating significant stock price modifications based on earnings outcomes. The anticipation surrounding the forthcoming quarterly report suggests potential price volatility should there be any deviation from market expectations. The company’s credit portfolio, which heavily leans on 1st Lien Senior Secured Debt, and its significant investment in the I-45 SLF introduce concentrated risks. While the present non-accruals are modest, any fluctuation in credit quality or defaults could lead to stock price volatility.
From a technical standpoint, recent patterns, such as the head and shoulders and the RSI indicators, point towards potential short-term corrections in the stock’s trajectory. Investors may perceive these patterns as indicative of a bearish phase, possibly leading to increased selling pressure in the short term. The company’s history also suggests a susceptibility to broader macroeconomic influences. Although the post-2009 economic environment has been largely favorable, unforeseen economic downturns, monetary policy alterations, or significant financial disruptions can influence the company’s market performance.
Bottom Line
Capital Southwest has established itself as a robust player in the investment landscape, consistently outperforming market expectations and demonstrating a solid financial foundation. Its strategic investments, particularly in the I-45 Senior Loan Fund, and impressive returns showcase its strength. While CEO Bowen Diehl and his team underscore a period of significant growth and portfolio performance, technical indicators suggest potential short-term market corrections. Though the long-term outlook for Capital Southwest appears optimistic, investors should remain vigilant of the anticipated short-term volatility, especially given the company’s historical sensitivities to earnings announcements and broader market factors. If the price closes under $20 for the week, it suggests a potential further drop. Investors may consider taking long-term positions near $15, corresponding to the 38.2% Fibonacci retracement from the 2009 low point. Conversely, surpassing $23.35 would counter any short-term downward corrections, prompting a significant upward surge. Capital Southwest is set to announce its Q2 2024 earnings on October 30, 2023, and any subsequent price decline post-announcement should be viewed as a prime buying opportunity for investors.

 Q2 2024 Earnings Call Transcript")

