Darren415
Welcome to another installment of our BDC Market Weekly Review, where we discuss market activity in the Business Development Company (“BDC”) sector from both the bottom-up – highlighting individual news and events – as well as the top-down – providing an overview of the broader market.
We also try to add some historical context as well as relevant themes that look to be driving the market or that investors ought to be mindful of. This update covers the period through the third week of October.
Market Action
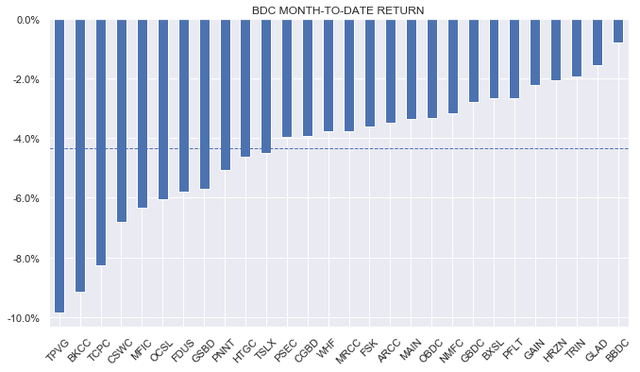
It was another down week for BDCs, as strong macro numbers, geopolitical anxiety and rising yields were key headwinds for the market. Month-to-date, all names in our coverage are in the red with TPVG falling close to 10%.
The sector is now down around 7% off its recent peak.
Systematic Income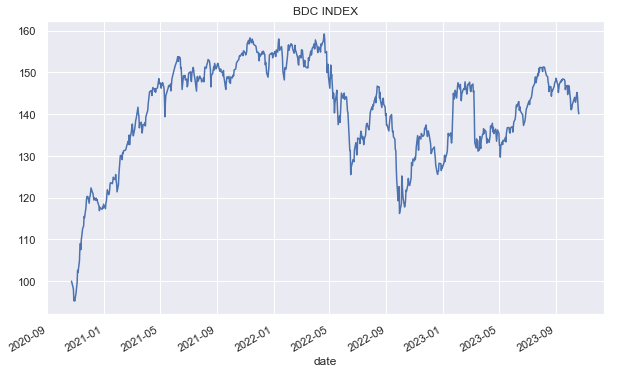
Sector valuation has compressed to 95% from above 100% – a much more reasonable level in our view. Prior to this recent sell-off we pared down our allocation to the sector. Any further drops would make it attractive to start putting new capital to work once again.
Systematic Income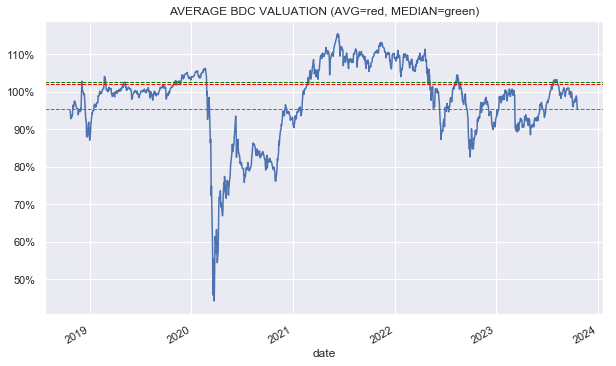
Market Themes
In our previous BDC Weekly we talked about how the ex-dividend date can move the price and, hence, the apparent (if not real) valuation of the given BDC. However, in addition to the valuation shifting from ex-dividend price changes, there are also factors that shift the NAV though they may be less transparent.
NAVs are obviously impacted on the ex-dividend date as the cash comes out of the company’s assets. In this sense the price and the NAV are impacted identically however unlike the price, the NAV is not updated on the following day.
Another driver of the NAV between reporting periods is the level of retained income. Many BDCs at the moment boast very high dividend coverage ratios (i.e. they earn more than they pay out in dividends) which means that the retained income should boost the NAV as it’s earned. Over any quarter this might result in something like a 0.5-1% rise in the NAV until it is declared in the earnings release.
The other impact, which is harder to predict, is the impact of realized and unrealized changes. If a company sells an asset (or locks it in via a restructuring), it realizes a gain or a loss. If that gain or loss is in line with the mark there is no impact on the NAV, otherwise there is.
Unrealized appreciation or depreciation is a kind of mark-to-model that BDCs carry out each quarter. In a period of widening credit spreads there is more likely to be unrealized depreciation and vice-versa. Unrealized changes can be very tough to forecast as most are idiosyncratic in nature. However outside of individual credit situations, BDCs will broadly follow the path of public credit spreads, though in a muted way, in marking their assets and this is relatively easy to gauge.
There are several factors that drive NAVs over any given quarter. The ones that can be forecasted are relatively minor and the major ones are typically idiosyncratic in nature, making them difficult to gauge. For Q3, a high level of retained income, modest level of corporate credit stress and contained credit spreads mean NAVs could see a small rise in aggregate.
Market Commentary
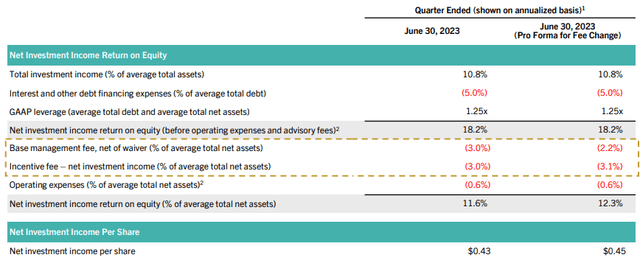
Golub Capital (GBDC) has provided guidance on its calendar Q3 results. Net income is up 13% from the previous quarter, rising to an estimated midpoint of $0.49. About a third of this rise is due to the company’s management fee cut to 1% from 1.375%.
GBDC shows the impact in an extract below.
The stock’s valuation has come a long way. After trading at a discount to the sector since 2021 it has now moved ahead of the sector. Historically the stock has been added to our Income Portfolios when it traded 5-10% cheaper to the sector.
Systematic Income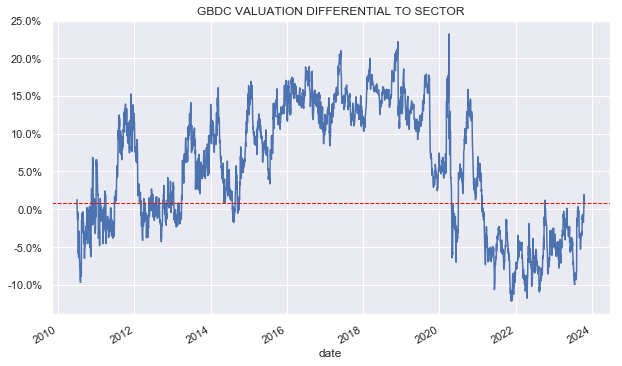
More recently as the valuation has richened, its allocation has been pared down somewhat. At a current 2% premium to the sector (96% vs 94%) it’s less compelling now as an alpha play but a decent defensive choice in the sector.
Check out Systematic Income and explore our Income Portfolios, engineered with both yield and risk management considerations.
Use our powerful Interactive Investor Tools to navigate the BDC, CEF, OEF, preferred and baby bond markets.
Read our Investor Guides: to CEFs, Preferreds and PIMCO CEFs.
Check us out on a no-risk basis – sign up for a 2-week free trial!
