JimVallee
Interest rates have risen as inflation risk has returned, prospects for rate cuts have diminished, and the dollar has strengthened. Credit spreads have also widened, as measured by the CDX high-yield credit spread index.
Additionally, we have seen the yield curve steepening process stall, and signs of further inversion have begun to show again. The inversion process appeared to be behind us. Still, with the latest developments of sticky inflation and questions swirling around the restrictiveness of monetary policy, the yield curve appears to be in a position to see 2-year rates rise faster than 10-year rates, pushing the inversion to deeper levels.
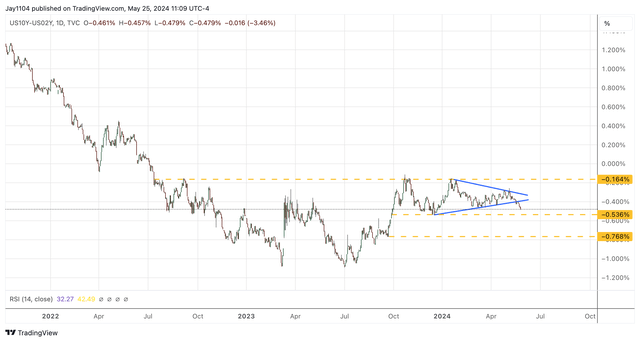
10-2 Curve Breaking Down
This past week, we saw the spread between the 2-year and the 10-year fall below -40 bps, breaking an uptrend that had dated back to mid-December. If the spread moves back below -54 bps, it could signal that the 10/2 curve falls further to perhaps -77 bps based on the economic trends. The region around -16 bps has served as significant resistance since September 2022; that level has held twice since October.
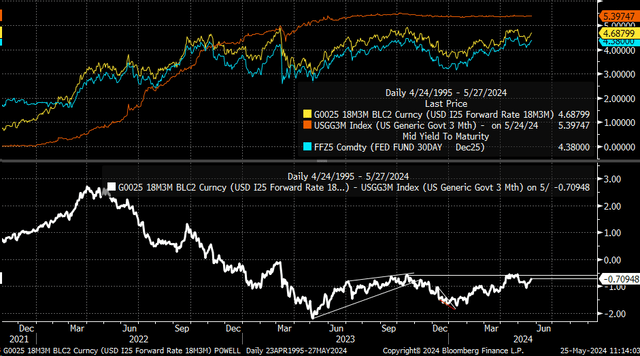
We are seeing something similar happen in the “Powell” indicator, measured as the 3-month Treasury Bill rate 18-month Forward contract minus the spot 3-month Treasury Bill Rate. The spread has moved sharply since the start of 2024 and is now rising again as the market removes rate cut odds from the equation, and the 3-month Treasury Bill 18-month Forward contract rate moves higher.
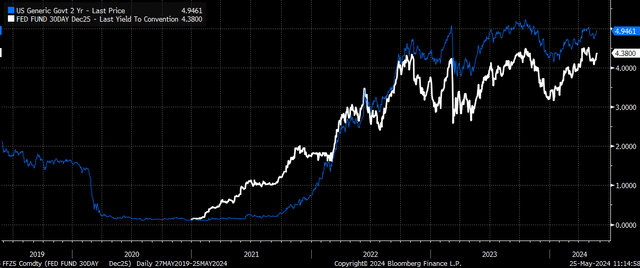
The 2-year pretty much trades with the Fed Fund Futures rates, and right now, the further the Fed Fund Futures for 2025 rises, the more likely the 2-year rate will continue to move higher. This would also suggest that the 10/2 curve continues to invert to lower levels, as the market prices in fewer rate cuts not only for 2024 and 2025 but also a higher neutral rate for the economy.
Neutral Rate Rises
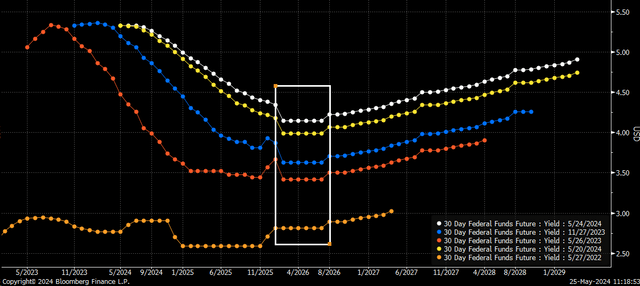
Over time, the market has moved the dots for 2026 higher and higher, and that is the best and easiest way to assess the longer-run neutral rate of the economy as seen by the market at this point because 2026 has been the low point for the easing cycle before rates start rising again in 2027.
In May 2022, the rates in 2026 were expected to be around 2.8%, and those rose to 3.4% in May 2023, then 3.6% in November 2023, and 4.15% as of this week. The bond market is clearly telegraphing a message that rates of the past decade are no more and that, based on the current economic data, the neutral rate of the economy is higher than what it was prior.
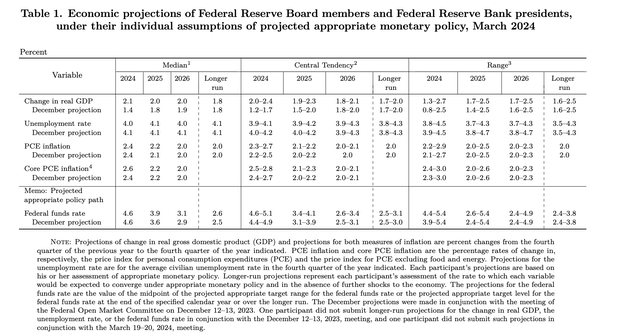
These expectations based on market prices are significantly higher than what the Fed is pricing as of the March Summary of Economic projections because the Fed currently sees rates in 2026 at 3.1%, and assuming a Fed projected PCE rate of 2%, a real rate of 1.1%. The market, on the other hand, assuming a 4.15% rate and with a PCE rate of 2.0%, would suggest a real rate of 2.15%.
It seems evident at this point that all of the Fed projections for interest rates should be higher after the June FOMC meeting.
The market pricing also would suggest that the Fed’s view of restrictive policy is too low. As a result, the 2-year rate should begin to move above the 5% bound, confirming that the market is not only removing rate cuts from the equation but is also beginning to price in the chance for rate hikes.
If rate hikes may be again needed at some point down the road, and the market perceives that is likely to happen, pricing will happen well in advance of Fed speak and would also begin to show up in financial conditions indexes, which should begin to show signs of tightening.
While this isn’t to say that the Fed will raise rates anytime soon, it is to say that the market is already starting to assess and increase the odds of such an event happening, especially if the data continues to support the idea that the neutral rate is higher and that current Fed policy isn’t restrictive enough to push inflation back to target.
