sankai
Investment thesis
Agree Realty Corporation (NYSE:ADC) delivered impressive AFFO per share growth rates in recent years and pays an attractive, growing, and well-covered monthly dividend yielding ~5%.
Although I don’t expect significant price movements without major shifts in the economic conditions (considering ADC’s current P/FFO multiple), I believe that the Company is highly likely to outperform its peers (like Realty Income (O) or NNN REIT (NNN)) on a total return basis in the upcoming years.
ADC’s value proposition is supported by:
- a reliable and proven business model,
- attractive and growing dividends,
- annual rent escalations that heavily impact its bottom line due to the triple net lease structure of its agreements,
- promising growth prospects when compared to closest peers,
- coherent investment strategy combined with an ability to remain selective,
- elite-level business and credit metrics across the industry.
Introduction
ADC is a triple net lease rate that targets retail and service-oriented properties and pays a monthly dividend. Due to the above, it is often compared to O and has been named “the next Realty Income” by some investors.
I’ve discussed ADC’s key business metrics, financial stance, investment strategy, and valuation outlook within this analysis.
Enjoy the read!
ADC – Overview
As of May 2024, the Company had 2161 properties that it leased (on a triple net basis) to retail/service-oriented businesses, including, among others:
- grocery stores,
- home improvement stores,
- tire & auto services,
- convenience stores,
- dollar stores,
- pharmacies,
- general merchandise.
Its top 3 tenants were Walmart (WMT), Tractor Supply (TSCO), and Dollar General (DG), which generated ~15.7% of its annualized base rent.
This REIT sector (in terms of property type) is considered to be reliable and relatively immune to some secular trends threatening other property segments, such as e-commerce growth, digitization, or the “Amazon effect”.
However, these properties don’t come with many limitations regarding the tenant’s ability to move as they are highly commoditized.
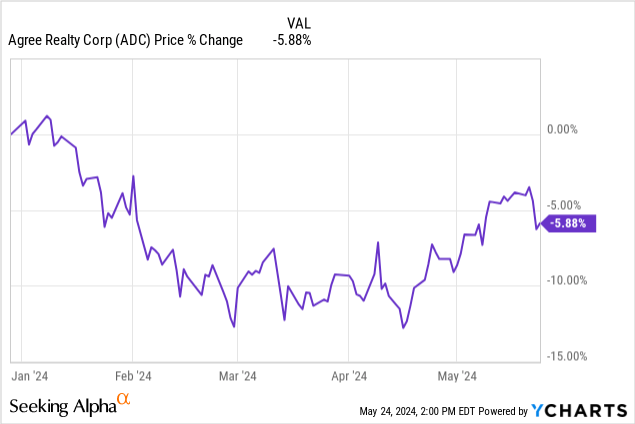
ADC stock price is ~5.9% down YTD.
Key business metrics
Interpreting key business metrics, and thus the condition of a business without a benchmark is hard and often futile. Therefore, before we dig into ADC’s business, let’s establish a reference group.
For this purpose, I’ve selected some of its closest peers:
Further references to the above entities are supported by their Investor Presentations (linked above) and their latest SEC filings (linked in the table).
Table 1: The reference group
| Entity | Reference rationale |
|---|---|
| ADC | – |
| NNN | Triple net lease REIT targetting retail/service-oriented properties. NNN has a similar scale to ADC. |
| EPRT | Triple net lease REIT targetting retail/service-oriented properties. EPRT has a similar scale to ADC. |
| O | Triple net lease REIT. It generally targets retail and service-oriented properties, however, it has some activity (probably increasing) within other sectors. |
– Occupancy rate
During my recent analysis of GLPI, I stated that:
According to O’s Investor Presentation, the historical median occupancy rate of an S&P 500 REIT is 94.8% with the lowest year-end level of 91.9% during the 31.12.2000 – 31.03.2024 period.
I consider the occupancy rate an important metric reflecting the overall quality of the REIT’s portfolio. Not all REITs have been created equal and some entities significantly exceed the historical median indicated by O.
REITs included within the reference group are a part of the over-achieving group:
- NNN – 99.4%,
- EPRT – 99.9%,
- O – 98.6%.
ADC is also capable of upholding a high occupancy rate, which amounted to 99.6% as of March 2024.
ADC’s Q1 2024 10-Q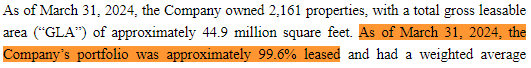
– Lease terms
I always pay attention to the weighted average lease term (WALT) of an analyzed REIT, as I consider this metric to reflect not only the negotiating position of a company but also the strength of its agreements, and thus predictability of its cash flows.
In this case, taking into account ADC’s target properties, its WALT amounting to 8.2 years is solid and provides enough evidence for both the quality of its portfolio and cash flow predictability.
However, there is still some room for improvement as its peers are able to secure longer lease terms:
- NNN – 10 years,
- EPRT – 14.1 years,
- O – 9.8 years.
– SG&A to revenue
Please, review the number of properties and SG&A to revenue ratio of the reference group in the table below.
Table 2: Number of properties and SG&A ratio of the reference group
| ADC | NNN | EPRT | O | |
|---|---|---|---|---|
| Number of properties | 2 161 | 3 546 | 1 937 | 15 485 |
| SG&A to total revenue (Q1 2024) | 6.4% | 5.8% | 9.1% | 3.2% |
Despite ADC’s SG&A to revenue ratio standing as the second highest regarding the reference group, I consider ADC’s 6.4% to be a solid level.
“Why is that?” – one may ask.
Well, we can see that ADC’s metric is just 0.6 percentage points higher than NNN’s, despite a noticeable (not significant) difference in scale, considering the number of properties.
When it comes to EPRT which has a more similar scale, ADC’s SG&A to revenue ratio looks significantly better.
For obvious reasons, O’s 3.2% ratio is not representative due to its larger scale, which brings us to the next point.
Size matters
When considering comparability across a certain peer group, one should not only look at the operations but also the scale of the business. Therefore, I believe O may be a bit less comparable to ADC than NNN or EPRT.
Nevertheless, many investors consider ADC to be a “little Realty Income” due to its target property type and monthly dividend.
I regard the size difference between these two as an advantage… on behalf of ADC – please, hear me out.
While size definitely brings some benefits (e.g. lower SG&A to revenue ratios due to the economy of scale effects or better ability to raise capital), it may also lead to some headwinds in terms of the company’s ability to stay selective and remain within its primary area of competence.
After reaching such a big scale of nearly 15.5 thousand properties, O has to realize numerous acquisitions to keep the ball rolling, in other words, uphold its growth trajectory.
The above limits Realty Income’s selectivity, even during such difficult market conditions (high interest rates, high cost of capital), and forces it to step outside of its main business scope (e.g., data centers, gaming properties).
ADC doesn’t have such issues. It can easily remain selective, carefully consider future acquisitions, doesn’t have to build such an extensive project pipeline, and can remain within its area of competence. ADC’s size still ensures that each acquisition moves the needle for the Company.
Please, don’t get the wrong idea. I highly value Realty Income, its outstanding track record, great business metrics, geographical diversification (including great investments in Europe), and the high, reliable monthly income that it provides to its shareholders. I think it will do relatively well in the future.
Nonetheless, I consider ADC to be capable of outperforming O in the upcoming years and providing its shareholders with higher total returns.
Financial stance
Please review the AFFO per share of the reference group in 2018 – 2023, as well as the midpoint guidance for 2024 in the table below.
Table 3: AFFO per share of the reference group with midpoint 2024 guidance
During the 2019 – 2023 period, ADC marked an impressive AFFO per share growth with a CAGR of 6.9%, compared to O’s and NNN’s 4.6% and 4.0%, respectively (with 2018 as a base year).
However, EPRT has been able to mark an even more impressive CAGR of 9.7% (although for a 2020 – 2023 period with 2019 as a base year).
I believe that ADC will continue to outperform NNN and O in the upcoming years (on a compound basis). Midpoint 2024 AFFO per share guidance for each company assumes:
- 4.2% growth for ADC,
- 1.8% growth for NNN,
- 5.2% growth for EPRT,
- 4.3% growth for O.
ADC has a BBB-rated balance sheet with a well-laddered debt maturity profile with no material maturities until 2028. The Company has a weighted average debt maturity (WADM) equal to ~7 years which is a comforting level when compared with O’s 6.5 years or EPRT’s 4.7 years.
It is far from NNN’s 11.9 years, however, NNN’s WADM is one of the best in the entire sector and reflects its highly disciplined approach to business.
ADC’s Investor Presentation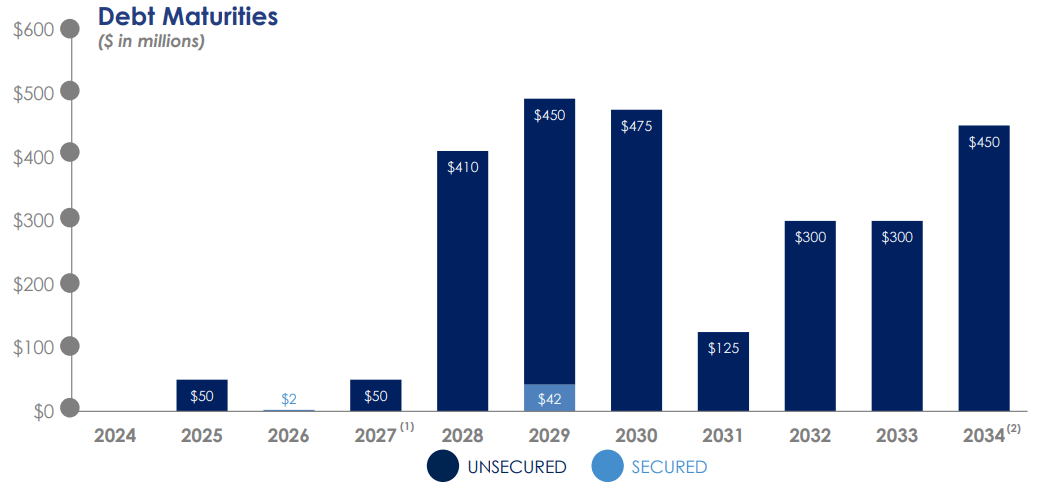
As a result, the high-interest rate environment has a limited impact on ADC’s financial performance as it will not be forced to refinance a substantial amount of debt at a higher cost in the upcoming years.
Moreover, the Company takes measures to realize upcoming investment activities on a leverage-neutral basis, as its CEO, Joey Agree stated during Q1 2024 Earnings Call:
At this time, we have visibility into over half of the approximately $600 million acquisition guide. With anticipated full-year disposition activity of $50 million to $100 million, roughly $237 million of outstanding forward equity, and free cash flow approaching $100 million on an annualized basis, we will be able to fund this activity on a largely leverage-neutral basis, ending the year well within our targeted leverage range.
Investment activity
ADC concentrated on industry-leading operators with e-commerce and recession-resistance businesses, which has so far been reflected in their investment activity and tenant structure.
ADC’s Investor Presentation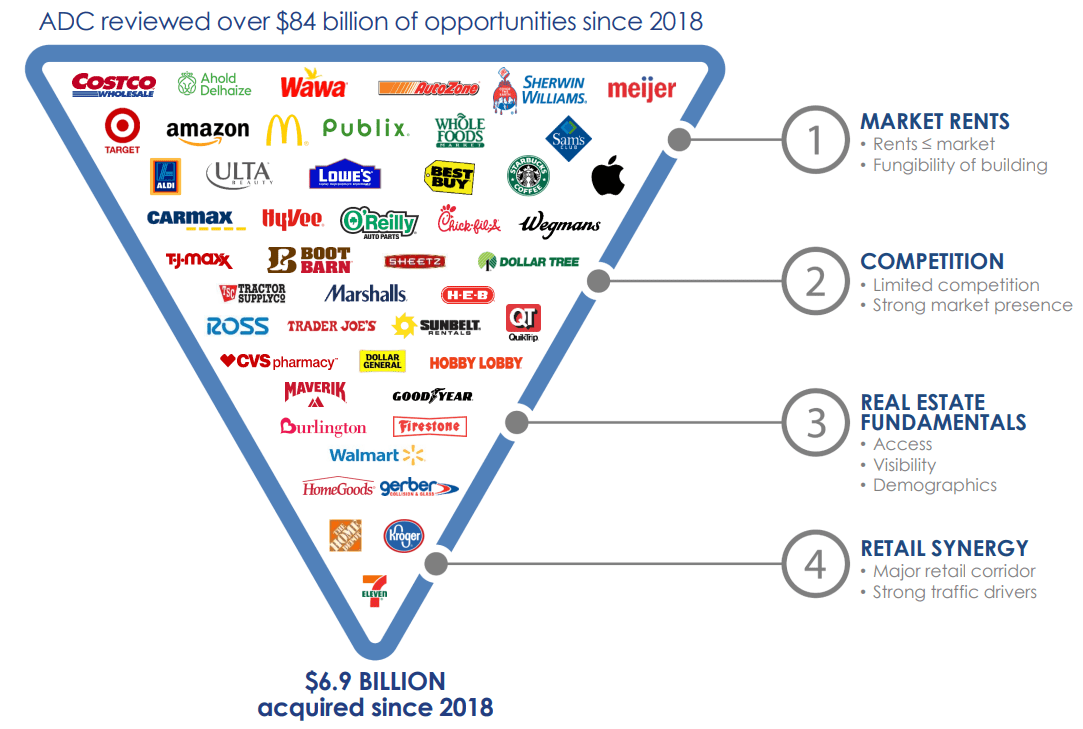
ADC has realized $8.9 billion worth of investments since 2010. Its investment guidance for 2024 assumes nearly $700m worth of investments, out of which ~$600m will be related to acquisitions.
While some investors may consider the above value as low, especially considering the recent years, it reflects the Company’s ability to remain selective and keep the ball rolling.
As I mentioned earlier, each acquisition still moves the needle for ADC and significantly impacts its financial stance, so lower investment guidance in a relatively hard economic environment (common across other comparable entities, including NNN) is reasonable in my view.
ADC’s Investor Presentation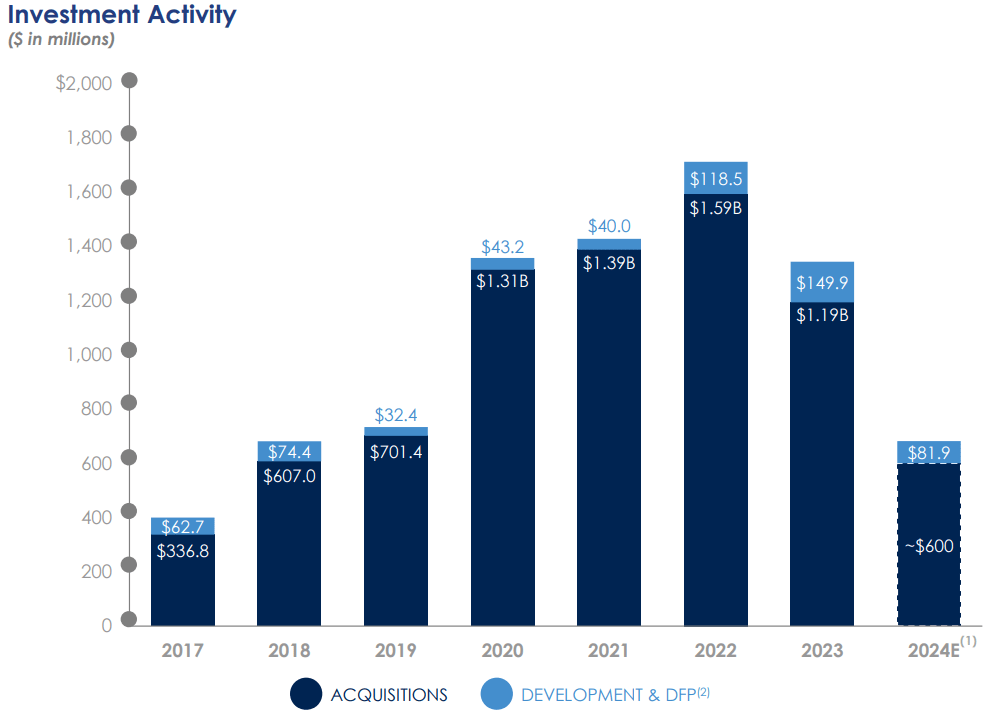
The Company also proactively manages its portfolio via non-core or the least productive asset dispositions.
ADC’s Investor Presentation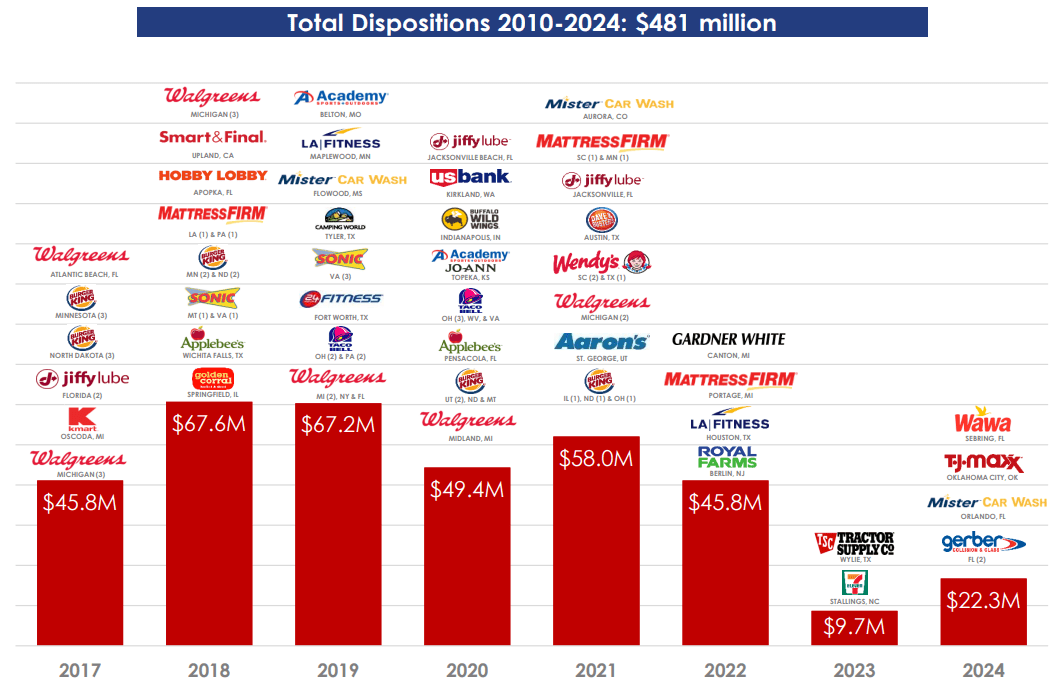
Valuation
As an M&A advisor, I usually rely on a multiple valuation method that is a leading tool in transaction processes, as it allows for accessible and market-driven benchmarking.
However, apart from simply gathering a reference group, it is crucial to understand the business-related rationale for a given, market valuation multiple. Only then an investor may be able to interpret the market data and asses the target’s valuation.
That said, please review the reference group in the table below – with P/FFO multiples provided.
Table 4: P/FFO (TTM) of the reference group
| Entity | Reference rationale | P/FFO (TTM) |
|---|---|---|
| ADC | – | 15.2x |
| NNN | Triple net lease REIT targetting retail/service-oriented properties. NNN has a similar scale to ADC. | 12.5x |
| EPRT | Triple net lease REIT targetting retail/service-oriented properties. EPRT has a similar scale to ADC. | 14.9x |
| O | Triple net lease REIT. It generally targets retail and service-oriented properties, however, it has some activity (probably increasing) within other sectors. | 13.1x |
Numerous metrics may apply to company valuation, with EV/EBITDA being a rule of thumb for most sectors. However, in REIT analysis, P/FFO is the leading indicator.
ADC has the highest P/FFO multiple of ~15.2x among the reference group.
Regarding NNN, I don’t believe its multiple properly reflects the business value proposition and its long-term ability to generate reliable cash flows. I’ve recently covered NNN and explained why I consider it undervalued.
Nevertheless, ADC has both the business metrics and the growth prospects that justify its higher multiple when compared to O or NNN (even assuming my target P/FFO ratio).
Looking at EPRT, both companies have some “better” and “worse” points when compared to one another, regarding either business, growth, or credit metrics. Therefore, I don’t believe that there’s much room for multiple spread between these two.
To conclude this section, assuming ADC stays in line in terms of expectations and no major shifts in the economic environment occur (e.g. FED policy), I think that its P/FFO multiple will remain within the 14.5x – 16.0x range, implying ~(4.6%) – 5.2% of share price movement.
Risk factors
Naturally, potential problems with major tenants heavily impacting financial performance are always a risk to consider while evaluating a REIT. However, this risk is limited in ADC’s case, as 69% of its tenants have investment-grade-rated balance sheets, their structure is diversified, and most of the top tenants are leaders within their specific field.
Moreover, prolonging the high-interest rate environment, lasting at least until 2028 when some noticeable debt maturities occur, could hurt ADC’s financial performance by forcing it to refinance at a relatively high cost.
Realization of any of the above scenarios or other, impossible-to-predict events, could of course lead to higher price volatility.
Key takeaways
I have a bullish view of ADC and consider it capable of outperforming its peers in the upcoming years. Assuming no material adverse changes and no major shifts in the economic environment, I don’t see much room for price movements.
Nevertheless, ADC’s value proposition is supported by:
- a reliable and proven business model,
- attractive and growing dividends,
- annual rent escalations that heavily impact its bottom line due to the triple net lease structure of its agreements,
- promising growth prospects when compared to closest peers,
- coherent investment strategy combined with an ability to remain selective,
- elite-level business and credit metrics across the industry.
I will continue to monitor the Company and evaluate, as well as adjust, my current views.

 Q2 2024 Earnings Call Transcript")

