HUNG CHIN LIU/iStock via Getty Images
Thesis
In my previous article about ASML Holding N.V. (NASDAQ:ASML), I rated the stock as a “strong buy” citing that my estimated upside for the stock ranged from 16.8% to 21.5%, which means a present fair price per share ranging from $984.44 to $1,124.65.
In Q1 2024 earnings, ASML reported earnings of €3.11 per share, which topped estimates. However, revenue came out at €5.3B, which indicates a 20% Y/Y slip in sales. This caused the stock to sink by 11%, which completely erased the 11% mark since my previous article. Now, the total return stands at -1.42%. Lastly, ASML said that total sales for 2024 will be similar to those of 2023.
After re-evaluating the stock, I arrived at a new fair price estimate of $892.21, which indicates that the stock is currently fairly valued since the potential upside is around 2.3%. The stock is also projected to go up to $1,742.44 by 2029, which indicates 16.6% annual returns throughout.
Since the potential upside is low, I downgrade the stock from “strong buy” to “buy”. The reason why I am not assigning a hold is because ASML boasts market dominance and has on its side the surprise factor.
Seeking Alpha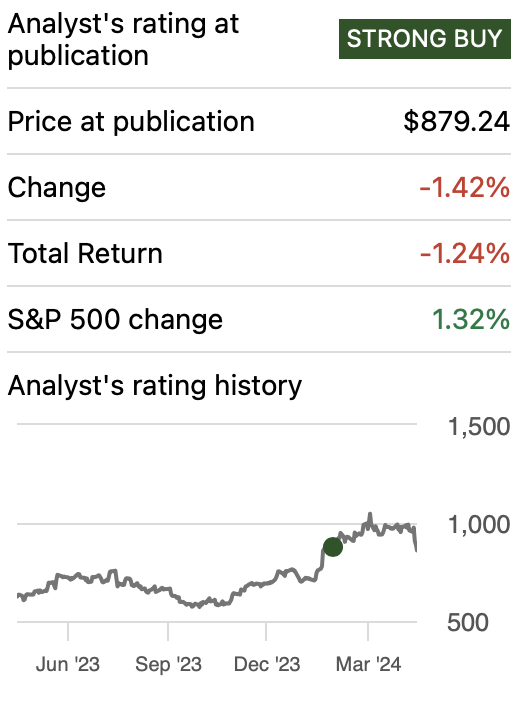
Overview
How does ASML compare against peers?
ASML’s major competitors include Nikon, Canon, Veeco, and Süss MicroTec. Nevertheless, these competitors’ operations in lithography, are significantly smaller than those of ASML. This can be deducted by knowing that the Worldwide Lithography market is expected to have a market size of $26.48B, and ASML’s revenue (after taking out the 2% contribution of Metrology), stands at $27.32B, which easily tells us that ASML is hoarding over 90% of the market.
This moat is in my opinion very safe since the client’s staff were already instructed on how to manage ASML’s equipment and not the one from other vendors. This means that for a client to change its lithography equipment to another vendor (for example, Canon) they will need to spend significant money in adapting the facility and teaching fab workers how to manage the new Canon machines.
ASML’s Expansion Plan
As previously said, ASML is a company that concentrates on nearly all of the market, which means that its growth will only be possible if the overall market grows. ASML can also boost value by doing cost-cutting measures which would improve net income.
Evidence that this is what ASML has been making is that the company beat EPS estimates in Q1 2024 but missed sales, and the only way to do that is by increasing profitability.
Industry Outlook
The global semiconductor lithography market is expected to grow by 7.38% annually throughout 2029. The market is expected to reach a valuation of $26.48B in 2024 and climb to $37.8B in 2029. However, EUV alone has more potential for growth than DUV. The potential growth of EUV stands at around 23.15%, which is the average suggested by GlobalNewswire, Verified Market Research, PR Newswire, and Research and Markets.
Author’s Calculations Based on Mordor Intelligence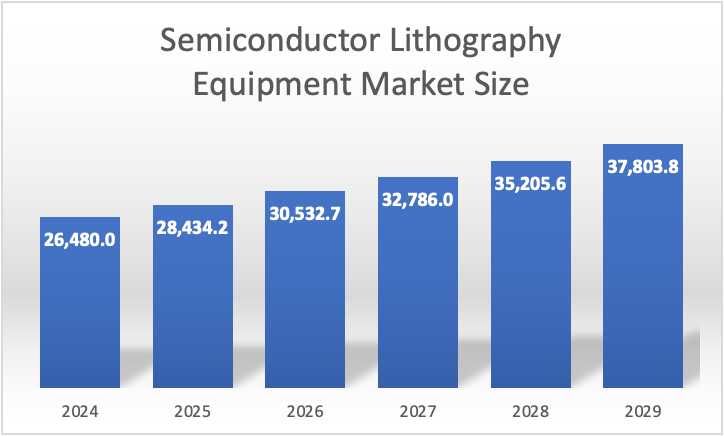
Then, there is the 2% of ASML’s revenue represented by Metrology. This market is expected to reach a valuation of $10.4B in 2024 and $13.49B in 2029. This points towards an annual growth rate of 5.2% throughout 2029.
Author’s Calculations Based on Mordor Intelligence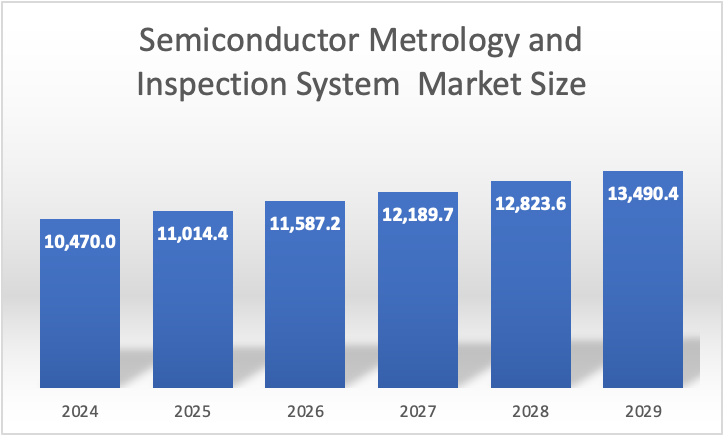
Taking into account both projections, we can deduce that the addressable market of ASML will stand at $36.95B and this will increase to $51.29B by 2029. This showcases an annual growth rate of 7.76% from 2024 to 2029.
Valuation
To value ASML, I will use a DCF model. In the table below, you can see the financial information that will be necessary to make the projections. The first thing you will notice is that D&A and CapEx will be projected with margins tied to revenue performance. These margins came out at 2.49% and 7.82% respectively.
Concerning the WACC, this will be calculated with the already known formula, for which you can also see the variables in the table of assumptions below. The calculation of the WACC will be present in the section “WACC Calculation” available in the DCF model. This figure came out at 12.674% for ASML.
| TABLE OF ASSUMPTIONS | |
| (Current data) | |
| Assumptions Part 1 | |
| Equity Market Value | 343,840.00 |
| Debt Value | 5,556.10 |
| Cost of Debt | 2.97% |
| Tax Rate | 16.04% |
| 10y Treasury | 4.615% |
| Beta | 1.39 |
| Market Return | 10.50% |
| Cost of Equity | 12.80% |
| Assumptions Part 2 | |
| CapEx | 2,202.30 |
| Capex Margin | 7.82% |
| Net Income | 7,669.10 |
| Interest | 164.80 |
| Tax | 1,464.60 |
| D&A | 701.10 |
| EBITDA | 9,999.60 |
| D&A Margin | 2.49% |
| Interest Expense Margin | 0.59% |
| Revenue | 28,166.9 |
The first thing to do is to calculate revenue. As previously said, ASML concentrates the vast majority of the market, and therefore the only possible way for them to grow their revenue is by the market itself growing. So, starting from there, the DUV division of ASML, which reported $17.34B in 2023, will grow at a rate of 7.38% in line with the market. Meanwhile, EUV will grow at 23.15% and metrology by 5.2% throughout 2029.
| EUV | DUV | Metrology & Inspection System | |
| 2023 | 12,169.8 | 17,342.0 | 608.5 |
| 2024 | 14,987.1 | 18,621.8 | 640.1 |
| 2025 | 18,456.6 | 19,996.1 | 673.4 |
| 2026 | 22,729.3 | 21,471.8 | 708.4 |
| 2027 | 27,991.2 | 23,056.4 | 745.3 |
| 2028 | 34,471.1 | 24,758.0 | 784.0 |
| 2029 | 42,451.2 | 26,585.1 | 824.8 |
Then, the next step is net income, for which I will use margins to calculate it. The first thing is to understand that the machines ASML makes have a lifespan that is around 30,000 hours. The other aspect to take into consideration is that semiconductor fabs can operate 24/7 which means that there are companies that would need to replace these machines every 3.42 years and others that will need to do it every 10.20 years (if that hypothetical company only works 8 hours per day). Nevertheless, the improvement in technology nearly every 1-2 years has ensured no one can stick to their equipment for more than 4 years.
During periods of growth, ASML’s net income margin increases by 3.04%, while during downturns, it decreases by 3.4%. Periods of growth are around 2 years and downturns are approximately 1 year. Therefore, I will imply that for 2025 and 2029, the net income margin will shrink.
| My Net Income Margins | |
| 2024 | 27.02% |
| 2025 | 31.61% |
| 2026 | 28.21% |
| 2027 | 31.25% |
| 2028 | 34.29% |
| 2029 | 30.89% |
Author’s Calculations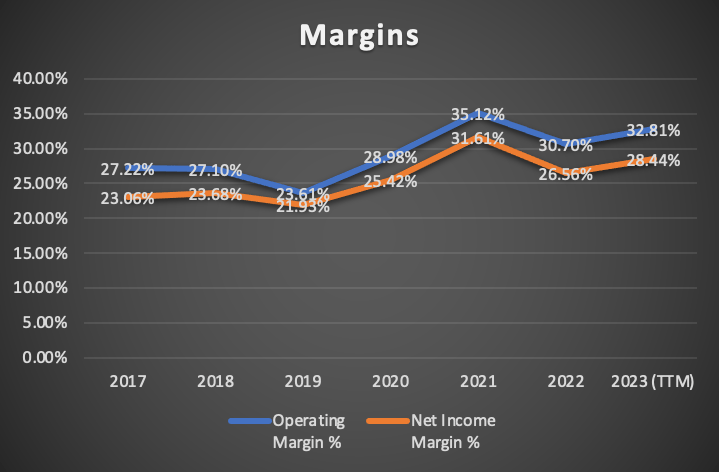
| Revenue | Net Income | Plus Taxes | Plus D&A | Plus Interest | |
| 2024 | $30,424.5 | $8,220.70 | $9,538.90 | $10,296.19 | $10,460.99 |
| 2025 | $40,477.7 | $12,372.09 | $14,355.97 | $15,113.26 | $15,273.74 |
| 2026 | $46,227.1 | $12,673.20 | $14,705.36 | $15,855.99 | $16,012.27 |
| 2027 | $53,074.6 | $16,189.37 | $18,785.35 | $20,106.43 | $20,258.61 |
| 2028 | $61,257.1 | $20,582.50 | $23,882.92 | $25,407.67 | $25,555.86 |
| 2029 | $71,065.3 | $21,583.98 | $25,045.00 | $26,813.88 | $26,958.19 |
| ^Final EBITA^ |
Lastly, before going to the present fair price estimate, I want to suggest which could be the stock price for 2029 to see if the annual returns that the stock can offer are worth it. To do this, I will use the undiscounted cash flows and I will also need to predict each of the elements that conform to equity. This last one will be done by implying that those elements will continue to evolve at the pace registered for 2021-2024TM. This means that short-term debt will stay flat at $0, meanwhile, long-term debt will decrease at a -0.8% annual pace, and marketable securities by 10.9%. However, current assets will grow at a 6.87% pace.
Author’s Calculations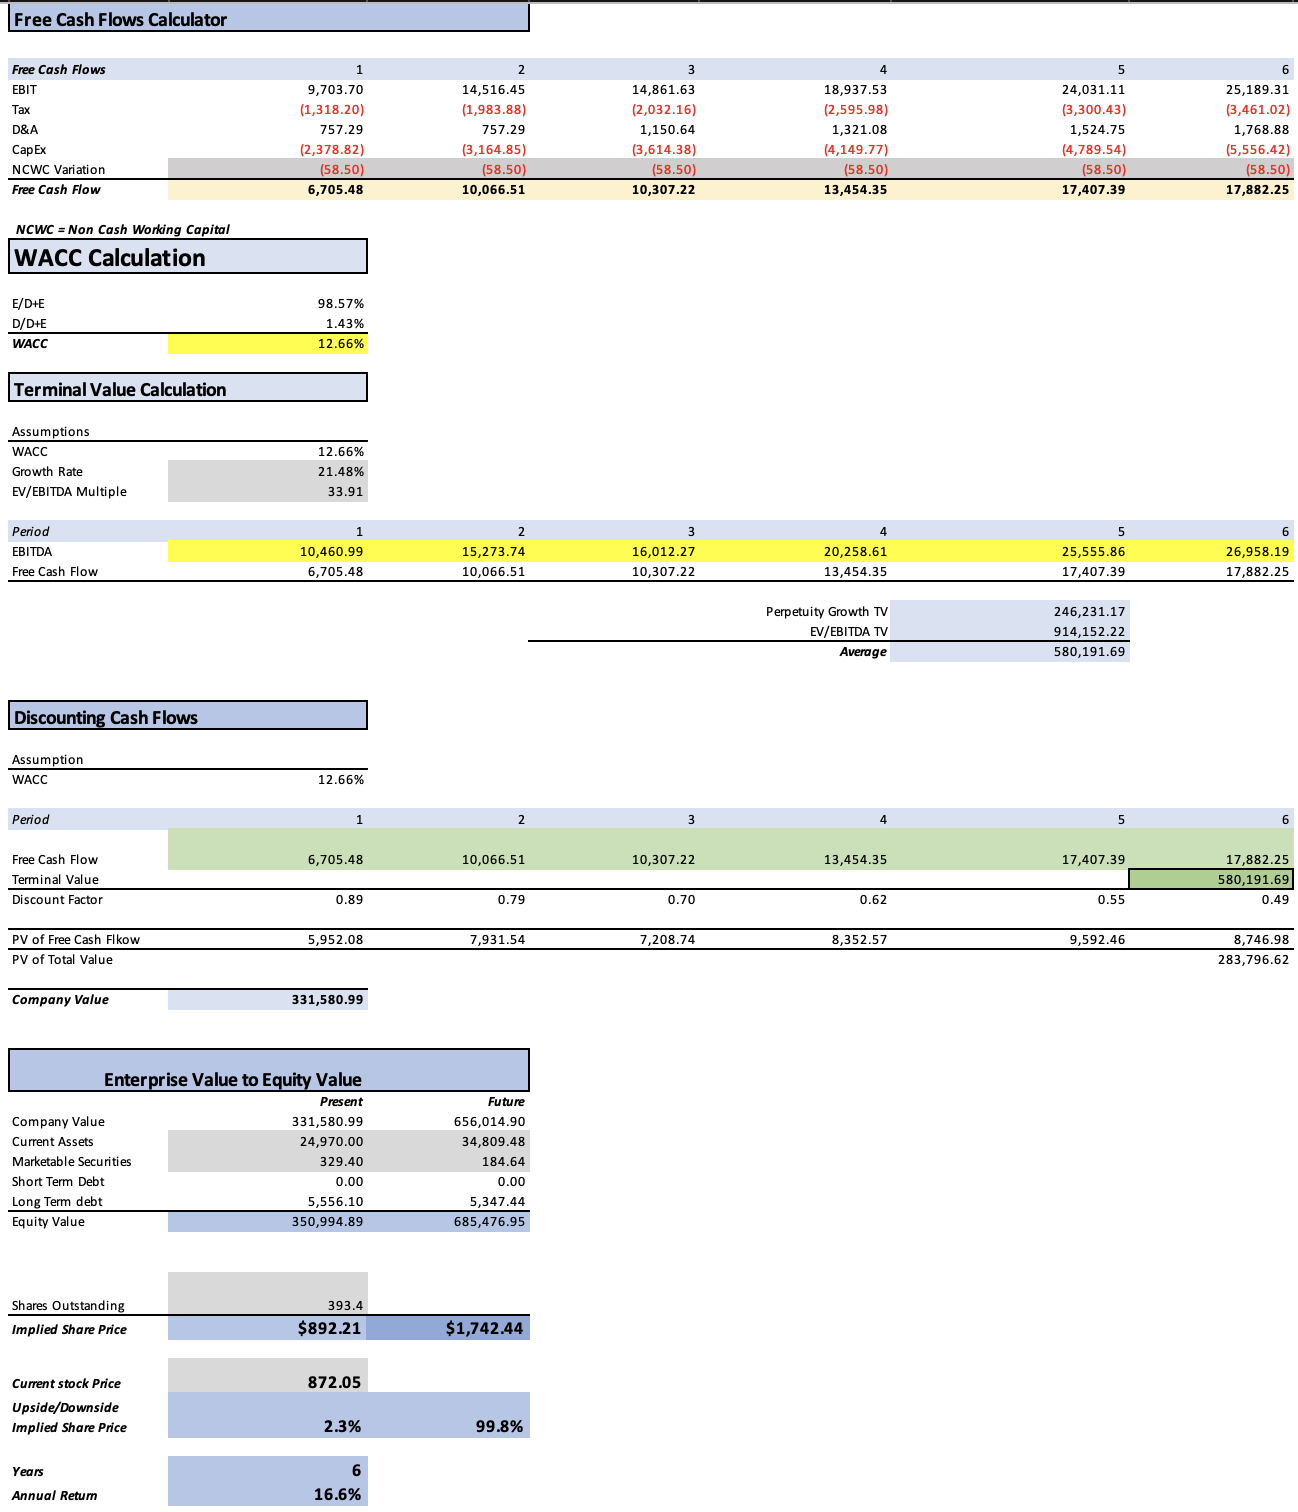
As you can see, the model suggests that the fair price of ASML stands at around $892.21, which implies a 2.3% upside from the current stock price of $872.05. The estimated future price for 2029 came out at $1,742.44 which implies annual returns of around 16.6%.
How do my estimates compare with the average consensus?
If I did a model completely based on analysts’ estimates, I would arrive at a fair price estimate of $941.06, which is 7.9% above the current stock price of $872.05. The future stock price for 2029 would come out at $1,837.39, which implies annual returns of 18.4% throughout 2029.
My EPS estimates are lower than the average consensus by around 3.76%. For 2024 my EPS estimate is 2.94% higher than the average consensus, for 2025 both are the same, and for 2028 it’s 2.55% higher. However for 2026, 2027, and 20229, my target is 10.98%, 8.61%, and 5.42% lower than the average consensus.
Author’s Calculations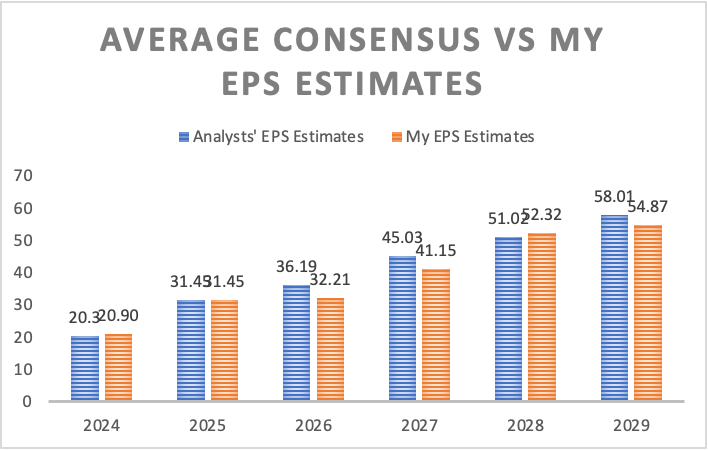
Concerning revenue estimates, mine are 11.31% higher, and this difference grows throughout the years as my 2029 revenue target becomes 19.46% higher than the average revenue estimate for that date.
Author’s Calculations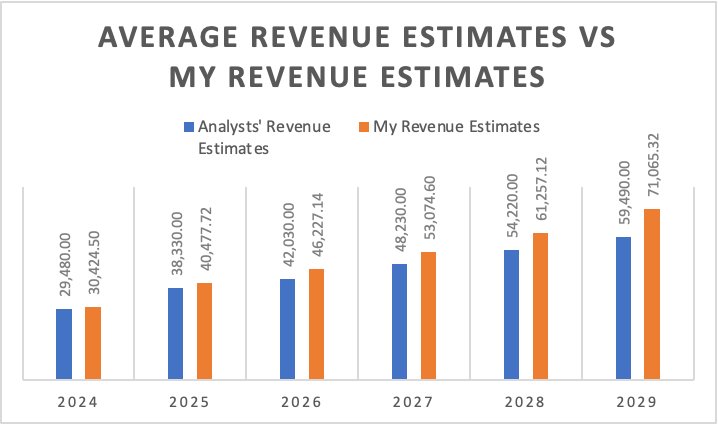
This means that the difference is in net income margins since I am expecting that for 2029, ASML will have a net income margin of 30.8% which is far lower than the expected 38.36%. Furthermore, the net income margins derived from available estimates, never contract, but continue to grow throughout 2024-2029.
| My Net Income Margins | Net Income Margins from the average consensus | |
| 2024 | 27.02% | 27.09% |
| 2025 | 31.61% | 32.28% |
| 2026 | 28.21% | 33.87% |
| 2027 | 31.25% | 36.73% |
| 2028 | 34.29% | 37.02% |
| 2029 | 30.89% | 38.36% |
Risks to Thesis
The main risk is that the 2.3% upside potential is not enough to counter the effects of any major event. There is the risk that ASML, being such a huge player, could lose its market dominance to smaller companies in the market.
Furthermore, ASML needs to keep innovating to maintain its edge because if it fails to do it, and a competitor grabs ASML’s spot, then all companies will switch their infrastructure and teach their staff how to manage these new machines from a different company. This means that ASML will need to innovate or cut pricing to regain its spot.
Lastly, there is the risk of market sentiment because ASML (as displayed by my model) is not a stock poised for huge (20%+) annual returns, which means that the stock could always be under a constant downward force.
Conclusion
In conclusion, ASML presents a reduced opportunity compared to before, now the potential upside stands at 2.3% (according to my estimates) to 7.9% (according to the average analysts’ estimates). Potential annual returns stand at 16.6% throughout 2029.
Nevertheless, this fair valuation also represents opportunities, since ASML said that its sales for 2024 will come almost in line with those registered in 2023, there is the possibility that ASML will beat those estimates and therefore the stock price will increase.
My present fair price target is $892.21 and the future price is $1,742.44. For the reasons previously mentioned, I downgraded the stock to “buy”. In the following quarters, I would continue to update my DCF model, and I would continuously check the forecast that ASML gives.
Editor’s Note: This article discusses one or more securities that do not trade on a major U.S. exchange. Please be aware of the risks associated with these stocks.

 Q2 2024 Earnings Call Transcript")

