PM Images
We have five new dividend increases for the last week of April. The list also includes notorious past dividend cutter Kinder Morgan (KMI). They’ve corrected for their past sins and now have a new 7-year streak underway. The companies average a 7.5% increase and a median of 9.6%.
I adhere to a dividend-growth strategy that enables me to receive increasing dividend payouts from companies that regularly increase their dividends. Through my diligent monitoring of such companies, I have identified a list of top-performing stocks poised to increase their dividends in the near future. This list can be leveraged to make prudent investments and establish a well-positioned portfolio for long-term success.
How I Created The Lists
The following information is a result of merging two sources of data: the “U.S. Dividend Champions” spreadsheet from a particular website and upcoming dividend data from NASDAQ. This process combines data on companies with a consistent dividend growth history with future dividend payments. It’s important to understand that all companies included in this list have consistently grown their dividends for at least five years.
Companies must have higher total yearly dividends to be included in this list. Therefore, a company may not increase its dividend every calendar year, but the total annual dividend can still grow.
What Is The Ex-Dividend Date?
The ex-dividend date is the last day you can purchase shares to qualify for an upcoming dividend or distribution. To be eligible, you must have bought the shares by the end of the preceding business day. For instance, if the ex-dividend date is Tuesday, you must have acquired the shares by the market close on Monday. If the ex-dividend date falls on a Monday (or a Tuesday following a holiday on Monday), you must have purchased the shares by the previous Friday.
Dividend Streak Categories
Here are the definitions of the streak categories, as I’ll use them throughout the piece.
- King: 50+ years.
- Champion/Aristocrat: 25+ years.
- Contender: 10-24 years.
- Challenger: 5+ years.
| Category | Count |
| King | 0 |
| Champion | 0 |
| Contender | 2 |
| Challenger | 3 |
The Dividend Increases List
Data was sorted by the ex-dividend date (ascending) and then by the streak (descending):
| Name | Ticker | Streak | Forward Yield | Ex-Div Date | Increase Percent | Streak Category |
| Kinder Morgan, Inc. | (KMI) | 7 | 6.11 | 29-Apr-24 | 1.77% | Challenger |
| Aon plc Class A Ordinary Shares (Ireland) | (AON) | 13 | 0.87 | 30-Apr-24 | 9.76% | Contender |
| Hess Midstream LP Class A Share | (HESM) | 7 | 7.33 | 1-May-24 | 2.84% | Challenger |
| Constellation Brands, Inc. | (STZ) | 9 | 1.54 | 2-May-24 | 13.48% | Challenger |
| Ameriprise Financial, Inc. | (AMP) | 19 | 1.43 | 3-May-24 | 9.63% | Contender |
Field Definitions
Streak: Years of dividend growth history are sourced from the U.S. Dividend Champions spreadsheet.
Forward Yield: The payout rate is calculated by dividing the new payout rate by the current share price.
Ex-Dividend Date: This is the date you need to own the stock.
Increase Percent: The percent increase.
Streak Category: This is the company’s overall dividend history classification.
Show Me The Money
Here is a table that shows the new and old rates, as well as the percentage increase. The table is sorted by ex-dividend day in ascending order and dividend streak in descending order.
| Ticker | Old Rate | New Rate | Increase Percent |
| KMI | 0.283 | 0.288 | 1.77% |
| AON | 0.615 | 0.675 | 9.76% |
| HESM | 0.634 | 0.652 | 2.84% |
| STZ | 0.89 | 1.01 | 13.48% |
| AMP | 1.35 | 1.48 | 9.63% |
Additional Metrics
Some different metrics related to these companies include yearly pricing action and the P/E ratio. The table is sorted the same way as the table above.
| Ticker | Current Price | 52-Week Low | 52-Week High | PE Ratio | % Off Low | % Off High |
| KMI | 18.81 | 15.22 | 18.92 | 307.05 | 24% Off Low | 1% Off High |
| AON | 308.89 | 284.26 | 345.3 | 26.73 | 9% Off Low | 11% Off High |
| HESM | 35.59 | 25.31 | 36.84 | 9.71 | 41% Off Low | 3% Off High |
| STZ | 261.63 | 219.45 | 274.87 | 42.82 | 19% Off Low | 5% Off High |
| AMP | 412.87 | 275.36 | 440.67 | 13.93 | 50% Off Low | 6% Off High |
Tickers By Yield And Growth Rates
I’ve arranged the table in descending order so that investors can prioritize the current yield. As a bonus, the table also features some historical dividend growth rates. Moreover, I have incorporated the “Chowder Rule,” which is the sum of the current yield and the five-year dividend growth rate.
| Ticker | Yield | 1 Yr DG | 3 Yr DG | 5 Yr DG | 10 Yr DG | Chowder Rule |
| HESM | 7.33 | 9 | 11.6 | 11.6 | 19 | |
| KMI | 6.11 | 1.8 | 2.5 | 7.2 | -3.4 | 13.3 |
| STZ | 1.54 | 11.3 | 5.9 | 3.8 | 5.3 | |
| AMP | 1.43 | 8 | 9.1 | 8.5 | 10 | 10 |
| AON | 0.87 | 9.8 | 11 | 9 | 13.4 | 9.9 |
Historical Returns
My investment strategy centers on identifying stocks with a consistent track record of outperforming the market while increasing their dividend payouts. I have employed the Schwab U.S. Dividend Equity ETF (SCHD) as a benchmark to compare the performance of individual stocks. SCHD has a long history of exceptional performance, a higher yield than the S&P 500, and a proven record of growing dividends. I prefer investing in the ETF if a stock cannot outperform the benchmark. Based on this analysis, I have included several companies in my personal investment portfolio. Furthermore, I rely on this analysis to make timely additional purchases for my portfolio.
The ten-year dividend growth rate is one of the four main factors in the index behind SCHD. It’s also a proxy for success, although it’s not a perfect predictor. Share prices tend to follow strong dividend growth over long periods. Here’s a comparison of SCHD, AON, AMP, and KMI, which have a 10-year dividend growth record (even if KMI’s is negative). I’m willing to let bygones be bygones and see if cutting the dividend in the past has been any kind of successful indicator.
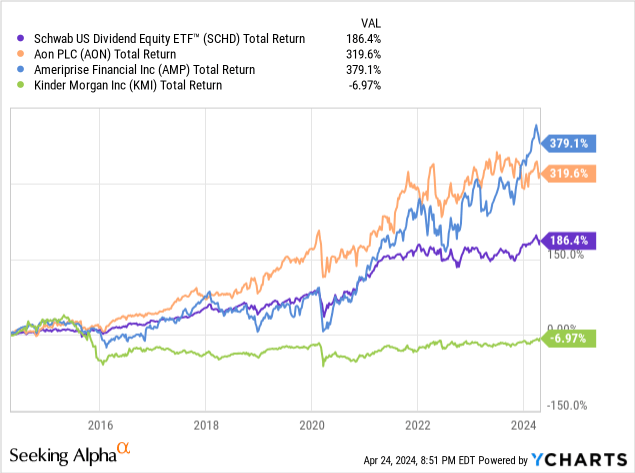
The performance of SCHD over the past decade generated a total return of 186%. Only three of the five companies this week have a 10-year history to review; let’s see how each ticker stacks up.
Both AON and AMP have been able to outperform SCHD significantly. AMP performed the best with a 379% total return. Interestingly, outperformance only started after the Covid crash in 2020. Before that, AMP generally performed slightly subpar to SCHD.
Conversely, AON has had a 320% total return, significantly better than SCHD. Their outperformance over the past decade has been consistent, rather than AMP. The orange line trending higher each year versus SCHD’s purple line.
Lastly, KMI finished down 7% over the decade. Cutting the dividend did, in fact, portend eight years of underperformance. I re-ran the numbers after the dividend cut, and they were better, though still significantly lagging behind SCHD (150% vs 64%).
Please do your due diligence before making any investment decision.

 Q2 2024 Earnings Call Transcript")

