JHVEPhoto
In our previous analysis of Skyworks Solutions, Inc. (NASDAQ:SWKS), we highlighted its Broad Markets segment’s growth was propelled by fast-growing end markets and believed the company’s Broad Markets would predominantly drive its future growth due to the high-growth end markets like data centers, offsetting stagnant revenue growth in its Mobile segment due to flattish demand for Apple’s (AAPL) next-gen iPhone, which constituted 59% of Skyworks’ revenue.
Nevertheless, Skyworks’ revenue growth in 2023 deviated from our earlier projections, as seen in the table below. The primary difference was due to the underperformance of the Mobile segment, which we anticipated to grow by 7.2% but instead experienced a negative growth of 14.4%. Moreover, our 2024 total revenue growth forecast of 6.4% in our previous analysis also deviates from the current analysts’ consensus of -6.55%. Therefore, we examined the underlying reasons for the poor growth performance and outlook. Additionally, we assessed the company’s future growth prospects and determined whether the company’s revenue growth could improve going forward.
|
Skyworks Revenue Breakdown ($ mln) |
Our Previous 2023 Forecast Revenue |
Actual 2023 Revenue |
Difference |
|
Mobile |
4,318 |
3,007 |
-1,311 |
|
Mobile Growth % |
7.2% |
-14.4% |
-21.6% |
|
Broad Markets |
1,538 |
1,766 |
228 |
|
Broad Markets Growth % |
4.80% |
-10.6% |
-15.38% |
|
Total |
5,856 |
4,772 |
-1,083 |
|
Total Growth |
6.6% |
-13.0% |
-19.6% |
Source: Company Data, Khaveen Investments
Segment Performance Impacted by Market Weaknesses
Firstly, we examined the company’s segment performance to analyze what has impacted Skyworks’ revenue growth in 2023.
|
Revenue Breakdown by Segment ($ mln) |
2019 |
2020 |
2021 |
2022 |
2023 |
Average |
|
Mobile |
2,401 |
2,360 |
3,707 |
3,511 |
3,007 |
|
|
Mobile Share % |
71% |
70% |
73% |
64% |
63% |
|
|
Growth % |
-1.7% |
57.0% |
-5.3% |
-14.4% |
8.9% |
|
|
Broad Markets |
976 |
996 |
1,402 |
1,975 |
1,766 |
|
|
Broad Markets % |
29% |
30% |
27% |
36% |
37% |
|
|
Growth % |
2.0% |
40.9% |
40.8% |
-10.6% |
18.3% |
|
|
Total |
3,377 |
3,356 |
5,109 |
5,486 |
4,772 |
|
|
Growth % |
-0.6% |
52.3% |
7.4% |
-13.0% |
11.5% |
Source: Company Data, Khaveen Investments
Based on the table, Skyworks’ total revenue average growth rate was 11.5%, driven mainly by the growth in the Broad Markets segment with an average growth rate of 18.3%. Following the acquisition of Silicon Labs’ (SLAB) Infrastructure & Automotive business in 2021, the company’s total revenue growth rate surged by 52.3%, driven by the “early adoption of 5G” in the Mobile Segment and the revenue gained from Silicon Labs in Broad Markets segment. However, since then, the Mobile segment’s revenue growth rate has been on a declining trend, with a negative growth of 14.4% in 2023. We believe this could be attributed to the negative growth of smartphone shipments, which was -10.1% in FY2023, as illustrated in the table below.
|
Smartphone Shipments (FY Ending Sept) |
Q4 ’21 |
Q1′ 22 |
Q2′ 22 |
Q3′ 22 |
Q4′ 22 |
Q1′ 23 |
Q2′ 23 |
Q3′ 23 |
FY 2022 |
FY 2023 |
|
Total Shipments (mln) |
362.4 |
314.1 |
286.0 |
301.9 |
300.3 |
268.6 |
265.3 |
302.8 |
1,264 |
1,138 |
|
Total Shipments Growth % YoY |
-6.1% |
-9.1% |
-8.7% |
-8.8% |
-17.1% |
-14.5% |
-7.2% |
0.3% |
-10.1% |
Source: IDC, Khaveen Investments
On the other hand, Broad Markets continued to outperform in 2022 with a 40.8% growth rate but dropped to -10.6% in 2023. The Broad Markets segment experienced a robust double-digit growth in both 2021 and 2022 (40.9% and 40.8% respectively) due to the acquisition of Silicon Labs’ Infrastructure & Automotive business. This also resulted in a 9% increase in Broad Markets’ share of revenue in 2022. However, in 2023, its revenue growth rate declined sharply by -10.6%, with management attributing the segment’s performance to challenging conditions marked by “crosscurrents” and reaching “the bottom”.
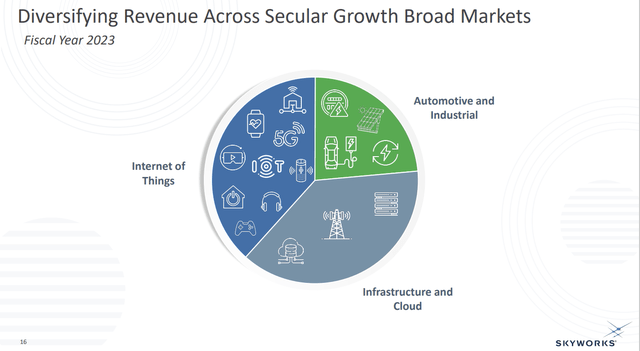
Following the acquisition of Silicon Lab, Skyworks restructured the Broad Markets segment by including Cognitive Audio and Gaming into the Internet of Things subsegment, while expanding the Infrastructure and Cloud subsegment.
In addition, the company introduced three new products in 2023 focusing on the Broad Markets, including Digital Radio Coprocessors (Automotive), LPWAN Reference Design (Industrial and IoT), and Next-Generation Si89xx Product Family (Automotive and Infrastructure).
Apple vs Non-Apple Revenue
In our previous analysis of Skyworks, we highlighted the company’s reliance on Apple, with Apple revenue accounting for 58% of total company revenue in 2022. In 2023, Apple’s revenue contribution was even higher at 66%. Additionally, according to the company’s annual report, its RF chips are used in other products such as laptops, tablets and headphones. Therefore, the non-Apple revenue (34% of Total revenue) includes both Android-related revenue and Broad Markets revenue.
|
Skyworks Revenue Breakdown |
2018 |
2019 |
2020 |
2021 |
2022 |
2023 |
Average |
|
Apple Revenue as % of Total Revenue |
47% |
51% |
56% |
59% |
58% |
66% |
|
|
Apple Revenue ($ mln) |
1,818 |
1,722 |
1,879 |
3,014 |
3,182 |
3,150 |
|
|
Growth (%) |
-5.3% |
9.1% |
60.4% |
5.5% |
-1.0% |
13.8% |
|
|
Non-Apple Revenue as % of Total Revenue |
53% |
49% |
44% |
41% |
42% |
34% |
|
|
Non-Apple Revenue ($ mln) |
2,050 |
1,655 |
1,477 |
2,095 |
2,304 |
1,623 |
|
|
Growth (%) |
-19.3% |
-10.8% |
41.9% |
10.0% |
-29.6% |
-1.6% |
|
|
Total Revenue ($ mln) |
3,868 |
3,377 |
3,356 |
5,109 |
5,486 |
4,772 |
|
|
Growth (%) |
-12.7% |
-0.6% |
52.3% |
7.4% |
-13.0% |
6.7% |
Source: Company Data, Khaveen Investments
While Apple revenue’s average growth rate of 13.8% outperformed the total revenue’s average growth of 6.7%, the non-Apple revenue exhibited a significantly lower average growth rate of only -1.6%. Moreover, both segments experienced a negative growth rate in 2023, with -1% for Apple revenue and -29.6% for non-Apple. We highlighted the market weakness in smartphone shipments as discussed previously and believe it is one of the factors contributing to the negative growth.
In addition, the semiconductor revenue growth in FY2023 declined by 14.6% compared to 2022 based on SIA data, and the company’s Broad Markets segment growth was also in line with the -10.6% growth rate. Therefore, we believe that the company’s decline in total revenue growth rate in 2023 (-13.0%) was attributed to both Android smartphone shipments and Broad Markets segment weakness.
Brighter Outlook for Organic Growth
Next, we examined the organic growth outlook for both of the company’s segments, Mobile and Broad Markets.
Mobile
The total smartphone shipment growth in FY2023 declined by 10.1% compared to the growth in FY2022, driven by an 11.2% decline in non-Apple (Android) shipments. We believe the sequential decline growth in the smartphone market shipments suggests market weakness was the main factor rather than the company’s internal weakness. However, the total shipment growth has started recovering from Q1 2023.
|
Smartphone Market Shipments Breakdown (FY Ending Sep) |
Q4′ 22 |
Q1′ 23 |
Q2′ 23 |
Q3′ 23 |
FY 2022 |
FY 2023 |
|
Apple Shipments (units) |
72.4 |
55.1 |
42.4 |
53.6 |
236 |
223 |
|
Apple Shipments Growth % YoY |
-14.7% |
-2.6% |
-1.1% |
3.2% |
-5.4% |
|
|
Non-Apple Shipments (units) |
227.9 |
213.5 |
222.9 |
249.2 |
1,028 |
914 |
|
Non-Apple Shipments Growth % YoY |
-17.9% |
-17.1% |
-8.3% |
-0.3% |
-11.2% |
|
|
Total Shipments (units) |
300.3 |
268.6 |
265.3 |
302.8 |
1,264 |
1,138 |
|
Total Shipments Growth % YoY |
-17.1% |
-14.5% |
-7.2% |
0.3% |
-10.1% |
Source: IDC, Khaveen Investments
In our previous analysis of Skyworks, we expected this segment’s outlook to remain stagnant, and we also highlighted the decline in the RF smartphone shipment in 2023 by -3.6% in our previous analysis of Qorvo (QRVO). Examining the RF revenue of the leading RF chipmakers, we observed a weakness in the RF market in 2023, as the top 5 RF chipmakers’ total revenue growth rate in 2023 declined by 13%. Additionally, this number was also in line with Skyworks’ revenue growth, thus indicating end-market weakness rather than the company’s internal weakness.
Company Data, Khaveen Investments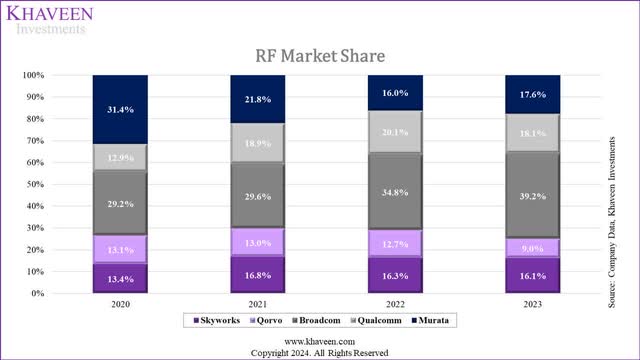
Based on our updated market share, though the company’s market share decreased slightly from 16.3% to 16.1% in 2023, it was still relatively stable compared to other competitors and ranked 3rd in the market. We believe it could be attributed to the company’s technological innovation and product competitiveness highlighted in our previous analysis of Skyworks. On the other hand, Qorvo and Qualcomm’s (QCOM) market share declined by 3.7% and 2% respectively, while Broadcom (AVGO) and Murata (OTCPK:MRAAY) gained a market share of 4.4% and 1.6% respectively.
While the growth in Apple’s revenue slows down, we expect the company to gain more revenue from its Android customers as management highlighted the stabilization of the Android ecosystem from its latest earnings briefing.
Excess supply conditions are abating and inventory levels in the distribution channel and at the OEM level are normalizing. Customers are starting to restock inventory, albeit gradually as supply and demand dynamics improve and new phones are introduced into the market. – Liam Griffin, CFO
Based on our previous analysis of Qorvo, we anticipated a recovery in the RF market in 2024 with a growth rate of 4.6%. In addition, we updated our 5G RF growth forecasts based on the share of 5G shipments’ growth and 5G RF content increase. Though the company’s Mobile segment revenue growth in 2023 (-14.4%) did not reach the 5G RG growth of 7.4%, we believe it is justified based on the end market weaknesses and the decline in smartphone shipments as discussed previously. However, we anticipate a rebound in the 5G RF market, with a projected growth rate of 4.9% in 2024F, aligning with the broader RF market growth rate, though lower than our initial forecast of 6.9% due to the reduced increase in 5G market share (b).
|
5G RF Growth Forecasts |
2020 |
2021 |
2022 |
2023 |
2024F |
2025F |
2026F |
|
Share of 5G Shipments |
20% |
41% |
54% |
62% |
67% |
73% |
77% |
|
Share of non-5G |
80% |
59% |
46% |
38% |
33% |
28% |
23% |
|
5G RF Content Increase (a) |
1.93 |
1.93 |
1.93 |
1.93 |
1.93 |
1.93 |
1.93 |
|
5G Share Increase (b) |
18% |
20.5% |
13.3% |
8.0% |
5.3% |
5.3% |
4.4% |
|
5G RF Growth Rate (c) |
16.9% |
19.0% |
12.4% |
7.4% |
4.9% |
4.9% |
4.0% |
* c = [(b x a) + (1-b) x 1)]-1
Source: IDC, Khaveen Investments
Overall, despite expectations for improvement, we anticipate the Mobile segment’s growth in 2024 to be negative. This is primarily attributed to the negative year-over-year growth in Q1 2024 and conservative management guidance for Q2 2024. For 2025 and 2026, we based it on our forecast of the 5G RF market growth at 4.9% and 4% respectively.
|
Skyworks Revenue Projections ($ mln) |
2023 |
2024F |
2025F |
2026F |
|
Mobile |
3,007 |
2,901 |
3,043 |
3,166 |
|
Growth % |
-14.4% |
-3.5% |
4.9% |
4.0% |
Source: Company Data, Khaveen Investments
Broad Markets
Subsequent quarterly revenue data from Q4 2023 and Q1 2024 indicated a continued decline in the Broad Markets segment’s YoY growth rate (-15.8% and -25.1% respectively), which underperformed compared to its total revenue’s YoY growth (-13.4% and -9.6% respectively).
|
Revenue Breakdown by Segment ($ mln) |
Q1 2023 |
Q4 2023 |
Q1 2024 |
|
Broad Markets |
465 |
427 |
348 |
|
Broad Markets Share of Total % |
35% |
35% |
29% |
|
Growth % (YoY) |
-15.8% |
-25.1% |
|
|
Total |
1,329 |
1,219 |
1,202 |
|
Growth % (YoY) |
-13.4% |
-9.6% |
Source: Company Data, Khaveen Investments
In our previous analysis of Microchip (MCHP), we highlighted the DAO semicon market segment’s continued downward growth trend from Q2 2022 to Q4 2023, while the Logic and Memory market segments began to recover in the first half of 2023. Furthermore, we expected the DAO segment to begin recovering in Q2 2024 and fully recover by Q3 to Q4 2024. Thus, the Broad Markets’ quarterly YoY growth in Q4 2023 and Q1 2024 appeared to be in line with the DAO’s segment growth, thus we expect it could recover from Q2 2024 onwards.
We updated the market CAGR for each subsegment and calculated the weighted average CAGR based on the latest subsegments’ breakdown. Overall, we expect the Broad Markets segment to be the main driver for the company’s revenue growth with a CAGR of 15.3%, in line with the findings in our previous analysis of Skyworks.
|
Broad Markets Subsegments |
Breakdown % |
Forecast CAGR |
|
Internet of Things (IoT) |
~40% |
16.7% |
|
Infrastructure and Cloud |
~40% |
17.1% |
|
Automotive and Industrial |
~20% |
8.7% |
|
Weighted Average |
15.3% |
Source: MarketsandMarkets, Fortune Business Insights, Khaveen Investments
We updated our revenue projections for the Broad Markets in the table below. We based our forecast for 2024 on management guidance for Q2 2024 and our outlook for DAO segments, which we expect to only recover in Q3 2024 onwards and assumed our derived long-term weighted average CAGR of 15.3% in Q4 2024. For 2025 onwards, we used our long-term weighted average CAGR to forecast its revenue.
|
Skyworks Revenue Projections ($ mln) |
2023 |
2024F |
2025F |
2026F |
|
Broad Markets |
1,766 |
1,592 |
1,835 |
2,115 |
|
Growth % |
-10.58% |
-9.84% |
15.27% |
15.27% |
Source: Company Data, Khaveen Investments
Strong Financials Support Inorganic Growth Opportunities
Lastly, we examined Skyworks’ capability for future M&A within the Broad Markets as management highlighted the potential following its robust growth in the Broad Markets after the acquisition of Silicon Labs.
… we focus on becoming a more diverse company in part through organic investments in that business but we have the optionality to accelerate through M&A, and we’re working that. – Kris Sennesael, Senior VP & CFO
Therefore, we examined the possibility of another M&A deal to support the Broad Markets segment’s growth.
Free Cash Flow
Company Data, Khaveen Investments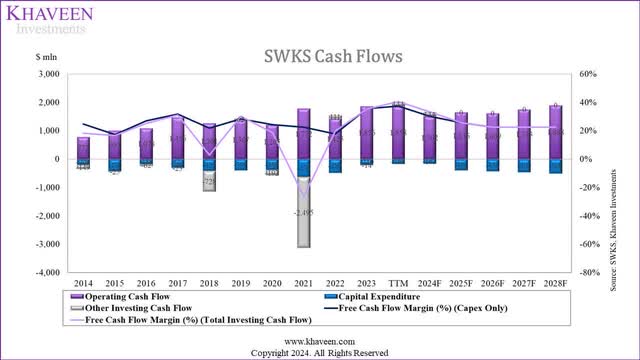
|
Cash Flow ($ mln) |
2020 |
2021 |
2022 |
2023 |
TTM |
|
Operating Cash Flow |
1,205 |
1,772 |
1,425 |
1,856 |
1,858 |
|
Capital Expenditure |
-389 |
-638 |
-489 |
-210 |
-169 |
|
Other Investing Cash Flow |
-192 |
-2,495 |
111 |
-14 |
144 |
|
Free Cash Flow Margin (%) (Capex Only) |
24.29% |
22.41% |
17.74% |
35.56% |
37.34% |
|
Free Cash Flow Margin (%) (Total Investing Cash Flow) |
18.57% |
-26.44% |
19.75% |
35.26% |
40.45% |
Source: Company Data, Khaveen Investments
From the table, its operating cash flow showed a growth trend, while capex showed a declining trend after the acquisition in 2021. Moreover, its FCF margin (capex only) increased to 37.34% TTM, indicating efficient capital management. Therefore, we believe that the company has strong FCFs which could potentially be utilized for future M&A activity.
Net Debt
|
Net Debt (Net Cash) ($ mln) |
2020 |
2021 |
2022 |
2023 |
TTM |
|
Debt |
716 |
3,058 |
3,131 |
2,185 |
1,866 |
|
Cash & Cash Equivalents |
975 |
1,020 |
586 |
734 |
1,046 |
|
Net Debt (Net Cash) |
-259 |
2,038 |
2,544 |
1,450 |
821 |
|
Cash to Debt Ratio |
1.4x |
0.3x |
0.2x |
0.3x |
0.6x |
Source: Company Data, Khaveen Investments
From the table, its debt has consistently decreased since 2022 while cash has increased accordingly. Although the cash-to-debt ratio fluctuated, reaching a low point in 2022 due to the acquisition (0.2x), we observed an improvement in the ratio which is now at 0.6x. We expect the company’s cash-to-debt ratio to improve going forward and exceed the 2020 level (1.4x) in the next few years.
Company Data, Khaveen Investments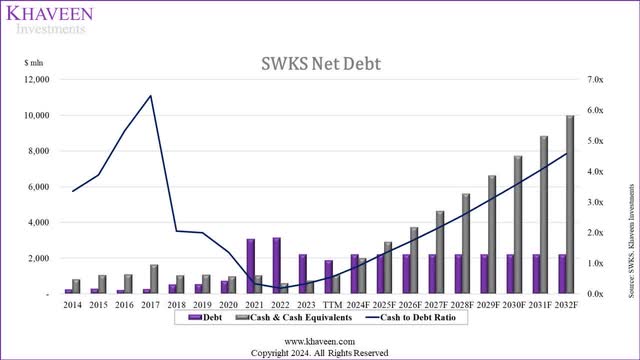
Previous Acquisition
Examining its previous acquisition in July 2021 which cost $2.75 bln, we observed an increase in Broad Markets’ share of revenue by 9% and revenue growth of 40.8% in 2022. While the segment experienced negative growth in 2023, we believe it was due to the end-market weaknesses as mentioned in the first point. Additionally, the segment’s revenue growth exceeded total revenue growth in both 2022 and 2023. Therefore, we see an opportunity for the company to pursue more M&A, aiming to diversify its segments into more high-growth markets.
|
Revenue Breakdown by Segment ($ mln) |
2021 |
2022 |
2023 |
|
Broad Market |
1,402 |
1,975 |
1,766 |
|
Breakdown % |
27% |
36% |
37% |
|
Growth % |
40.8% |
-10.6% |
|
|
Total |
5,109 |
5,486 |
4,772 |
|
Growth % |
7.4% |
-13.0% |
Source: Company Data, Khaveen Investments
Outlook
With strong FCF margins and debt management, we believe the company has the capability to pursue more M&A. We anticipate the company’s cash-to-debt reaching or even exceeding its 2020 level by FY2026, with projected ratios of 1.71x. We calculated the cash maintenance required from 2026 onwards, given the cash-to-debt ratio of 1.36x (2020 level), to be $2,976 mln. Considering the industry average P/S ratio stands at 5.43x, we estimated the potential incremental revenue from engaging in M&A activities by dividing the average P/S ratio by the excess cash each year. The table below shows potential M&A revenue from 2026 onwards utilizing the company’s excess cash.
|
Net Debt (Net Cash) ($ mln) |
2024F |
2025F |
2026F |
2027F |
2028F |
2029F |
|
Debt |
2,185 |
2,185 |
2,185 |
2,185 |
2,185 |
2,185 |
|
Cash & Cash Equivalents |
1,985 |
2,908 |
3,745 |
4,652 |
5,634 |
6,699 |
|
Net Debt (Net Cash) |
200 |
(723) |
(1,560) |
(2,467) |
(3,450) |
(4,514) |
|
Cash to Debt Ratio |
0.91 |
1.33 |
1.71 |
2.13 |
2.58 |
3.07 |
|
Cash Maintenance Required |
N/A |
N/A |
2,976 |
2,976 |
2,976 |
2,976 |
|
Excess Cash |
N/A |
N/A |
769 |
1,676 |
2,658 |
3,723 |
|
P/S ratio |
N/A |
N/A |
5.43 |
5.43 |
5.43 |
5.43 |
|
Acquisition-adjusted Cash to Debt Ratio |
N/A |
N/A |
1.36 |
1.36 |
1.36 |
1.36 |
|
M&A Revenue |
N/A |
N/A |
141.63 |
308.73 |
489.76 |
685.86 |
Source: Company Data, Khaveen Investments
Verdict
|
Skyworks Revenue Projections ($ mln) |
2023 |
2024F |
2025F |
2026F |
|
Mobile |
3,007 |
2,901 |
3,043 |
3,166 |
|
Mobile Growth % |
-14.4% |
-3.5% |
4.9% |
4.0% |
|
Broad Markets |
1,766 |
1,592 |
1,835 |
2,115 |
|
Broad Markets Growth % |
-10.58% |
-9.84% |
15.27% |
15.27% |
|
Total Organic Revenue |
4,772 |
4,493 |
4,878 |
5,281 |
|
Total Growth % |
-13.0% |
-5.8% |
8.6% |
8.3% |
Source: Company Data, Khaveen Investments
We compiled our revenue forecast for Skyworks for 2024 based on management guidance and our anticipated outlook for the subsegments, which is -5.8% compared to 2023 revenue. From 2025 onwards, we based our Mobile segment’ forecast on the 5G RF market growth and Broad Markets’ forecast on our weighted average CAGR.
In addition, we summarized in the table below our projections of M&A revenue as % of Total Organic Revenue from 2026 onwards, assuming a consistent growth rate of 8.3% post-acquisition. Taking into account the acquisition of Silicon Labs three years ago (in July 2021), we anticipate future M&A activity to positively impact the company’s performance over the subsequent three years. Therefore, we did not taper down our forecast revenue growth until 2030 as we usually do, to account for the increased M&A revenue in those years.
|
Potential M&A Revenue ($ mln) |
2026F |
2027F |
2028F |
2029F |
|
Total Organic Revenue |
5,281 |
5,718 |
6,190 |
6,702 |
|
Growth % |
8.3% |
8.3% |
8.3% |
8.3% |
|
M&A Revenue |
142 |
309 |
490 |
686 |
|
M&A as % of Total Organic revenue |
2.68% |
5.40% |
7.91% |
10.23% |
Source: Company Data, Khaveen Investments
All in all, we believe that Skyworks’ performance in 2023 was impacted by end-market weaknesses rather than internal weakness amid the decline in the smartphone market. While the Mobile segment still faces short-term setbacks, we anticipate an improvement in 2024 and a full recovery by 2025, in line with our 5G RF market growth forecasts. Moreover, we believe that the Broad Markets segment, while experiencing short-term headwinds, remains poised for long-term growth, supported by strategic segment restructuring and innovative product introductions. Furthermore, with strong free cash flows and debt management, we believe the company could pursue M&A activity, leveraging its robust financials and potential market opportunities.
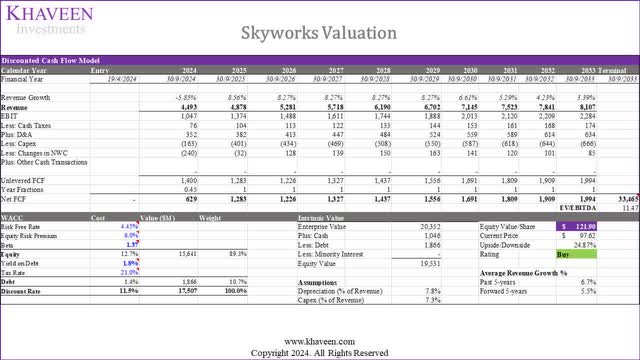
We updated our DCF valuation, retaining similar assumptions from our previous analyses. Based on a discount rate of 11.5% (company’s WACC) and terminal value based on the company’s historical average 5-year EV/EBITDA of 11.47x, we derived an upside of 24.87%, thus we retain a Buy rating. Our valuation incorporates an assumption of future M&A activity starting in 2026, prompting us to maintain higher growth forecasts until 2030 without tapering down as we usually do. However, excluding this assumption, our model derives a more modest upside of 11%.
