imantsu
Investment Thesis
Xylem Inc.’s (NYSE:XYL) growth over the past 7 years was due to a combination of organic growth and acquisitions. Despite the acquisitions, there was only single-digit revenue growth. There was also no sign of improving contribution margins. Returns were on a downtrend. This is not a “wonderful company”. While it is financially sound, there is not enough margin of safety based on an optimistic scenario. This is not an investment opportunity.
Business background
Xylem described itself as a leading global water technology company that designs, manufactures, and services highly engineered products and solutions primarily in the water sector.
The company operates through four reportable segments each catering to specific aspects of water management and related technologies.
- Water Infrastructure focuses on water transportation and treatment, including products from the Evoqua acquisition.
- Applied Water serves residential, commercial, and industrial markets with various water-related products.
- Measurement and Control Solutions develop technology for water and energy resource conservation and analytical instrumentation.
- Integrated Solutions and Services. This new segment was introduced in 2023 to offer tailored solutions and services for improved operational reliability and environmental compliance.
The growth of Xylem has been via a combination of organic growth and acquisitions. Most of the time, the size of the cash acquisitions relative to the CAPEX was small.
However, in 2016, the company completed a USD 1.7 billion cash acquisition of Sensus Worldwide Limited that boosted the 2017 revenue. As such I tracked the performance of Xylem from 2017.
In May 2023, the company completed the acquisition of Evoqua Water Technologies Corp. According to the company, this was an all-stock transaction with “…an implied enterprise value of approximately USD 7.5 billion.”
Given that Xylem’s total assets in 2022 was USD 8 billion, this acquisition would distort the 2023 results and make them not comparable to the earlier years. As such many of my comparisons were based on the 2017 to 2022 values.
Over the past 7 years, the Water Infrastructure segment was the biggest revenue contributor. In 2023, this segment accounted for 40 % of the total revenue. Refer to the left part of Chart 1.
Although Xylem serves the global market, over the past 7 years, the US accounted for about half of the total revenue. Refer to the right past of Chart 1. In 2023, revenue from the US accounted for 54 % of the total revenue.
Chart 1: Segment revenue (Author)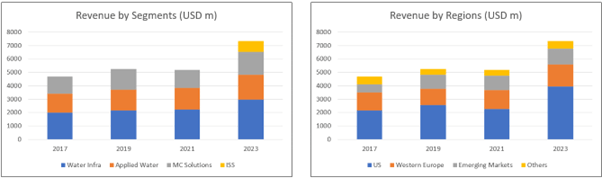
Notes to Chart 1
- MC Solutions = Measurement and Control Solutions.
- ISS = Integrated Solutions and Services.
Operating trends
I looked at 2 groups of metrics to get a picture of the operating trends.
- The left part of Chart 2 shows the trends for 3 metrics – revenue, PAT, and gross profitability (gross profits / total assets).
- The right part of Chart 2 shows the returns – Operating return (NOPAT/Total Capital Employed), ROE and ROA.
Even ignoring 2023, revenue and PAT showed uptrends. But the profits were more volatile and over the past 7 years the PAT margin averaged 7.6 %.
- The increase in the PAT in 2018 was due to a reduction in the tax rate from 29.2 % in 2017 to 6.2 % in 2018 due to the Tax Cuts and Jobs Act.
- The decline in profits in 2019 was partly due to one-off charges of USD 181 million for impairments, restructuring, and realignment costs.
- The performance of 2020 was impacted by COVID-19. But you can see the performance bouncing back to continue with the uptrend in the following year.
Chart 2: Performance Index and Return Trends (Author)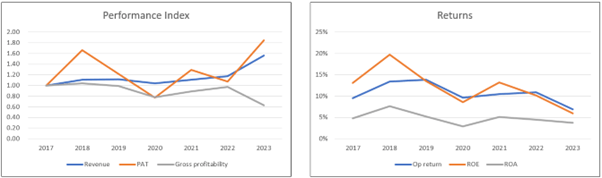
Note to Performance Index chart. To plot the various metrics on one chart, I have converted the various metrics into indices. The respective index was created by dividing the annual values by the respective 2017 values.
The key concern was the lower gross profitability from 2019 to 2022 compared to 2017. This meant lower capital efficiencies. The decrease in capital efficiencies is reflected in the downtrend of the various return metrics. This is even if you ignore the 2023 results.
This decline is very pronounced for the operating return. To get a better picture of this, I broke down the operating profit into various components as shown in Chart 3. In the chart, the gap between the revenue and total costs (fixed costs + variable costs) represents the operating profits.
While revenue had grown, contribution margin had declined from 2017 to 2022.
Chart 3: Op Profit Profile (Author)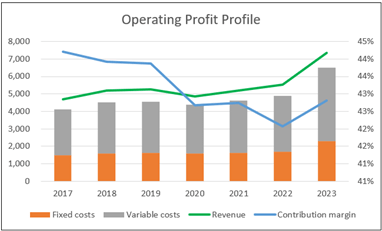
Note to Op Profit Profile. I broke down the operating profits into fixed costs and variable costs.
- Fixed cost = SGA, Depreciation & Amortization and Others.
- Variable cost = Cost of Sales – Depreciation & Amortization.
- Contribution = Revenue – Variable Cost.
- Contribution margin = Contribution/Revenue.
Growth
From 2017 to 2023, revenue grew at 7.7 % CAGR. As can be seen from Charts 2 and 3, the bulk of the revenue growth over the past 7 years came in 2023.
- From 2017 to 2022, revenue grew at 3.2 % CAGR.
- But revenue grew by 33.4 % between 2022 and 2023. This was due to the Evoqua acquisition.
Based on the data provided by the company, I deduced that half of the revenue growth over the past 7 years was due to organic growth. Refer to Table 1.
Table 1: Sources of revenue growth 2017 to 2023 (Author)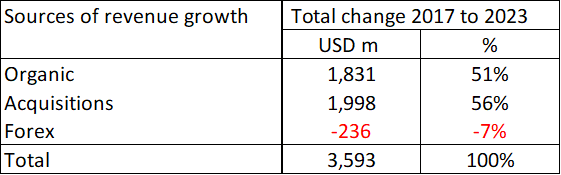
I would not consider Xylem a high-growth company. Even with acquisitions, growth was in single digits. Based only on organic growth, I estimated that revenue grew at around 3% CAGR.
This is also not a high-growth sector as illustrated by the following:
“…The global water and wastewater treatment market is projected to grow…at a CAGR of 7.5%…” Fortune Business Insights
“…Water Market… is expected to grow at a CAGR of 4.43% from 2023 to 2030.” Verified Market Research
Financial position
I would assess Xylem as financially sound based on the following. I would consider it a cash cow.
- As of the end of Dec 2023, it had USD 1.01 billion in cash and short-term investments. This was about 6 % of its total assets.
- It has a 20 % debt-capital ratio as of the end of Dec 2023. This was half the 2017 ratio. The debt-capital ratio for the environment and wastewater services sector based on Damodaran’s Jan 2023 data set was 20 %.
- From 2017 to 2023, it generated USD 4.9 billion cash flow from operations compared to the net income of USD 2.9 billion. This is a very good cash conversion ratio.
- It has a good capital allocation track record as can be seen from Table 2. It was able to cover the CAPEX, acquisitions, dividends, and share buybacks with the cash flow from operation.
Table 2: Sources and Uses of Funds 2017 to 2023. (Author)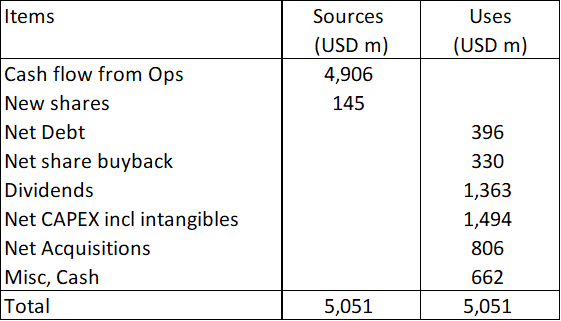
While I rated Xylem as financially sound, I have two concerns:
- Over the past 7 years, the average return on capital was 10%. This was only a bit higher than its WACC of 9.4 %.
- It had a long payback period for the 2016 acquisition.
Acquisition payback
In 2016, the company spent USD 1.6 billion on acquisitions. From 2017 to 2023, as per Table 1, revenue increase from organic growth was USD 1.8 billion.
This organic growth included the growth from assets that were in the books before the 2016 acquisitions. Looking at the increased organic revenue and the 7.6 % average PAT margin over the past 7 years, I estimated that the payback period for the 2016 acquisitions was at least 11 years.
No doubt we had the 2020 COVID-19 year. But I don’t think this is a good performance. Furthermore, when you look at Chart 3, there is no evidence that the acquisition improved the contribution margin. The declining return trends from 2017 to 2022 supported this view.
Summary of fundamentals
What are the key takeaways?
- Xylem is not a high-growth company in a sector that is not considered a high-growth one.
- There is no evidence of improving operating efficiencies. I would use the average 2017 to 2022 values to reflect the normalized picture.
- This is a cash cow with an average dividend payout ratio of 49% over the past 7 years.
Given Xylem’s history, I would expect further large-sized acquisitions in the future. Sure, the company would get bigger. But given its track record, there is little likelihood of improving returns. Together with the long payback period, it might be better to return the monies to shareholders than spend them on acquisitions.
Valuation
I considered 2 scenarios when valuing Xylem.
- Scenario 1. This is a conservative scenario. I assumed that there was no further major acquisition and that the company would grow at 4% in perpetuity. I used a single-stage valuation model here.
- Scenario 2. This is an optimistic scenario. I assumed that there would be another major acquisition that would boost revenue by 20% in year 6. Thus, over the next 5 years, earnings would be based on the 2023 revenue with 4% annual growth. Then in the 6th year, there would be a jump in revenue. I used a multi-stage valuation model here.
Under Scenario 1, I obtained an intrinsic value of USD 84 per share.
Under Scenario 2, I obtained an intrinsic value of USD 141 per share.
The market price of Xylem as of 2 April 2024 was USD 128 per share. There is no margin of safety under Scenario 1. But there is a 10 % margin of safety under Scenario 2.
Single-stage valuation model – Scenario 1
The value was estimated from the following Free Cash Flow to the Firm (FCFF) equation:
Value to the Firm = FCFF X (1 + g) / (WACC – g)
FCFF = EBIT(1- t) X (1 – Reinvestment rate).
EBIT(1-t) was estimated based on the operating profit profile as shown in Chart 3.
Value of the equity = Value to the Firm + Excess Total Capital Employed + Cash – Debt – Minority Interests.
Table 3 illustrates the calculation based on a single-stage valuation model.
Table 3: Estimating the intrinsic value under Scenario 1 (Author)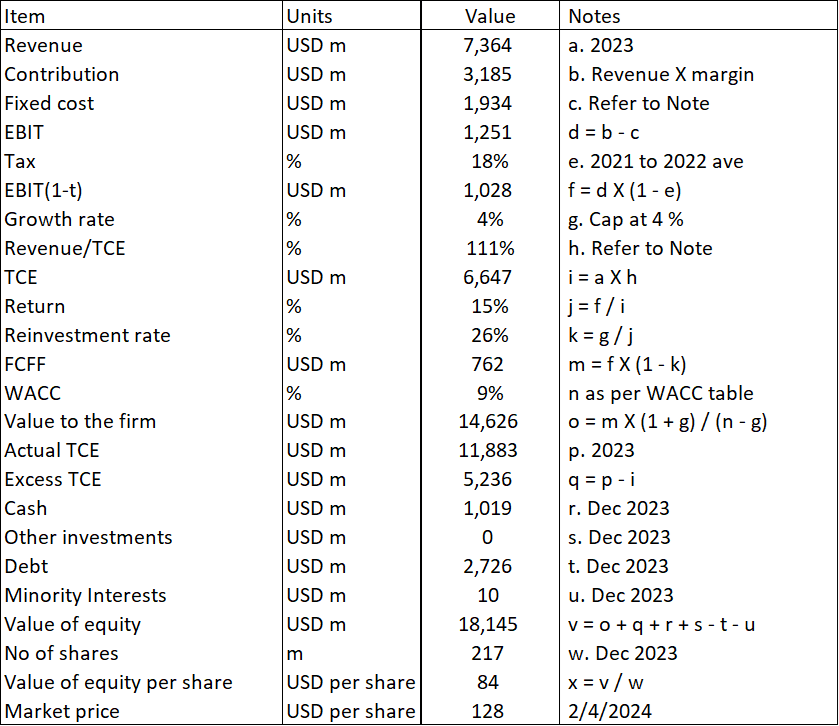
Notes to Table 3:
Item b. Margin based on the 2017 to 2022 average.
Item c. Fixed costs based on the past 3 years. Others based on the past 7 years.
Item h. TCE turnover based on 2017 to 2022 average.
Item n. WACC based on a Google search for the term “Xylem WACC” as per Table 4.
Table 4: Estimating the WACC (Various)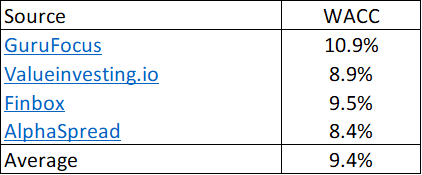
The multi-stage valuation model – Scenario 2
In this model, I assumed that the FCFF as computed in Table 2, item m would grow at 4% per annum for the next 5 years. Then in year 6, the company would undertake a major acquisition that would increase revenue by 20%. This 20% was based on my estimate of the revenue growth in 2017 due to acquisition.
Table 5 illustrates the calculation. Note that the inputs in this table is linked to Tables 3 and Table 6.
Table 5: Calculating the intrinsic value under Scenario 2 (Author)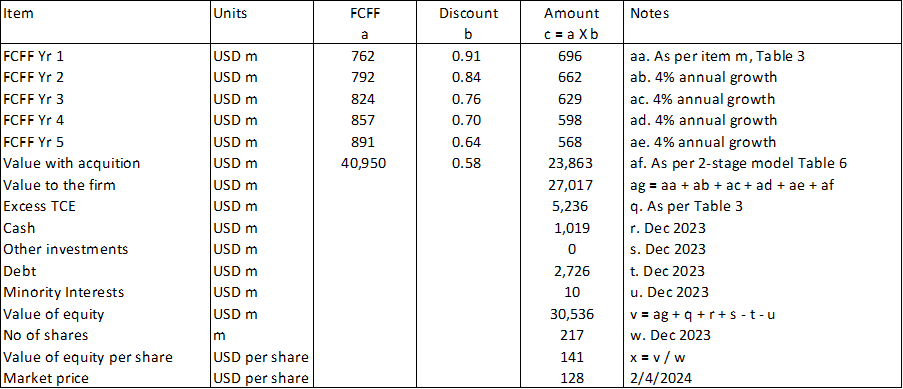
Notes to Table 5: The FCFF inputs for Year 1 was tied to the values obtained in Table 3. The value of the firm in Year 6 with acquisition was determined as per Table 6.
Table 6: Estimating the intrinsic value with acquisition (Author)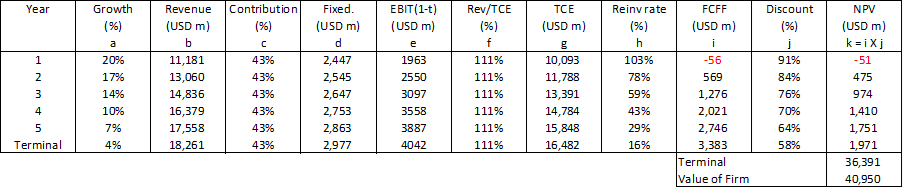
Notes to Table 6.
a) Based on the 2017 growth revenue growth rate.
b) The starting revenue was based on the 2023 revenue growing at 4% CAGR for the next 6 years.
c) 2017 to 2022 average.
d) Starting cost based on the item c of Table 2 with 6 years of growth of 4%.
e) Revenue X Net Margin and after accounting for Fixed costs.
f) 2017 to 2022 average.
g) Revenue X (Revenue/TCE) ratio.
h) Based on the growth equation of Growth = Return X Reinvestment rate.
i) EBIT(1-t) X (1 – Reinvestment rate).
j) Assumed constant D/E ratio.
Risks and limitations
My optimistic Scenario 2 hinges on when the major acquisition takes place. I assumed that the major acquisition would be in 6 years. This was on the basis that it would take time for the company to “digest” Evoqua. This is not an unreasonable assumption given that the last major acquisition before Evoqua was in 2016.
The timing of the acquisition affects the valuation due to the discounting process. Because of the discount rate (time value of money), the intrinsic value would be smaller the further out in time the major acquisition takes place.
If you assumed that the major acquisition takes place immediately, the intrinsic value would be USD 161 per share. In other words, the margin of safety would be increased to 26%.
I do not have a crystal ball on when the company would act. But think of this as a potential upside.
Conclusion
I would not consider Xylem a “wonderful company”. While it is financially sound, I have several concerns about its operations:
- There was declining contribution margin.
- It has declining returns.
- Growth was due to both acquisitions and organic growth. Despite the acquisitions, there was only single-digits CAGR.
- This is not a double-digit growth sector.
At the same time, my valuation based on an optimistic scenario does not provide a 30% margin of safety. You can understand why I do not see Xylem as an investment opportunity.
Looking at the track record, I would think that instead of doing more major acquisitions, it would be better to return the “excess” funds to shareholders in the form of dividends and buybacks. In Xylem case, being bigger does not lead to better shareholders’ value creation.
I am a long-term value investor and my analysis and valuation are based on this perspective. This is not an analysis for those hoping to make money over the next quarter or so.

 Q2 2024 Earnings Call Transcript")

