hapabapa
Introduction:
Bristol-Myers Squibb (NYSE:BMY) fought its way up the ranks to join some of the top pharma companies by revenue, attaining true “big-pharma” level after its 2019 acquisition of Celgene. With its new acquisition came along a more shareholder-friendly dividend and buyback policy, greatly helped by the prosperous Revlimid product line. But the company has had some growing pains as it’s digested one of the largest pharmaceutical mergers in history. These challenges are some of the major drivers of the company’s price decline, and from my perspective I would consider avoiding the company for the time being. As I do not currently own shares, I’m avoiding until I see the revenue start to climb beyond the Revlimid and Eliquis declines, only after which I might think to consider a potential position.
Ascent to Big Pharma:
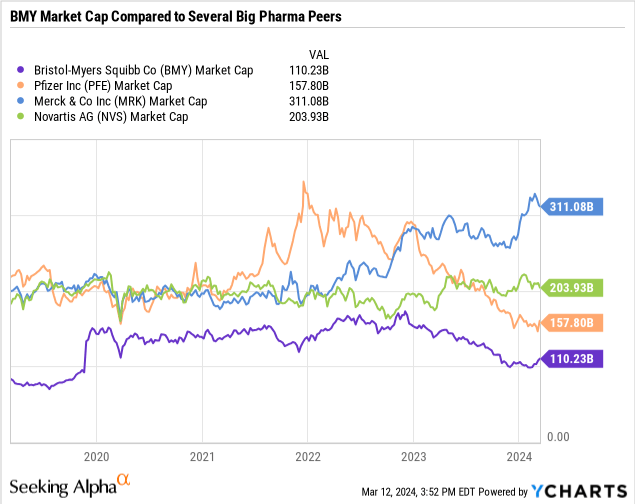
To go into more detail, BMY reached the levels of some of its big pharma peers such at Merck (MRK), Pfizer Inc. (PFE), and Novartis (NVS) in terms of market cap after its Celgene acquisition.
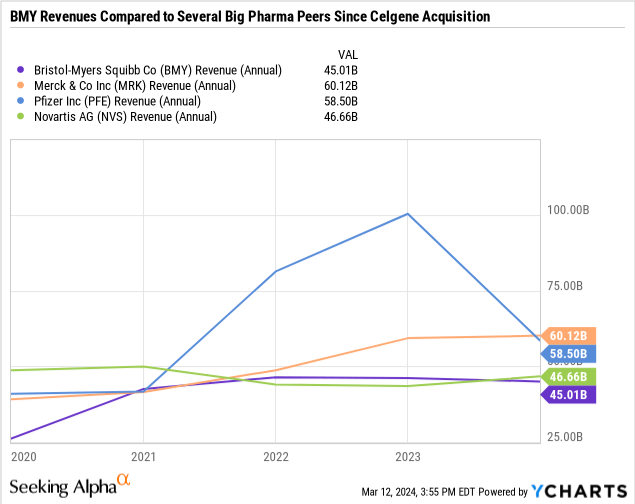
To show another comparison, global sales likewise rose more in line with the same peers following the acquisition.
Despite the recent share price decline, BMY is still solidly among the ranks of the big pharmas, and will continue to remain there. To celebrate its new big pharma status, BMY also increased its dividend growth rate and stepped up its share buybacks.
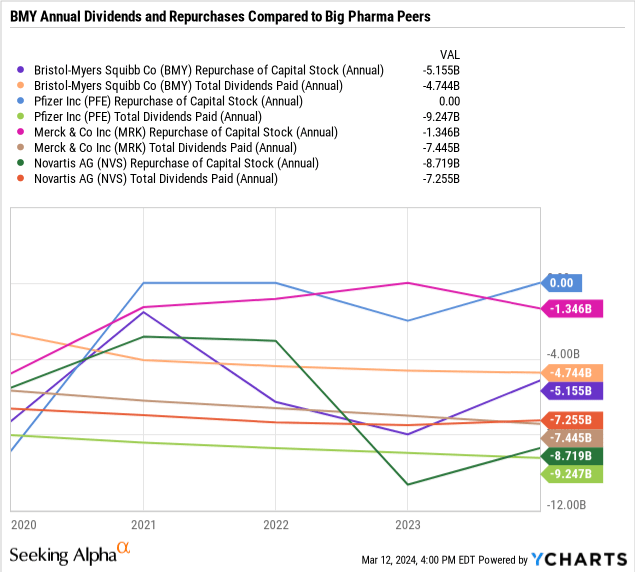
The buyback and dividends here paint a nice picture, but some of the challenges faced by BMY also should be considered.
It should be noted that BMY’s revenue for Q4 2023 posted some slight growth above that of Q4 2022, which may be a positive for the company, but only if the trend is able to continue. As FY2023 revenue was still below that of FY2022, continuing the decline from FY2021 revenue, there will need to be a few more quarters of growth to indicate a meaningful shift.
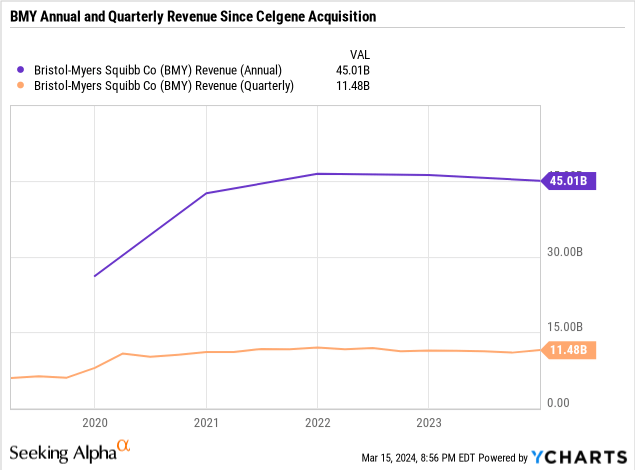
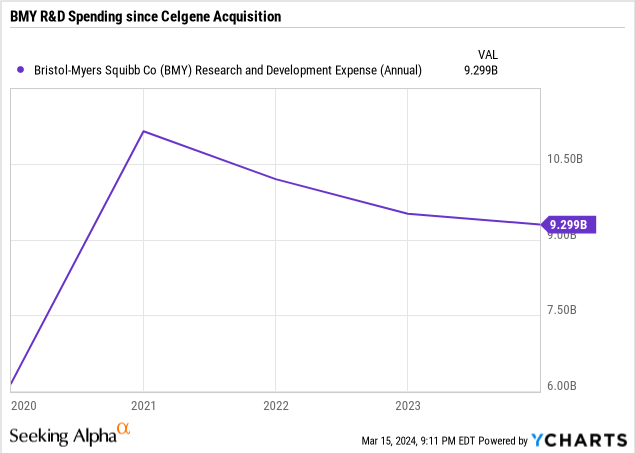
The company believes it may continue, as BMY full year 2024 guidance suggests a potential low single-digit increase above 2023 revenue. However, this may potentially stall as the company’s R&D expenditures have been steadily declining as Revlimid sales have trailed off. Decreased focus on R&D expenditures may reduce both the diversity and productivity of the company’s developmental asset portfolio.
Growing Pains:
Due to its size, the acquisition of Celgene underwent a fairly high level of scrutiny, and the FTC required that one of Celgene’s products, Otezla, be divested before the merger could be finalized. Amgen (AMGN) purchased the asset for $13.4 billion, which gave some immediate cash, but placed a greater reliance on revenue from other existing products that exacerbated some of the emerging revenue growth challenges.
After the merger, BMY offered an additional CVR (Contingent Value Right) to former Celgene shareholders that would be paid out on future achievements. Unfortunately, the CVR requirements were not achieved, as timelines may have been impacted by the COVID-19 pandemic. There have been legal challenges related to the CVR, and more may emerge.
There was also a key risk that BMY calculated during the merger process. Celgene’s Revlimid was a mature product which had reached a significant portion of its revenue potential, and was able to continue climbing after the merger, becoming a valuable part of the BMY portfolio. However, BMY’s Revlimid has run up against the challenge that all mature marketed products face: loss of patent exclusivity.
Loss of Exclusivity:
Revlimid is not the only drug that BMY has facing LOE. By 2030, of the top 3 highest revenue drugs marketed by BMY, each are at risk of, or having been impacted by, looming LOE.
Table 1: Top 3 BMY Therapies at Risk or Having Reached LOE by 2030
|
Drug |
LOE* |
Proportion of FY2023 Revenue |
FY2023 Revenue ($M USD) |
|
Eliquis** |
2026 |
27% |
12,206 |
|
Opdivo |
2028 |
20% |
9,009 |
|
Revlimid |
2021 |
14% |
6,097 |
|
Total |
61% |
45,006 |
*Loss of Exclusivity is last year of key patent protection; **Eliquis was jointly developed and is jointly commercialized between BMY and PFE. BMY records topline Eliquis revenues in its global sales, while deducting Pfizer’s share as a cost of product sold.
These top 3 BMY drugs total 61% of the company’s 2023 revenue. A useful comparison might be to look at a few other peer companies to check the same metric: top 3 drugs by LOE and proportion of 2023 revenue, to see which proportion of company 2023 sales is at-risk or experiencing recent LOE by 2030. Novartis (NVS), Pfizer (PFE), Merck (MRK), AbbVie (ABBV), Roche (OTCQX:RHHBY), and Johnson & Johnson (JNJ) will be considered here as peers of similar scale. For a more clean comparison, non-pharma-segment revenue will be excluded, e.g., animal health, consumer healthcare, generic segments, etc.
Corporate Materials, Chart by Author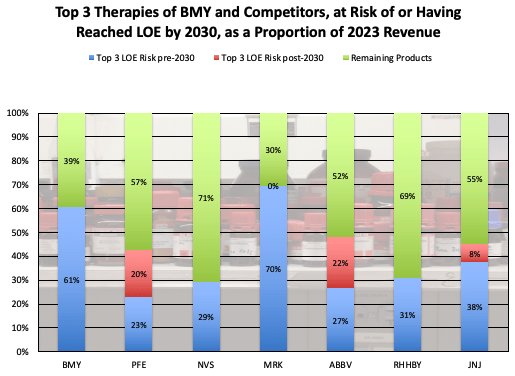
Chart 1: Top 3 selling therapies of BMY and competitors, as a proportion of 2023 revenue, compared by LOE timeframe
Both MRK and BMY are highly concentrated in their most recent full year revenue across their top 3 selling products. MRK’s revenue concentration is largely due to Keytruda, one of the highest grossing drugs in history, and will present its own unique situation for MRK as its 2028 LOE looms. ABBV is also of note, as top ABBV drug Humira began to lose exclusivity in 2022, and its revenue is eroding as it steadily loses patent protection and biosimilar products enter the market. NVS, RHHBY, and JNJ are mostly diversified across their portfolios, and generally have less reliance on single products as top percentages of their revenue. PFE is fairly diversified as well, but its COVID-related products have already experienced a gargantuan rise as well as a rapid decline as the COVID-19 pandemic receded. PFE’s COVID-related products may potentially continue declining further, bringing another aspect to consider for potential investors.
Table 2: Top 3 Revenue Drugs of BMY Competitors in 2023 and LOE
|
Company |
Drug |
LOE |
FY2023 Revenue (M USD)* |
|
PFE |
Comirnaty** |
2041 |
11,220 |
|
Eliquis |
2026 |
6,747 |
|
|
Prevnar |
2026 |
6,440 |
|
|
Total Rev |
57,186 |
||
|
NVS |
Entresto |
2024 |
6,035 |
|
Cosentyx |
2025 |
4,980 |
|
|
Promacta/Revolade |
2025 |
2,269 |
|
|
Total Rev |
45,440 |
||
|
MRK |
Keytruda |
2028 |
25,011 |
|
Gardasil |
2028 |
8,886 |
|
|
Januvia |
2027 |
3,366 |
|
|
Total Rev |
53,583 |
||
|
ABBV |
Humira |
2022 |
14,404 |
|
Skyrizi |
2033 |
7,763 |
|
|
Rinvoq |
2033 |
3,969 |
|
|
Total Rev |
54,318 |
||
|
RHHBY*** |
Ocrevus |
2029 |
6,381 |
|
Hemlibra |
2024 |
4,147 |
|
|
Perjeta |
2024 |
3,768 |
|
|
Total Rev |
46,279 |
||
|
JNJ |
Stelara |
2023 |
10,858 |
|
Darzalex |
2029 |
9,744 |
|
|
Invega Franchise |
2031 |
4,115 |
|
|
Total Rev |
54,759 |
*Biopharma sales only; excluding manufacturing partnerships, animal health, generics, consumer health, MedTech revenue; **COVID-dependent sales; ***CHF not USD
The Path Forward: Potential Generic Erosion
BMY’s concentration of sales in key products stands to the company’s efficiency of marketing its products successfully, but the trade-off lies in a high concentration of revenue at risk of impending LOE. The company is aware of this situation though, and has been preparing for potentially $10+ billion in exclusivity losses from some of these products, some of which have already occurred for Revlimid.
To come up with another perspective, LOE will likely impact Eliquis, Revlimid, and Opdivo in different ways. Eliquis and Revlimid are both small molecules, and are relatively straightforward to manufacture. Additionally since these molecules are straightforward to identify, generics will be seen as chemically equivalent by regulatory bodies, and will not typically require new clinical trials for usage in the same indications as the branded drug. Thus, generics are typically able to be sold at a much lower price, and the branded drug will need to lower its own price to compete. Branded drugs that go generic often lose typically ~80-90% of their original price within 2-5 years of exclusivity loss.
This estimate of price decline might be applicable here. Assuming the volumes of the drugs remain the same, applying an estimate of ~80% potential decline in price would reduce Revlimid sales accordingly. This might mean Revlimid’s peak revenue from 2021 of $12.8B could leave ~$2.5B in sales remaining after possible generic erosion. Roughly $6.8B of these declines have already happened since then, but there may be nearly $3.5B further declines for Revlimid in the next couple years.
The above generic erosion estimate may also be applicable to Eliquis, but Eliquis revenue has not yet reached its last year of exclusivity. Since 2018, Eliquis sales have increased by a compound annual growth rate of ~14%, but that might be a bit high for the company to continue to grow sales through 2026. Taking more factors into account, 2023 sales growth for Eliquis was 4% from 2022, after growing ~10% from 2021 to 2022. It may be reasonable then to forecast BMY Eliquis sales growth through 2026 at a rate of ~6.5%, the average of the 2 most recent periods of growth, which may serve as a potential floor of growth if 2023 was an outlier as a difficult year in the biotech sector. This might place 2026 BMY Eliquis revenue as high as $14.8B, and an 80% erosion from generic entry may leave ~$3B in revenue to the company post-LOE. This could be a decline of roughly $9.2B from 2023 BMY Eliquis sales. These assumptions do not take into consideration any potential impact to Eliquis prices that may occur from CMS negotiations as part of the IRA (Inflation Reduction Act).
Table 3: Forecast Growth of Eliquis Through 2026 (M USD)
|
2023 |
2024E |
2025E |
2026E |
Post-LOE |
|
12,206 |
13,004 |
13,855 |
14,761 |
2,952 |
Source: BMY Corporate Materials, Author’s Projections
Potential Biosimilar Erosion:
Opdivo is a different situation. The drug is a biologic, which is a much larger molecule and is more challenging to formulate. A competing product entering after the branded LOE is known as a biosimilar, as regulatory bodies require a show of biological equivalence in most situations. This means a competitor will typically need to have a trial showing a non-inferior efficacy and safety profile of the biosimilar, commonly across each separate indication approved for the branded drug. This may mean that a biologic might lose share less drastically than a generic small molecule. An illustration may come from one of BMY’s competitors, RHHBY. RHHBY had several key oncology products lose exclusivity over the past several years . Herceptin and Avastin both lost exclusivity in 2019, after Rituxan lost exclusivity in 2018. These drugs give several years of real-world data to use as a possible analog for potential biosimilar impact to Opdivo. In the 3 years following LOE, these 3 products lost on average 66% of revenue mostly due to biosimilar competition entry, which is less than the above impact of generic entry for a small molecule drug, but still significant.
Table 4: Select RHHBY LOE Analogs to Opdivo
|
Drug |
LOE Year |
LOE Year Revenue (M CHF) |
3 Years post LOE (M CHF) |
Erosion (%) |
|
Rituxan |
2018 |
6,752 |
2,565 |
62% |
|
Herceptin |
2019 |
6,039 |
2,142 |
65% |
|
Avastin |
2019 |
7,073 |
2,122 |
70% |
Source: Roche Corporate Materials
Estimating potential biosimilar impact on Opdivo will require a bit more assumption here as well. As Eliquis has not yet reached peak revenue, Opdivo likewise has not yet peaked either. BMY has been aggressively marketing Opdivo and related combo agent Yervoy across a variety of cancers, pursuing a similar strategy to MRK and Keytruda. As such, Opdivo still has significant growth potential over the next several years before the estimated LOE of 2028. Since 2018, Opdivo sales have grown at a compound average annual growth rate of 6%. This takes into account the large negative impact of COVID-19 on Opdivo sales, as many patients postponed initiation or delayed cancer treatments due to their potentially weakened immunological states during 2020. Sales growth recovered in following years, and the growth rate during 2023 was ~9% over 2022 sales. So it seems likely for Opdivo that COVID-19 was an outlier, and probably will grow at a higher rate than the past few years’ CAGR, potentially a similar rate to the 2023 growth of ~9%, that both takes into consideration the growing scale of Opdivo, and continued growth across oncology indications. Projecting this forward through 2028 brings potential BMY Opdivo 2028 sales to ~$14.0B. Applying our above 66% potential biosimilar erosion could indicate BMY post-LOE-erosion sales down to ~$4.8B, which is ~$4.2B lower than the 2023 BMY sales of Opdivo.
Table 5: Forecast Growth of Opdivo Through 2028 (M USD)
|
2023 |
2024E |
2025E |
2026E |
2027E |
2028E |
Post-LOE |
|
9,009 |
9,839 |
10,746 |
11,736 |
12,817 |
13,998 |
4,759 |
Source: BMY Corporate Materials, Author’s Projections
All told here after taking into account 2023 BMY revenues for the top 3 drugs, potentially up to $17B of sales may be eroded through generic and biosimilar impact to key drugs meeting LOE by 2030. BMY has been boosting its pipeline in preparation to offset and work toward counteracting this potential revenue cliff, but still has a challenging path forward.
Future BMY Growth:
Seeking to potentially accelerate the revenue growth and replacement process, BMY turned its strategy toward acquisitions over the past several years. Since the close of the Celgene acquisition in 2019 (excluding asset licensing deals), BMY has wholly acquired or offered to acquire 6 companies to strengthen its pipeline across its oncology, neurology, and cardiovascular sectors.
Table 6: BMY Acquisitions Since 2019
|
Acquisition |
Year |
Amount ($B, if known) |
|
Forbius |
2020 |
|
|
MyoKardia |
2020 |
|
|
Turning Point Therapeutics |
2022 |
|
|
Mirati Therapeutics |
2023 |
4.8 (5.8 with CVR) |
|
Karuna Therapeutics |
2023 |
|
|
RayzeBio |
2023 |
Source: BMY Corporate Materials
These acquisitions are meant to bolster BMY’s pipeline of future growth engines. The company has already closed the Forbius, MyoKardia, Turning Point Therapeutics, Mirati, and RayzeBio acquisitions, while Karuna has not yet been incorporated fully, but for this analysis, will be assumed to have been. Only new compounds will be considered here, and counted only once for each trial if under consideration for multiple indications (e.g., Breyanzi has recently launched, but is in trial for multiple follow-up indications; these follow-up indications will not be considered new molecules). The combination of BMY’s organic and its new inorganic pipelines can be used to estimate potential future scale that will play a key role in offsetting potential LOE erosion, and pave the way for future growth for the company.
Estimates of clinical trial probabilities of success can be used to give a forecast of how many of these assets might reasonably reach market by 2030. Assuming that all assets (being in Phase 1 or beyond) will be able to launch within a 6-7 year timeframe, it may be reasonable to consider these assets in the estimate. Preclinical assets will not be considered, as they have a much lower probability of success, and very few statistically make it to market. The probabilities of successfully passing trial criteria must be taken into consideration. For example, given a hypothetical 100 assets all in phase I, there is a composite (across all therapeutic areas) probability of success of ~18% that these assets will reach approval. Or from another angle, ~82% of these assets will fail their trials before approval, meaning that only ~18 might make it to approval. Because BMY has a large number of trials across a variety of indications, the overall composite probabilities of success will be used here to estimate what proportion of the BMY pipeline might reasonably reach the market by 2030.
Table 7: BMY and Recent Acquisitions’ Clinical Stage Pipelines
|
Phases |
Assets* |
Probability of Success of Phase to Approval |
Risk Adjusted Potential Approved Assets |
|
Phase I |
33 |
18% |
6 |
|
Phase II |
14 |
29% |
4 |
|
Phase III |
9 |
67% |
6 |
Source: BMY Corporate Materials; Risk adjustment done by Author; * Assuming no delay to acquisitions
Based on these probabilities of success of advancing to market, potentially 6 of the existing phase I assets, 4 of the existing phase II, and 6 of the Phase III assets may reasonably reach the market, that is, potentially 16 or so additional new assets reaching the market from the pipeline in its current state by 2030. While it’s not known what revenues those drugs may achieve post-launch, BMY would be greatly benefited if there were a few blockbusters (annual revenues above ~$1B) in the bunch. That said, blockbuster status isn’t the norm. An analysis of drugs approved between 1998-2005 (sufficient history for drugs within the analysis to have reached peak sales), focusing on new compounds, indicated that just 19% of these drugs reached blockbuster status. On another note, 37% of these drugs only had peak revenues of ~$100M or less. Applying these statistics might give an estimate of the potential scale of the hypothetical launched assets from BMY’s pipeline. This estimate will only give the potential scale of the potential revenue from these launches, but because these drugs would all launch at different times, is not a useful estimate for BMY’s potential forecasted revenue. However, it can be considered reassuring if the potential scale of these hypothetical assets is similar in scale to the revenue potentially at risk for LOE.
That might mean that 37% of the 16 hypothetical assets (roughly 6 of them) would not exceed $100M in peak revenue. On the other end, 19% (3 assets) of them may reach blockbuster status. The remaining 7 assets might be estimated to each reach a mean of $600M peak sales. According to this estimate, the smallest-scale asset peak sales might generously reach a combined ~$600M. The midrange assets might reach a combined ~$4.2B in peak sales. The scale of the blockbusters is unknown. It could be that they are modest sellers and only reach ~$1B each, or ~$3B combined peak revenues. It could also be that they are much larger-scale blockbuster assets, potentially reaching peak sales of ~$10B or more each. This might mean that the existing pipeline could potentially collectively add anywhere from $7.8-34.8B in revenue to the company when considering peak revenues.
New Product Portfolio Growth:
BMY also has a portfolio of recently launched products that as of Q4 2023, had reached $~3.6B in sales during the year (compared to ~$2B during full year 2022). These assets will also provide another significant counterbalance for the company’s potential LOE declines, and it’s reasonable to consider the assets to be respectable entrants to BMY’s portfolio. The assets in aggregate are growing sequentially quarter over quarter by ~$100M, so if that trend is assumed to continue through 2030, the revenue stream from the New Product Portfolio may grow from ~$3.6B to ~$14.9B.
Table 8: BMY Projected Potential New Product Portfolio Growth (M USD)
|
2022 |
2023 |
2024E |
2025E |
2026E |
2027E |
2028E |
2029E |
2030E |
|
2,030 |
3,585 |
5,288 |
6,888 |
8,488 |
10,088 |
11,688 |
13,288 |
14,888 |
Source: BMY Corporate Materials, Author’s Projections
Growth Needed to Offset Potential LOE:
This information may be used to get a directional gauge of the magnitude of some of BMY’s known main revenue drivers, compared to the potential LOE degradation of the top 3 products. Taking into account only the potential growth of BMY’s current (organic and recently acquired) pipeline, the New Product Portfolio growth, and the potential LOE degradation, but not considering any growth or shrinkage of the remaining BMY portfolio (as there will be smaller impact LOE erosion and other growth that may balance out), or any other future potential BMY acquisitions. With the assumptions laid out, there may be potentially up to ~$17B in LOE-driven erosion from 2023 levels by 2030. There is also revenue growth potential by 2030 of an additional ~$11B from the existing New Product Portfolio, and ~$7.8B (conservatively) from the existing clinical stage pipeline, or more depending on the number and magnitude of potential blockbuster drugs the pipeline produces. By that perspective, BMY will likely more than overcome its potential LOE risk by 2030, with revenue potential of at least ~$19B. That said, the sequence of events will have to be very favorable in order for BMY to overcome its potential revenue erosion due to LOE, particularly due to Revlimid. Otherwise, analyst sentiment may reflect a shrinking topline, and the stock price will likely suffer accordingly until the revenue growth exceeds the losses.
Table 9: BMY Potential LOE Erosion and Growth Drivers From 2023 (M USD)
|
LOE Erosion from 2023 |
Estimated New Product Portfolio Growth |
Known Pipeline Asset Estimated Low Growth* |
Known Pipeline Asset Estimated High Growth** |
|
(17,036) |
11,303 |
7,800 |
34,800 |
Source: Author’s Projections. * Low growth scenario assumes 3 blockbusters from pipeline each reaching peak sales of ~$1B each (Low growth and high growth scenarios are exclusive of each other); ** High growth scenario assumes 3 blockbusters from pipeline, each reaching peak sales of ~$10B each
BMY will be fine in the long run, but the near-term may be spotty as Revlimid rolls off exclusivity, and Eliquis prepares for 2026 LOE. The company’s current growth prospects will be able to offset the potential LOE erosion, but share price may stagnate in the near term until growth can outpace ongoing and potential erosion.
BMY Potential LOE Erosion and Growth Drivers (Author’s Projections)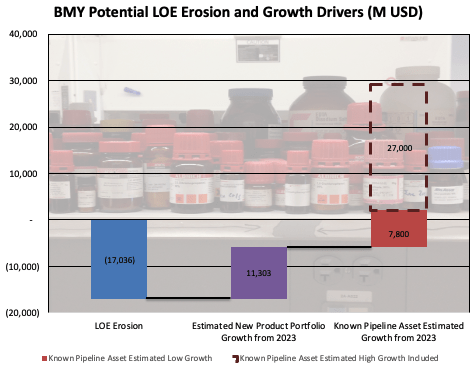
Final Thoughts:
Because BMY has potentially significant LOE erosion to contend with, its current pipeline and New Product Portfolio will be incredibly important for the company’s growth prospects. The company will likely be able to overcome the potential LOE impacts, but there is a chance that the LOE impacts overwhelm near-term revenue growth, resulting in a falling topline for the next several years. As this may be disappointing to analysts and may persist for a significant time period, my personal preference is to consider BMY a sell/avoid until a predominance of these LOE impacts have passed. There is potential for Revlimid LOE erosion to continue for the next year or two, after which significant Eliquis LOE erosion may begin following 2026. While some investors may consider this to be a buy-on-dip opportunity, my perspective is these potential nearer-term LOE may result in a dip that keeps dipping. And just like my view on a shared plate of nachos, I’m not a fan of a double-dip here.
Potential Upside Factors:
There is a chance that BMY outperforms the above estimations. If the New Product Portfolio grows faster than expected, that may present a meaningful improvement. Additionally, a new focus on sustainable increased organic R&D to diversify the company’s pipeline, offset by efficient, effective, and synergistic integration of the recent acquisitions, could also increase confidence in the company’s growth. Aside from that, there is the chance that the company’s current pipeline produce one or more blockbusters on the scale of Revlimid/Eliquis/Opdivo, which alone could boost investor enthusiasm. Should some of these factors reveal themselves, I may be inclined to potentially consider a purchase.
Editor’s Note: This article discusses one or more securities that do not trade on a major U.S. exchange. Please be aware of the risks associated with these stocks.

 Q2 2024 Earnings Call Transcript")

